Cities: Katy, TX (12.25%) ,
Cinco Ranch, TX (3.63%) ,
Houston, TX (1.42%) Counties: Fort Bend County, TX (88.90%) ,
Harris County, TX (6.56%) ,
Waller County, TX (4.54%) Estimated zip code population in 2022: 134,439
Zip code population in 2010: 61,600
Zip code population in 2000: 11,505
Houses and condos: 44,272
Renter-occupied apartments: 12,149
% of renters here:
28%State:
38%
March 2022 cost of living index in zip code 77494: 98.4
(near average, U.S. average is 100)
Land area: 40.8
sq. mi.
Water area: 0.3
sq. mi.
Population density: 3,294 people per square mile (average).
OSM Map
General Map
Google Map
MSN Map
OSM Map
General Map
Google Map
MSN Map
OSM Map
General Map
Google Map
MSN Map
OSM Map
General Map
Google Map
MSN Map
Please wait while loading the map...
Real estate property taxes paid for housing units in 2022:
This zip code:
2.1% ($10,197)Texas:
1.5% ($4,050)
Median real estate property taxes paid for housing units with mortgages in 2022: $10,303 (2.1%)
Median real estate property taxes paid for housing units with no mortgage in 2022: $10,244 (2.1%)
Profiles of local businesses
Business Search - 14 Million verified businesses
Males: 66,227 Females: 68,212
For population 25 years and over in 77494:
High school or higher: 98.8%Bachelor's degree or higher: 69.7%Graduate or professional degree: 29.9%Unemployed: 3.9%Mean travel time to work (commute): 35.5 minutes
For population 15 years and over in 77494:
Never married: 22.6%Now married: 68.8%Separated: 0.6%Widowed: 2.7%Divorced: 5.2%
Zip code 77494 compared to state average:
Median household income above state average. Median house value above state average. Foreign-born population percentage significantly above state average. Length of stay since moving in below state average. Number of rooms per house above state average. House age significantly below state average. Percentage of population with a bachelor's degree or higher above state average. 54,366 40.4% White 33,524 24.9% Hispanic or Latino 31,413 23.4% Asian 9,394 7.0% Black 4,980 3.7% Two or more races 553 0.4% Some other race 130 0.10% Native Hawaiian and Other 75 0.06% American Indian
Data:
Median household income ($)
Median household income (% change since 2000)
Household income diversity
Ratio of average income to average house value (%)
Ratio of average income to average rent
Median household income ($) - White
Median household income ($) - Black or African American
Median household income ($) - Asian
Median household income ($) - Hispanic or Latino
Median household income ($) - American Indian and Alaska Native
Median household income ($) - Multirace
Median household income ($) - Other Race
Median household income for houses/condos with a mortgage ($)
Median household income for apartments without a mortgage ($)
Races - White alone (%)
Races - White alone (% change since 2000)
Races - Black alone (%)
Races - Black alone (% change since 2000)
Races - American Indian alone (%)
Races - American Indian alone (% change since 2000)
Races - Asian alone (%)
Races - Asian alone (% change since 2000)
Races - Hispanic (%)
Races - Hispanic (% change since 2000)
Races - Native Hawaiian and Other Pacific Islander alone (%)
Races - Native Hawaiian and Other Pacific Islander alone (% change since 2000)
Races - Two or more races (%)
Races - Two or more races (% change since 2000)
Races - Other race alone (%)
Races - Other race alone (% change since 2000)
Racial diversity
Unemployment (%)
Unemployment (% change since 2000)
Unemployment (%) - White
Unemployment (%) - Black or African American
Unemployment (%) - Asian
Unemployment (%) - Hispanic or Latino
Unemployment (%) - American Indian and Alaska Native
Unemployment (%) - Multirace
Unemployment (%) - Other Race
Population density (people per square mile)
Population - Males (%)
Population - Females (%)
Population - Males (%) - White
Population - Males (%) - Black or African American
Population - Males (%) - Asian
Population - Males (%) - Hispanic or Latino
Population - Males (%) - American Indian and Alaska Native
Population - Males (%) - Multirace
Population - Males (%) - Other Race
Population - Females (%) - White
Population - Females (%) - Black or African American
Population - Females (%) - Asian
Population - Females (%) - Hispanic or Latino
Population - Females (%) - American Indian and Alaska Native
Population - Females (%) - Multirace
Population - Females (%) - Other Race
Coronavirus confirmed cases (Apr 25, 2024)
Deaths caused by coronavirus (Apr 25, 2024)
Coronavirus confirmed cases (per 100k population) (Apr 25, 2024)
Deaths caused by coronavirus (per 100k population) (Apr 25, 2024)
Daily increase in number of cases (Apr 25, 2024)
Weekly increase in number of cases (Apr 25, 2024)
Cases doubled (in days) (Apr 25, 2024)
Hospitalized patients (Apr 18, 2022)
Negative test results (Apr 18, 2022)
Total test results (Apr 18, 2022)
COVID Vaccine doses distributed (per 100k population) (Sep 19, 2023)
COVID Vaccine doses administered (per 100k population) (Sep 19, 2023)
COVID Vaccine doses distributed (Sep 19, 2023)
COVID Vaccine doses administered (Sep 19, 2023)
Likely homosexual households (%)
Likely homosexual households (% change since 2000)
Likely homosexual households - Lesbian couples (%)
Likely homosexual households - Lesbian couples (% change since 2000)
Likely homosexual households - Gay men (%)
Likely homosexual households - Gay men (% change since 2000)
Cost of living index
Median gross rent ($)
Median contract rent ($)
Median monthly housing costs ($)
Median house or condo value ($)
Median house or condo value ($ change since 2000)
Mean house or condo value by units in structure - 1, detached ($)
Mean house or condo value by units in structure - 1, attached ($)
Mean house or condo value by units in structure - 2 ($)
Mean house or condo value by units in structure by units in structure - 3 or 4 ($)
Mean house or condo value by units in structure - 5 or more ($)
Mean house or condo value by units in structure - Boat, RV, van, etc. ($)
Mean house or condo value by units in structure - Mobile home ($)
Median house or condo value ($) - White
Median house or condo value ($) - Black or African American
Median house or condo value ($) - Asian
Median house or condo value ($) - Hispanic or Latino
Median house or condo value ($) - American Indian and Alaska Native
Median house or condo value ($) - Multirace
Median house or condo value ($) - Other Race
Median resident age
Resident age diversity
Median resident age - Males
Median resident age - Females
Median resident age - White
Median resident age - Black or African American
Median resident age - Asian
Median resident age - Hispanic or Latino
Median resident age - American Indian and Alaska Native
Median resident age - Multirace
Median resident age - Other Race
Median resident age - Males - White
Median resident age - Males - Black or African American
Median resident age - Males - Asian
Median resident age - Males - Hispanic or Latino
Median resident age - Males - American Indian and Alaska Native
Median resident age - Males - Multirace
Median resident age - Males - Other Race
Median resident age - Females - White
Median resident age - Females - Black or African American
Median resident age - Females - Asian
Median resident age - Females - Hispanic or Latino
Median resident age - Females - American Indian and Alaska Native
Median resident age - Females - Multirace
Median resident age - Females - Other Race
Commute - mean travel time to work (minutes)
Travel time to work - Less than 5 minutes (%)
Travel time to work - Less than 5 minutes (% change since 2000)
Travel time to work - 5 to 9 minutes (%)
Travel time to work - 5 to 9 minutes (% change since 2000)
Travel time to work - 10 to 19 minutes (%)
Travel time to work - 10 to 19 minutes (% change since 2000)
Travel time to work - 20 to 29 minutes (%)
Travel time to work - 20 to 29 minutes (% change since 2000)
Travel time to work - 30 to 39 minutes (%)
Travel time to work - 30 to 39 minutes (% change since 2000)
Travel time to work - 40 to 59 minutes (%)
Travel time to work - 40 to 59 minutes (% change since 2000)
Travel time to work - 60 to 89 minutes (%)
Travel time to work - 60 to 89 minutes (% change since 2000)
Travel time to work - 90 or more minutes (%)
Travel time to work - 90 or more minutes (% change since 2000)
Marital status - Never married (%)
Marital status - Now married (%)
Marital status - Separated (%)
Marital status - Widowed (%)
Marital status - Divorced (%)
Median family income ($)
Median family income (% change since 2000)
Median non-family income ($)
Median non-family income (% change since 2000)
Median per capita income ($)
Median per capita income (% change since 2000)
Median family income ($) - White
Median family income ($) - Black or African American
Median family income ($) - Asian
Median family income ($) - Hispanic or Latino
Median family income ($) - American Indian and Alaska Native
Median family income ($) - Multirace
Median family income ($) - Other Race
Median year house/condo built
Median year apartment built
Year house built - Built 2005 or later (%)
Year house built - Built 2000 to 2004 (%)
Year house built - Built 1990 to 1999 (%)
Year house built - Built 1980 to 1989 (%)
Year house built - Built 1970 to 1979 (%)
Year house built - Built 1960 to 1969 (%)
Year house built - Built 1950 to 1959 (%)
Year house built - Built 1940 to 1949 (%)
Year house built - Built 1939 or earlier (%)
Average household size
Household density (households per square mile)
Average household size - White
Average household size - Black or African American
Average household size - Asian
Average household size - Hispanic or Latino
Average household size - American Indian and Alaska Native
Average household size - Multirace
Average household size - Other Race
Occupied housing units (%)
Vacant housing units (%)
Owner occupied housing units (%)
Renter occupied housing units (%)
Vacancy status - For rent (%)
Vacancy status - For sale only (%)
Vacancy status - Rented or sold, not occupied (%)
Vacancy status - For seasonal, recreational, or occasional use (%)
Vacancy status - For migrant workers (%)
Vacancy status - Other vacant (%)
Residents with income below the poverty level (%)
Residents with income below 50% of the poverty level (%)
Children below poverty level (%)
Poor families by family type - Married-couple family (%)
Poor families by family type - Male, no wife present (%)
Poor families by family type - Female, no husband present (%)
Poverty status for native-born residents (%)
Poverty status for foreign-born residents (%)
Poverty among high school graduates not in families (%)
Poverty among people who did not graduate high school not in families (%)
Residents with income below the poverty level (%) - White
Residents with income below the poverty level (%) - Black or African American
Residents with income below the poverty level (%) - Asian
Residents with income below the poverty level (%) - Hispanic or Latino
Residents with income below the poverty level (%) - American Indian and Alaska Native
Residents with income below the poverty level (%) - Multirace
Residents with income below the poverty level (%) - Other Race
Air pollution - Air Quality Index (AQI)
Air pollution - CO
Air pollution - NO2
Air pollution - SO2
Air pollution - Ozone
Air pollution - PM10
Air pollution - PM25
Air pollution - Pb
Crime - Murders per 100,000 population
Crime - Rapes per 100,000 population
Crime - Robberies per 100,000 population
Crime - Assaults per 100,000 population
Crime - Burglaries per 100,000 population
Crime - Thefts per 100,000 population
Crime - Auto thefts per 100,000 population
Crime - Arson per 100,000 population
Crime - City-data.com crime index
Crime - Violent crime index
Crime - Property crime index
Crime - Murders per 100,000 population (5 year average)
Crime - Rapes per 100,000 population (5 year average)
Crime - Robberies per 100,000 population (5 year average)
Crime - Assaults per 100,000 population (5 year average)
Crime - Burglaries per 100,000 population (5 year average)
Crime - Thefts per 100,000 population (5 year average)
Crime - Auto thefts per 100,000 population (5 year average)
Crime - Arson per 100,000 population (5 year average)
Crime - City-data.com crime index (5 year average)
Crime - Violent crime index (5 year average)
Crime - Property crime index (5 year average)
1996 Presidential Elections Results (%) - Democratic Party (Clinton)
1996 Presidential Elections Results (%) - Republican Party (Dole)
1996 Presidential Elections Results (%) - Other
2000 Presidential Elections Results (%) - Democratic Party (Gore)
2000 Presidential Elections Results (%) - Republican Party (Bush)
2000 Presidential Elections Results (%) - Other
2004 Presidential Elections Results (%) - Democratic Party (Kerry)
2004 Presidential Elections Results (%) - Republican Party (Bush)
2004 Presidential Elections Results (%) - Other
2008 Presidential Elections Results (%) - Democratic Party (Obama)
2008 Presidential Elections Results (%) - Republican Party (McCain)
2008 Presidential Elections Results (%) - Other
2012 Presidential Elections Results (%) - Democratic Party (Obama)
2012 Presidential Elections Results (%) - Republican Party (Romney)
2012 Presidential Elections Results (%) - Other
2016 Presidential Elections Results (%) - Democratic Party (Clinton)
2016 Presidential Elections Results (%) - Republican Party (Trump)
2016 Presidential Elections Results (%) - Other
2020 Presidential Elections Results (%) - Democratic Party (Biden)
2020 Presidential Elections Results (%) - Republican Party (Trump)
2020 Presidential Elections Results (%) - Other
Ancestries Reported - Arab (%)
Ancestries Reported - Czech (%)
Ancestries Reported - Danish (%)
Ancestries Reported - Dutch (%)
Ancestries Reported - English (%)
Ancestries Reported - French (%)
Ancestries Reported - French Canadian (%)
Ancestries Reported - German (%)
Ancestries Reported - Greek (%)
Ancestries Reported - Hungarian (%)
Ancestries Reported - Irish (%)
Ancestries Reported - Italian (%)
Ancestries Reported - Lithuanian (%)
Ancestries Reported - Norwegian (%)
Ancestries Reported - Polish (%)
Ancestries Reported - Portuguese (%)
Ancestries Reported - Russian (%)
Ancestries Reported - Scotch-Irish (%)
Ancestries Reported - Scottish (%)
Ancestries Reported - Slovak (%)
Ancestries Reported - Subsaharan African (%)
Ancestries Reported - Swedish (%)
Ancestries Reported - Swiss (%)
Ancestries Reported - Ukrainian (%)
Ancestries Reported - United States (%)
Ancestries Reported - Welsh (%)
Ancestries Reported - West Indian (%)
Ancestries Reported - Other (%)
Educational Attainment - No schooling completed (%)
Educational Attainment - Less than high school (%)
Educational Attainment - High school or equivalent (%)
Educational Attainment - Less than 1 year of college (%)
Educational Attainment - 1 or more years of college (%)
Educational Attainment - Associate degree (%)
Educational Attainment - Bachelor's degree (%)
Educational Attainment - Master's degree (%)
Educational Attainment - Professional school degree (%)
Educational Attainment - Doctorate degree (%)
School Enrollment - Nursery, preschool (%)
School Enrollment - Kindergarten (%)
School Enrollment - Grade 1 to 4 (%)
School Enrollment - Grade 5 to 8 (%)
School Enrollment - Grade 9 to 12 (%)
School Enrollment - College undergrad (%)
School Enrollment - Graduate or professional (%)
School Enrollment - Not enrolled in school (%)
School enrollment - Public schools (%)
School enrollment - Private schools (%)
School enrollment - Not enrolled (%)
Median number of rooms in houses and condos
Median number of rooms in apartments
Housing units lacking complete plumbing facilities (%)
Housing units lacking complete kitchen facilities (%)
Density of houses
Urban houses (%)
Rural houses (%)
Households with people 60 years and over (%)
Households with people 65 years and over (%)
Households with people 75 years and over (%)
Households with one or more nonrelatives (%)
Households with no nonrelatives (%)
Population in households (%)
Family households (%)
Nonfamily households (%)
Population in families (%)
Family households with own children (%)
Median number of bedrooms in owner occupied houses
Mean number of bedrooms in owner occupied houses
Median number of bedrooms in renter occupied houses
Mean number of bedrooms in renter occupied houses
Median number of vehichles in owner occupied houses
Mean number of vehichles in owner occupied houses
Median number of vehichles in renter occupied houses
Mean number of vehichles in renter occupied houses
Mortgage status - with mortgage (%)
Mortgage status - with second mortgage (%)
Mortgage status - with home equity loan (%)
Mortgage status - with both second mortgage and home equity loan (%)
Mortgage status - without a mortgage (%)
Average family size
Average family size - White
Average family size - Black or African American
Average family size - Asian
Average family size - Hispanic or Latino
Average family size - American Indian and Alaska Native
Average family size - Multirace
Average family size - Other Race
Geographical mobility - Same house 1 year ago (%)
Geographical mobility - Moved within same county (%)
Geographical mobility - Moved from different county within same state (%)
Geographical mobility - Moved from different state (%)
Geographical mobility - Moved from abroad (%)
Place of birth - Born in state of residence (%)
Place of birth - Born in other state (%)
Place of birth - Native, outside of US (%)
Place of birth - Foreign born (%)
Housing units in structures - 1, detached (%)
Housing units in structures - 1, attached (%)
Housing units in structures - 2 (%)
Housing units in structures - 3 or 4 (%)
Housing units in structures - 5 to 9 (%)
Housing units in structures - 10 to 19 (%)
Housing units in structures - 20 to 49 (%)
Housing units in structures - 50 or more (%)
Housing units in structures - Mobile home (%)
Housing units in structures - Boat, RV, van, etc. (%)
House/condo owner moved in on average (years ago)
Renter moved in on average (years ago)
Year householder moved into unit - Moved in 1999 to March 2000 (%)
Year householder moved into unit - Moved in 1995 to 1998 (%)
Year householder moved into unit - Moved in 1990 to 1994 (%)
Year householder moved into unit - Moved in 1980 to 1989 (%)
Year householder moved into unit - Moved in 1970 to 1979 (%)
Year householder moved into unit - Moved in 1969 or earlier (%)
Means of transportation to work - Drove car alone (%)
Means of transportation to work - Carpooled (%)
Means of transportation to work - Public transportation (%)
Means of transportation to work - Bus or trolley bus (%)
Means of transportation to work - Streetcar or trolley car (%)
Means of transportation to work - Subway or elevated (%)
Means of transportation to work - Railroad (%)
Means of transportation to work - Ferryboat (%)
Means of transportation to work - Taxicab (%)
Means of transportation to work - Motorcycle (%)
Means of transportation to work - Bicycle (%)
Means of transportation to work - Walked (%)
Means of transportation to work - Other means (%)
Working at home (%)
Industry diversity
Most Common Industries - Agriculture, forestry, fishing and hunting, and mining (%)
Most Common Industries - Agriculture, forestry, fishing and hunting (%)
Most Common Industries - Mining, quarrying, and oil and gas extraction (%)
Most Common Industries - Construction (%)
Most Common Industries - Manufacturing (%)
Most Common Industries - Wholesale trade (%)
Most Common Industries - Retail trade (%)
Most Common Industries - Transportation and warehousing, and utilities (%)
Most Common Industries - Transportation and warehousing (%)
Most Common Industries - Utilities (%)
Most Common Industries - Information (%)
Most Common Industries - Finance and insurance, and real estate and rental and leasing (%)
Most Common Industries - Finance and insurance (%)
Most Common Industries - Real estate and rental and leasing (%)
Most Common Industries - Professional, scientific, and management, and administrative and waste management services (%)
Most Common Industries - Professional, scientific, and technical services (%)
Most Common Industries - Management of companies and enterprises (%)
Most Common Industries - Administrative and support and waste management services (%)
Most Common Industries - Educational services, and health care and social assistance (%)
Most Common Industries - Educational services (%)
Most Common Industries - Health care and social assistance (%)
Most Common Industries - Arts, entertainment, and recreation, and accommodation and food services (%)
Most Common Industries - Arts, entertainment, and recreation (%)
Most Common Industries - Accommodation and food services (%)
Most Common Industries - Other services, except public administration (%)
Most Common Industries - Public administration (%)
Occupation diversity
Most Common Occupations - Management, business, science, and arts occupations (%)
Most Common Occupations - Management, business, and financial occupations (%)
Most Common Occupations - Management occupations (%)
Most Common Occupations - Business and financial operations occupations (%)
Most Common Occupations - Computer, engineering, and science occupations (%)
Most Common Occupations - Computer and mathematical occupations (%)
Most Common Occupations - Architecture and engineering occupations (%)
Most Common Occupations - Life, physical, and social science occupations (%)
Most Common Occupations - Education, legal, community service, arts, and media occupations (%)
Most Common Occupations - Community and social service occupations (%)
Most Common Occupations - Legal occupations (%)
Most Common Occupations - Education, training, and library occupations (%)
Most Common Occupations - Arts, design, entertainment, sports, and media occupations (%)
Most Common Occupations - Healthcare practitioners and technical occupations (%)
Most Common Occupations - Health diagnosing and treating practitioners and other technical occupations (%)
Most Common Occupations - Health technologists and technicians (%)
Most Common Occupations - Service occupations (%)
Most Common Occupations - Healthcare support occupations (%)
Most Common Occupations - Protective service occupations (%)
Most Common Occupations - Fire fighting and prevention, and other protective service workers including supervisors (%)
Most Common Occupations - Law enforcement workers including supervisors (%)
Most Common Occupations - Food preparation and serving related occupations (%)
Most Common Occupations - Building and grounds cleaning and maintenance occupations (%)
Most Common Occupations - Personal care and service occupations (%)
Most Common Occupations - Sales and office occupations (%)
Most Common Occupations - Sales and related occupations (%)
Most Common Occupations - Office and administrative support occupations (%)
Most Common Occupations - Natural resources, construction, and maintenance occupations (%)
Most Common Occupations - Farming, fishing, and forestry occupations (%)
Most Common Occupations - Construction and extraction occupations (%)
Most Common Occupations - Installation, maintenance, and repair occupations (%)
Most Common Occupations - Production, transportation, and material moving occupations (%)
Most Common Occupations - Production occupations (%)
Most Common Occupations - Transportation occupations (%)
Most Common Occupations - Material moving occupations (%)
People in Group quarters - Institutionalized population (%)
People in Group quarters - Correctional institutions (%)
People in Group quarters - Federal prisons and detention centers (%)
People in Group quarters - Halfway houses (%)
People in Group quarters - Local jails and other confinement facilities (including police lockups) (%)
People in Group quarters - Military disciplinary barracks (%)
People in Group quarters - State prisons (%)
People in Group quarters - Other types of correctional institutions (%)
People in Group quarters - Nursing homes (%)
People in Group quarters - Hospitals/wards, hospices, and schools for the handicapped (%)
People in Group quarters - Hospitals/wards and hospices for chronically ill (%)
People in Group quarters - Hospices or homes for chronically ill (%)
People in Group quarters - Military hospitals or wards for chronically ill (%)
People in Group quarters - Other hospitals or wards for chronically ill (%)
People in Group quarters - Hospitals or wards for drug/alcohol abuse (%)
People in Group quarters - Mental (Psychiatric) hospitals or wards (%)
People in Group quarters - Schools, hospitals, or wards for the mentally retarded (%)
People in Group quarters - Schools, hospitals, or wards for the physically handicapped (%)
People in Group quarters - Institutions for the deaf (%)
People in Group quarters - Institutions for the blind (%)
People in Group quarters - Orthopedic wards and institutions for the physically handicapped (%)
People in Group quarters - Wards in general hospitals for patients who have no usual home elsewhere (%)
People in Group quarters - Wards in military hospitals for patients who have no usual home elsewhere (%)
People in Group quarters - Juvenile institutions (%)
People in Group quarters - Long-term care (%)
People in Group quarters - Homes for abused, dependent, and neglected children (%)
People in Group quarters - Residential treatment centers for emotionally disturbed children (%)
People in Group quarters - Training schools for juvenile delinquents (%)
People in Group quarters - Short-term care, detention or diagnostic centers for delinquent children (%)
People in Group quarters - Type of juvenile institution unknown (%)
People in Group quarters - Noninstitutionalized population (%)
People in Group quarters - College dormitories (includes college quarters off campus) (%)
People in Group quarters - Military quarters (%)
People in Group quarters - On base (%)
People in Group quarters - Barracks, unaccompanied personnel housing (UPH), (Enlisted/Officer), ;and similar group living quarters for military personnel (%)
People in Group quarters - Transient quarters for temporary residents (%)
People in Group quarters - Military ships (%)
People in Group quarters - Group homes (%)
People in Group quarters - Homes or halfway houses for drug/alcohol abuse (%)
People in Group quarters - Homes for the mentally ill (%)
People in Group quarters - Homes for the mentally retarded (%)
People in Group quarters - Homes for the physically handicapped (%)
People in Group quarters - Other group homes (%)
People in Group quarters - Religious group quarters (%)
People in Group quarters - Dormitories (%)
People in Group quarters - Agriculture workers' dormitories on farms (%)
People in Group quarters - Job Corps and vocational training facilities (%)
People in Group quarters - Other workers' dormitories (%)
People in Group quarters - Crews of maritime vessels (%)
People in Group quarters - Other nonhousehold living situations (%)
People in Group quarters - Other noninstitutional group quarters (%)
Residents speaking English at home (%)
Residents speaking English at home - Born in the United States (%)
Residents speaking English at home - Native, born elsewhere (%)
Residents speaking English at home - Foreign born (%)
Residents speaking Spanish at home (%)
Residents speaking Spanish at home - Born in the United States (%)
Residents speaking Spanish at home - Native, born elsewhere (%)
Residents speaking Spanish at home - Foreign born (%)
Residents speaking other language at home (%)
Residents speaking other language at home - Born in the United States (%)
Residents speaking other language at home - Native, born elsewhere (%)
Residents speaking other language at home - Foreign born (%)
Class of Workers - Employee of private company (%)
Class of Workers - Self-employed in own incorporated business (%)
Class of Workers - Private not-for-profit wage and salary workers (%)
Class of Workers - Local government workers (%)
Class of Workers - State government workers (%)
Class of Workers - Federal government workers (%)
Class of Workers - Self-employed workers in own not incorporated business and Unpaid family workers (%)
House heating fuel used in houses and condos - Utility gas (%)
House heating fuel used in houses and condos - Bottled, tank, or LP gas (%)
House heating fuel used in houses and condos - Electricity (%)
House heating fuel used in houses and condos - Fuel oil, kerosene, etc. (%)
House heating fuel used in houses and condos - Coal or coke (%)
House heating fuel used in houses and condos - Wood (%)
House heating fuel used in houses and condos - Solar energy (%)
House heating fuel used in houses and condos - Other fuel (%)
House heating fuel used in houses and condos - No fuel used (%)
House heating fuel used in apartments - Utility gas (%)
House heating fuel used in apartments - Bottled, tank, or LP gas (%)
House heating fuel used in apartments - Electricity (%)
House heating fuel used in apartments - Fuel oil, kerosene, etc. (%)
House heating fuel used in apartments - Coal or coke (%)
House heating fuel used in apartments - Wood (%)
House heating fuel used in apartments - Solar energy (%)
House heating fuel used in apartments - Other fuel (%)
House heating fuel used in apartments - No fuel used (%)
Armed forces status - In Armed Forces (%)
Armed forces status - Civilian (%)
Armed forces status - Civilian - Veteran (%)
Armed forces status - Civilian - Nonveteran (%)
Fatal accidents locations in years 2005-2021
Fatal accidents locations in 2005
Fatal accidents locations in 2006
Fatal accidents locations in 2007
Fatal accidents locations in 2008
Fatal accidents locations in 2009
Fatal accidents locations in 2010
Fatal accidents locations in 2011
Fatal accidents locations in 2012
Fatal accidents locations in 2013
Fatal accidents locations in 2014
Fatal accidents locations in 2015
Fatal accidents locations in 2016
Fatal accidents locations in 2017
Fatal accidents locations in 2018
Fatal accidents locations in 2019
Fatal accidents locations in 2020
Fatal accidents locations in 2021
Alcohol use - People drinking some alcohol every month (%)
Alcohol use - People not drinking at all (%)
Alcohol use - Average days/month drinking alcohol
Alcohol use - Average drinks/week
Alcohol use - Average days/year people drink much
Audiometry - Average condition of hearing (%)
Audiometry - People that can hear a whisper from across a quiet room (%)
Audiometry - People that can hear normal voice from across a quiet room (%)
Audiometry - Ears ringing, roaring, buzzing (%)
Audiometry - Had a job exposure to loud noise (%)
Audiometry - Had off-work exposure to loud noise (%)
Blood Pressure & Cholesterol - Has high blood pressure (%)
Blood Pressure & Cholesterol - Checking blood pressure at home (%)
Blood Pressure & Cholesterol - Frequently checking blood cholesterol (%)
Blood Pressure & Cholesterol - Has high cholesterol level (%)
Consumer Behavior - Money monthly spent on food at supermarket/grocery store
Consumer Behavior - Money monthly spent on food at other stores
Consumer Behavior - Money monthly spent on eating out
Consumer Behavior - Money monthly spent on carryout/delivered foods
Consumer Behavior - Income spent on food at supermarket/grocery store (%)
Consumer Behavior - Income spent on food at other stores (%)
Consumer Behavior - Income spent on eating out (%)
Consumer Behavior - Income spent on carryout/delivered foods (%)
Current Health Status - General health condition (%)
Current Health Status - Blood donors (%)
Current Health Status - Has blood ever tested for HIV virus (%)
Current Health Status - Left-handed people (%)
Dermatology - People using sunscreen (%)
Diabetes - Diabetics (%)
Diabetes - Had a blood test for high blood sugar (%)
Diabetes - People taking insulin (%)
Diet Behavior & Nutrition - Diet health (%)
Diet Behavior & Nutrition - Milk product consumption (# of products/month)
Diet Behavior & Nutrition - Meals not home prepared (#/week)
Diet Behavior & Nutrition - Meals from fast food or pizza place (#/week)
Diet Behavior & Nutrition - Ready-to-eat foods (#/month)
Diet Behavior & Nutrition - Frozen meals/pizza (#/month)
Drug Use - People that ever used marijuana or hashish (%)
Drug Use - Ever used hard drugs (%)
Drug Use - Ever used any form of cocaine (%)
Drug Use - Ever used heroin (%)
Drug Use - Ever used methamphetamine (%)
Health Insurance - People covered by health insurance (%)
Kidney Conditions-Urology - Avg. # of times urinating at night
Medical Conditions - People with asthma (%)
Medical Conditions - People with anemia (%)
Medical Conditions - People with psoriasis (%)
Medical Conditions - People with overweight (%)
Medical Conditions - Elderly people having difficulties in thinking or remembering (%)
Medical Conditions - People who ever received blood transfusion (%)
Medical Conditions - People having trouble seeing even with glass/contacts (%)
Medical Conditions - People with arthritis (%)
Medical Conditions - People with gout (%)
Medical Conditions - People with congestive heart failure (%)
Medical Conditions - People with coronary heart disease (%)
Medical Conditions - People with angina pectoris (%)
Medical Conditions - People who ever had heart attack (%)
Medical Conditions - People who ever had stroke (%)
Medical Conditions - People with emphysema (%)
Medical Conditions - People with thyroid problem (%)
Medical Conditions - People with chronic bronchitis (%)
Medical Conditions - People with any liver condition (%)
Medical Conditions - People who ever had cancer or malignancy (%)
Mental Health - People who have little interest in doing things (%)
Mental Health - People feeling down, depressed, or hopeless (%)
Mental Health - People who have trouble sleeping or sleeping too much (%)
Mental Health - People feeling tired or having little energy (%)
Mental Health - People with poor appetite or overeating (%)
Mental Health - People feeling bad about themself (%)
Mental Health - People who have trouble concentrating on things (%)
Mental Health - People moving or speaking slowly or too fast (%)
Mental Health - People having thoughts they would be better off dead (%)
Oral Health - Average years since last visit a dentist
Oral Health - People embarrassed because of mouth (%)
Oral Health - People with gum disease (%)
Oral Health - General health of teeth and gums (%)
Oral Health - Average days a week using dental floss/device
Oral Health - Average days a week using mouthwash for dental problem
Oral Health - Average number of teeth
Pesticide Use - Households using pesticides to control insects (%)
Pesticide Use - Households using pesticides to kill weeds (%)
Physical Activity - People doing vigorous-intensity work activities (%)
Physical Activity - People doing moderate-intensity work activities (%)
Physical Activity - People walking or bicycling (%)
Physical Activity - People doing vigorous-intensity recreational activities (%)
Physical Activity - People doing moderate-intensity recreational activities (%)
Physical Activity - Average hours a day doing sedentary activities
Physical Activity - Average hours a day watching TV or videos
Physical Activity - Average hours a day using computer
Physical Functioning - People having limitations keeping them from working (%)
Physical Functioning - People limited in amount of work they can do (%)
Physical Functioning - People that need special equipment to walk (%)
Physical Functioning - People experiencing confusion/memory problems (%)
Physical Functioning - People requiring special healthcare equipment (%)
Prescription Medications - Average number of prescription medicines taking
Preventive Aspirin Use - Adults 40+ taking low-dose aspirin (%)
Reproductive Health - Vaginal deliveries (%)
Reproductive Health - Cesarean deliveries (%)
Reproductive Health - Deliveries resulted in a live birth (%)
Reproductive Health - Pregnancies resulted in a delivery (%)
Reproductive Health - Women breastfeeding newborns (%)
Reproductive Health - Women that had a hysterectomy (%)
Reproductive Health - Women that had both ovaries removed (%)
Reproductive Health - Women that have ever taken birth control pills (%)
Reproductive Health - Women taking birth control pills (%)
Reproductive Health - Women that have ever used Depo-Provera or injectables (%)
Reproductive Health - Women that have ever used female hormones (%)
Sexual Behavior - People 18+ that ever had sex (vaginal, anal, or oral) (%)
Sexual Behavior - Males 18+ that ever had vaginal sex with a woman (%)
Sexual Behavior - Males 18+ that ever performed oral sex on a woman (%)
Sexual Behavior - Males 18+ that ever had anal sex with a woman (%)
Sexual Behavior - Males 18+ that ever had any sex with a man (%)
Sexual Behavior - Females 18+ that ever had vaginal sex with a man (%)
Sexual Behavior - Females 18+ that ever performed oral sex on a man (%)
Sexual Behavior - Females 18+ that ever had anal sex with a man (%)
Sexual Behavior - Females 18+ that ever had any kind of sex with a woman (%)
Sexual Behavior - Average age people first had sex
Sexual Behavior - Average number of female sex partners in lifetime (males 18+)
Sexual Behavior - Average number of female vaginal sex partners in lifetime (males 18+)
Sexual Behavior - Average age people first performed oral sex on a woman (18+)
Sexual Behavior - Average number of woman performed oral sex on in lifetime (18+)
Sexual Behavior - Average number of male sex partners in lifetime (males 18+)
Sexual Behavior - Average number of male anal sex partners in lifetime (males 18+)
Sexual Behavior - Average age people first performed oral sex on a man (18+)
Sexual Behavior - Average number of male oral sex partners in lifetime (18+)
Sexual Behavior - People using protection when performing oral sex (%)
Sexual Behavior - Average number of times people have vaginal or anal sex a year
Sexual Behavior - People having sex without condom (%)
Sexual Behavior - Average number of male sex partners in lifetime (females 18+)
Sexual Behavior - Average number of male vaginal sex partners in lifetime (females 18+)
Sexual Behavior - Average number of female sex partners in lifetime (females 18+)
Sexual Behavior - Circumcised males 18+ (%)
Sleep Disorders - Average hours sleeping at night
Sleep Disorders - People that has trouble sleeping (%)
Smoking-Cigarette Use - People smoking cigarettes (%)
Taste & Smell - People 40+ having problems with smell (%)
Taste & Smell - People 40+ having problems with taste (%)
Taste & Smell - People 40+ that ever had wisdom teeth removed (%)
Taste & Smell - People 40+ that ever had tonsils teeth removed (%)
Taste & Smell - People 40+ that ever had a loss of consciousness because of a head injury (%)
Taste & Smell - People 40+ that ever had a broken nose or other serious injury to face or skull (%)
Taste & Smell - People 40+ that ever had two or more sinus infections (%)
Weight - Average height (inches)
Weight - Average weight (pounds)
Weight - Average BMI
Weight - People that are obese (%)
Weight - People that ever were obese (%)
Weight - People trying to lose weight (%)
Urban population: 113,767
Rural population: 20,671
Estimated median house/condo value in 2022: $486,116
77494:
$486,116Texas:
$275,400
According to our research of Texas and other state lists, there were 24 registered sex offenders living in 77494 zip code as of April 25, 2024 . The ratio of all residents to sex offenders in zip code 77494 is 4,121 to 1.The ratio of registered sex offenders to all residents in this zip code is much lower than the state average.
Median resident age: This zip code:
38.1 yearsTexas median age:
35.6 years
Average household size: This zip code:
3.1 peopleTexas:
2.6 people
Averages for the 2020 tax year for zip code 77494, filed in 2021:
Average Adjusted Gross Income (AGI) in 2020: $129,940 (Individual Income Tax Returns) Here:
$129,940State:
$77,054
Salary/wage: $120,542 (reported on 85.6% of returns )Here:
$120,542State:
$62,766
(% of AGI for various income ranges: 1108.5% for AGIs below $25k , 3507.0% for AGIs $25k-50k , 6594.2% for AGIs $50k-75k , 9837.5% for AGIs $75k-100k , 19085.3% for AGIs $100k-200k , 72699.9% for AGIs over 200k ) Taxable interest for individuals: $1,878 (reported on 37.2% of returns )This zip code:
$1,878Texas:
$2,665
(% of AGI for various income ranges: 14.8% for AGIs below $25k , 30.6% for AGIs $25k-50k , 50.0% for AGIs $50k-75k , 72.1% for AGIs $75k-100k , 106.4% for AGIs $100k-200k , 504.3% for AGIs over 200k ) Ordinary dividends: $6,212 (reported on 32.2% of returns )(% of AGI for various income ranges: 24.2% for AGIs below $25k , 63.0% for AGIs $25k-50k , 110.6% for AGIs $50k-75k , 160.3% for AGIs $75k-100k , 242.2% for AGIs $100k-200k , 1717.3% for AGIs over 200k ) Net capital gain/loss in AGI: +$20,296 (reported on 31.2% of returns )Here:
+$20,296State:
+$39,590
(% of AGI for various income ranges: 20.1% for AGIs below $25k , 53.4% for AGIs $25k-50k , 103.1% for AGIs $50k-75k , 192.2% for AGIs $75k-100k , 395.3% for AGIs $100k-200k , 7011.5% for AGIs over 200k ) Profit/loss from business: +$14,264 (reported on 24.6% of returns )Here:
+$14,264State:
+$10,888
(% of AGI for various income ranges: 176.5% for AGIs below $25k , 281.4% for AGIs $25k-50k , 322.8% for AGIs $50k-75k , 394.8% for AGIs $75k-100k , 475.7% for AGIs $100k-200k , 2155.6% for AGIs over 200k ) Taxable individual retirement arrangement distribution: $36,687 (reported on 7.1% of returns )77494:
$36,687Texas:
$24,740
(% of AGI for various income ranges: 35.0% for AGIs below $25k , 97.5% for AGIs $25k-50k , 229.7% for AGIs $50k-75k , 375.6% for AGIs $75k-100k , 567.6% for AGIs $100k-200k , 1479.9% for AGIs over 200k ) Self-employed (Keogh) retirement plans: $24,349 (reported on 0.8% of returns )77494:
$24,349Texas:
$29,298
(% of AGI for various income ranges: 12.5% for AGIs $50k-75k , 22.4% for AGIs $100k-200k , 186.1% for AGIs over 200k ) Total itemized deductions: $36,168 (reported on 13.7% of returns )Here:
$36,168State:
$40,428
(% of AGI for various income ranges: 56.7% for AGIs below $25k , 175.9% for AGIs $25k-50k , 380.2% for AGIs $50k-75k , 572.0% for AGIs $75k-100k , 901.5% for AGIs $100k-200k , 3349.9% for AGIs over 200k ) Charity contributions: $13,869 (reported on 11.3% of returns )Here:
$13,869State:
$18,201
(% of AGI for various income ranges: 4.8% for AGIs below $25k , 27.9% for AGIs $25k-50k , 63.6% for AGIs $50k-75k , 114.0% for AGIs $75k-100k , 235.9% for AGIs $100k-200k , 1339.7% for AGIs over 200k ) Taxes paid: $9,053 (reported on 13.4% of returns )(% of AGI for various income ranges: 13.7% for AGIs below $25k , 46.4% for AGIs $25k-50k , 99.7% for AGIs $50k-75k , 159.4% for AGIs $75k-100k , 249.7% for AGIs $100k-200k , 741.2% for AGIs over 200k ) Earned income credit: $2,379 (reported on 10.1% of returns )(% of AGI for various income ranges: 83.8% for AGIs below $25k , 85.6% for AGIs $25k-50k , 1.4% for AGIs $50k-75k ) Percentage of individuals using paid preparers for their 2020 taxes: 92.7%(% for various income ranges: 92.1% for AGIs below $25k , 92.7% for AGIs $25k-50k , 93.4% for AGIs $50k-75k , 92.1% for AGIs $75k-100k , 93.0% for AGIs $100k-200k , 92.8% for AGIs over 200k )
Averages for the 2012 tax year for zip code 77494, filed in 2013:
Average Adjusted Gross Income (AGI) in 2012: $138,322 (Individual Income Tax Returns) Here:
$138,322State:
$65,384
Salary/wage: $127,272 (reported on 90.5% of returns )Here:
$127,272State:
$52,524
(% of AGI for various income ranges: 79.9% for AGIs below $25k , 79.9% for AGIs $25k-50k , 80.9% for AGIs $50k-75k , 86.4% for AGIs $75k-100k , 90.8% for AGIs $100k-200k , 78.8% for AGIs over 200k ) Taxable interest for individuals: $1,253 (reported on 47.3% of returns )This zip code:
$1,253Texas:
$2,372
(% of AGI for various income ranges: 1.4% for AGIs below $25k , 0.8% for AGIs $25k-50k , 0.6% for AGIs $50k-75k , 0.4% for AGIs $75k-100k , 0.3% for AGIs $100k-200k , 0.5% for AGIs over 200k ) Ordinary dividends: $5,209 (reported on 32.6% of returns )(% of AGI for various income ranges: 3.6% for AGIs below $25k , 1.4% for AGIs $25k-50k , 1.4% for AGIs $50k-75k , 0.8% for AGIs $75k-100k , 0.6% for AGIs $100k-200k , 1.6% for AGIs over 200k ) Net capital gain/loss in AGI: +$18,663 (reported on 28.3% of returns )Here:
+$18,663State:
+$35,319
(% of AGI for various income ranges: 0.2% for AGIs below $25k , 0.8% for AGIs $25k-50k , 0.4% for AGIs $50k-75k , 0.4% for AGIs $75k-100k , 0.5% for AGIs $100k-200k , 6.7% for AGIs over 200k ) Profit/loss from business: +$22,785 (reported on 17.8% of returns )Here:
+$22,785State:
+$13,732
(% of AGI for various income ranges: 10.5% for AGIs below $25k , 6.3% for AGIs $25k-50k , 4.3% for AGIs $50k-75k , 3.5% for AGIs $75k-100k , 2.5% for AGIs $100k-200k , 2.7% for AGIs over 200k ) Taxable individual retirement arrangement distribution: $23,896 (reported on 7.8% of returns )77494:
$23,896Texas:
$19,511
(% of AGI for various income ranges: 2.9% for AGIs below $25k , 2.5% for AGIs $25k-50k , 2.8% for AGIs $50k-75k , 2.1% for AGIs $75k-100k , 1.4% for AGIs $100k-200k , 1.0% for AGIs over 200k ) Self-employment retirement plans: $20,688 (reported on 1.0% of returns )77494:
$20,688Texas:
$23,938
(% of AGI for various income ranges: 0.2% for AGIs $50k-75k , 0.1% for AGIs $100k-200k , 0.2% for AGIs over 200k ) Total itemized deductions: $26,255 (13% of AGI, reported on 58.5% of returns )Here:
$26,255State:
$24,724
Here:
13.4% of AGIState:
15.9% of AGI
(% of AGI for various income ranges: 14.9% for AGIs below $25k , 15.3% for AGIs $25k-50k , 16.8% for AGIs $50k-75k , 15.7% for AGIs $75k-100k , 13.5% for AGIs $100k-200k , 8.4% for AGIs over 200k ) Charity contributions: $5,116 (reported on 46.9% of returns )(% of AGI for various income ranges: 0.9% for AGIs below $25k , 1.3% for AGIs $25k-50k , 1.8% for AGIs $50k-75k , 1.8% for AGIs $75k-100k , 1.8% for AGIs $100k-200k , 1.7% for AGIs over 200k ) Taxes paid: $10,307 (reported on 58.1% of returns )77494:
$10,307State:
$6,921
(% of AGI for various income ranges: 3.5% for AGIs below $25k , 4.7% for AGIs $25k-50k , 5.6% for AGIs $50k-75k , 5.8% for AGIs $75k-100k , 5.5% for AGIs $100k-200k , 3.4% for AGIs over 200k ) Earned income credit: $2,156 (reported on 6.3% of returns )(% of AGI for various income ranges: 4.8% for AGIs below $25k , 0.9% for AGIs $25k-50k ) Percentage of individuals using paid preparers for their 2012 taxes: 43.4%(% for various income ranges: 38.0% for AGIs below $25k , 42.1% for AGIs $25k-50k , 44.5% for AGIs $50k-75k , 42.3% for AGIs $75k-100k , 40.8% for AGIs $100k-200k , 54.1% for AGIs over 200k )
Averages for the 2004 tax year for zip code 77494, filed in 2005:
Average Adjusted Gross Income (AGI) in 2004: $89,149 (Individual Income Tax Returns) Here:
$89,149State:
$47,881
Salary/wage: $83,885 (reported on 89.2% of returns )Here:
$83,885State:
$41,947
(% of AGI for various income ranges: 168.6% for AGIs below $10k , 78.3% for AGIs $10k-25k , 79.1% for AGIs $25k-50k , 83.8% for AGIs $50k-75k , 89.5% for AGIs $75k-100k , 82.8% for AGIs over 100k ) Taxable interest for individuals: $1,289 (reported on 58.9% of returns )This zip code:
$1,289Texas:
$2,255
(% of AGI for various income ranges: 9.0% for AGIs below $10k , 2.4% for AGIs $10k-25k , 2.0% for AGIs $25k-50k , 1.3% for AGIs $50k-75k , 0.6% for AGIs $75k-100k , 0.7% for AGIs over 100k ) Taxable dividends: $2,283 (reported on 37.1% of returns )(% of AGI for various income ranges: 6.8% for AGIs below $10k , 1.5% for AGIs $10k-25k , 1.4% for AGIs $25k-50k , 0.9% for AGIs $50k-75k , 0.5% for AGIs $75k-100k , 1.0% for AGIs over 100k ) Net capital gain/loss: +$9,562 (reported on 32.9% of returns )Here:
+$9,562State:
+$16,110
(% of AGI for various income ranges: -4.6% for AGIs below $10k , 0.9% for AGIs $10k-25k , 0.5% for AGIs $25k-50k , 0.8% for AGIs $50k-75k , 0.6% for AGIs $75k-100k , 4.7% for AGIs over 100k ) Profit/loss from business: +$17,494 (reported on 19.5% of returns )Here:
+$17,494State:
+$11,013
(% of AGI for various income ranges: 14.2% for AGIs below $10k , 9.2% for AGIs $10k-25k , 6.7% for AGIs $25k-50k , 4.3% for AGIs $50k-75k , 3.6% for AGIs $75k-100k , 3.4% for AGIs over 100k ) IRA payment deduction: $3,261 (reported on 3.7% of returns )(% of AGI for various income ranges: 0.6% for AGIs below $10k , 0.2% for AGIs $10k-25k , 0.4% for AGIs $25k-50k , 0.2% for AGIs $50k-75k , 0.2% for AGIs $75k-100k , 0.1% for AGIs over 100k ) Self-employed pension: $14,896 (reported on 1.5% of returns )Here:
$14,896Texas:
$16,401
(% of AGI for various income ranges: 1.2% for AGIs below $10k , 0.1% for AGIs $50k-75k , 0.2% for AGIs $75k-100k , 0.3% for AGIs over 100k ) Total itemized deductions: $22,112 (18% of AGI, reported on 60.0% of returns )Here:
$22,112State:
$19,631
Here:
17.8% of AGIState:
18.9% of AGI
(% of AGI for various income ranges: 25.9% for AGIs below $10k , 17.4% for AGIs $10k-25k , 19.6% for AGIs $25k-50k , 20.7% for AGIs $50k-75k , 19.6% for AGIs $75k-100k , 12.8% for AGIs over 100k ) Charity contributions deductions: $3,880 (3% of AGI, reported on 52.4% of returns )Here:
3.0% of AGIState:
4.2% of AGI
(% of AGI for various income ranges: 1.1% for AGIs below $10k , 1.4% for AGIs $10k-25k , 2.3% for AGIs $25k-50k , 2.2% for AGIs $50k-75k , 2.3% for AGIs $75k-100k , 2.3% for AGIs over 100k ) Total tax: $16,039 (reported on 82.7% of returns )77494:
$16,039State:
$9,058
(% of AGI for various income ranges: 6.5% for AGIs below $10k , 4.8% for AGIs $10k-25k , 6.9% for AGIs $25k-50k , 7.9% for AGIs $50k-75k , 9.5% for AGIs $75k-100k , 17.6% for AGIs over 100k ) Earned income credit: $1,738 (reported on 6.2% of returns )Percentage of individuals using paid preparers for their 2004 taxes: 43.3%(% for various income ranges: 36.4% for AGIs below $10k , 48.5% for AGIs $10k-25k , 47.9% for AGIs $25k-50k , 46.7% for AGIs $50k-75k , 38.2% for AGIs $75k-100k , 44.4% for AGIs over 100k )
Estimated median household income in 2022: This zip code:
$142,959Texas:
$72,284
Nearest zip codes: 77450 ,
77406 ,
77493 ,
77441 ,
77476 ,
77449 .
Katy Zip Code Map
Percentage of family households: This zip code:
69.5%Texas:
50.5%
Percentage of households with unmarried partners: This zip code:
1.6%Texas:
48.7%
Likely homosexual households (counted as self-reported same-sex unmarried-partner households)
Lesbian couples: 0.0% of all households Gay men: 0.1% of all households
Household received Food Stamps/SNAP in the past 12 months: 1,435Household did not receive Food Stamps/SNAP in the past 12 months: 41,528
Women who had a birth in the past 12 months: 1,256 (1,010 now married , 254 unmarried) Women who did not have a birth in the past 12 months: 32,649 (20,767 now married , 11,679 unmarried)
Housing units in zip code 77494 with a mortgage: 22,079 (916
second mortgage , 698
both second mortgage and home equity loan )
Houses without a mortgage: 135
Median monthly owner costs for units with a mortgage: $2,973
Median monthly owner costs for units without a mortgage: $1,303
Residents with income below the poverty level in 2022:
This zip code:
5.5%Whole state:
14.0%
Residents with income below 50% of the poverty level in 2022:
This zip code:
1.4%Whole state:
7.4%
Median number of rooms in houses and condos: Median number of rooms in apartments: Notable locations in this zip code not listed on our city pages
Click to draw/clear zip code borders Notable locations in zip code 77494: (A) , Phoenix Emergency Medical Service West (B) . Display/hide their locations on the map
Shopping Centers: (1) , Katy Mills Mall Shopping Center (2) . Display/hide their locations on the map
Churches in zip code 77494 include: (A) , New Vision Baptist Church (B) , First Baptist Church of Katy (C) , The Church Fellowship - Cinco Ranch (D) , Christian Center Assembly of God Church (E) . Display/hide their locations on the map
Reservoirs: (A) , West Cinco Ranch Lake (B) . Display/hide their locations on the map
Streams, rivers, and creeks: (A) , Snake Creek (B) , Cane Island Branch (C) . Display/hide their locations on the map
Parks in zip code 77494 include: (1) , Katy High School Baseball Field (2) . Display/hide their locations on the map
Year house built (houses)
1,299 2020 or later26,282 2010 to 201915,314 2000 to 20093,198 1990 to 1999834 1980 to 1989285 1970 to 1979185 1960 to 1969217 1950 to 195929 1940 to 19490 1939 or earlier
Zip code 77494 household income distribution in 2022 1,319 Less than $10,000501 $10,000 to $14,999454 $15,000 to $19,999479 $20,000 to $24,999708 $25,000 to $29,999387 $30,000 to $34,999812 $35,000 to $39,999993 $40,000 to $44,999723 $45,000 to $49,9991,817 $50,000 to $59,9992,167 $60,000 to $74,9993,347 $75,000 to $99,9993,832 $100,000 to $124,9994,633 $125,000 to $149,9998,050 $150,000 to $199,99912,725 $200,000 or moreEstimate of home value of owner-occupied houses/condos in 2022 in zip code 77494 52 Less than $10,00053 $35,000 to $39,99921 $40,000 to $49,99933 $50,000 to $59,99962 $60,000 to $69,99947 $90,000 to $99,999203 $100,000 to $124,99928 $150,000 to $174,999117 $175,000 to $199,9991,366 $200,000 to $249,9993,228 $250,000 to $299,9999,767 $300,000 to $399,9999,403 $400,000 to $499,9998,875 $500,000 to $749,9991,963 $750,000 to $999,9991,110 $1,000,000 to $1,499,99913 $1,500,000 to $1,999,99960 $2,000,000 or moreRent paid by renters in 2022 in zip code 77494 118 Less than $100153 $400 to $44910 $650 to $69947 $750 to $79921 $800 to $899274 $900 to $9991,247 $1,000 to $1,2491,555 $1,250 to $1,4994,282 $1,500 to $1,9993,408 $2,000 to $2,4991,264 $2,500 to $2,999360 $3,000 to $3,499391 $3,500 or more348 No cash rent
Median gross rent in 2022: $2,039.
Median price asked for vacant for-sale houses and condos in 2022: $584,916.
Estimated median house (or condo) value in 2022 for: White Non-Hispanic householders: $486,696Black or African American householders: $407,663American Indian or Alaska Native householders: $544,809Asian householders: $523,017Some other race householders: $454,153Two or more races householders: $490,474Hispanic or Latino householders: $481,176Estimated median house or condo value in 2022: $486,116
77494:
$486,116Texas:
$275,400
Lower value quartile - upper value quartile: $383,864 - $616,251
Mean price in 2022: Detached houses: $332,965Here:
$332,965State:
$369,058
Townhouses or other attached units: $227,532Here:
$227,532State:
$327,631
Mobile homes: $59,898Here:
$59,898State:
$124,413
Housing units in structures:
One, detached: 35,326One, attached: 922Two: 4293 or 4: 3075 to 9: 1,24010 to 19: 1,27620 to 49: 1,94050 or more: 2,898Mobile homes: 53Unemployment : 3.9%
Means of transportation to work in zip code 77494 60.0% 35,421 Drove a car alone11.0% 6,521 Carpooled2.5% 1,504 Bus or trolley bus0.4% 243 Taxi0.2% 96 Motorcycle0.1% 75 Bicycle0.7% 438 Walked1.2% 713 Other means27.3% 16,108 Worked at homeTravel time to work (commute) in zip code 77494 476 Less than 5 minutes2,574 5 to 9 minutes3,905 10 to 14 minutes4,282 15 to 19 minutes3,330 20 to 24 minutes2,350 25 to 29 minutes6,566 30 to 34 minutes1,232 35 to 39 minutes3,846 40 to 44 minutes9,074 45 to 59 minutes5,853 60 to 89 minutes1,534 90 or more minutes
Percentage of zip code residents living and working in this county: 48.4%
Household type by relationship:
Households: 134,439
Male householders: 27,235 (1,929 living alone ), Female householders: 15,824 (2,960 living alone )33,189 spouses (32,965 opposite-sex spouses ), 1,249 unmarried partners , (1,208 opposite-sex unmarried partners ), 49,387 children (47,857 natural , 518 adopted , 995 stepchildren ), 1,704 grandchildren , 914 brothers or sisters , 2,660 parents , 21 foster children , 1,150 other relatives , 632 non-relatives In group quarters: 312 (-1 institutionalized population )
Size of family households: 9,626 2-persons , 9,002 3-persons , 12,223 4-persons , 4,284 5-persons , 1,337 6-persons , 273 7-or-more-persons
Size of nonfamily households: 4,887 1-person , 856 2-persons , 39 3-persons , 18 4-persons
35,713 married couples with children. single-parent households (912 men , 3,710 women ).
54.7% of residents of 77494 zip code speak English at home. of residents speak Spanish at home (63% very well, 22% well, 10% not well, 5% not at all ).of residents speak other Indo-European language at home (83% very well, 12% well, 3% not well, 2% not at all ).of residents speak Asian or Pacific Island language at home (66% very well, 18% well, 15% not well, 2% not at all ).of residents speak other language at home (79% very well, 20% well, 1% not well ).
Foreign born population: 50,904 (37.9%)
(48.0%
of them are naturalized citizens )
This zip code:
37.9%Whole state:
17.2%
21% Uruguay 17% Bhutan 6% Honduras 5% Chile 5% Thailand 4% Sweden 3% Nepal 6% English 3% German 3% American 2% European 2% Irish 2% Arab 1% Italian
Year of entry for the foreign-born population
31,197 2010 or later 13,952 2000 to 2009 7,510 1990 to 1999 4,724 Before 1990
There are
227 Medical Specialists in Zip Code 77494 .
Facilities with environmental interests located in this zip code:
AQUASOURCE DEVELOPMENT CO. (21802 WILDCROFT DR in KATY, TX)
National Pollutant Discharge Elimination System NON-MAJOR (Tracking pollutant discharge elimination systems) - permit Business SIC classification: SEWERAGE SYSTEMSOrganizations: AQUASOURCE DEVELOPMENT COMPANY (CONTACT/OWNER)
AQUASOURCE DEVELOPMENT COMPANY (10200FT SE HWY 10/FM 1463 in KATY, TX)
National Pollutant Discharge Elimination System NON-MAJOR (Tracking pollutant discharge elimination systems) - permit Business SIC classification: SEWERAGE SYSTEMSOrganizations: FORT BEND COUNTY MUD 130 (CONTACT/OWNER)
Alternative names: FORT BEND COUNTY MUD NO. 130
Housing units lacking complete plumbing facilities: 0.3%
Housing units lacking complete kitchen facilities: 1.0%
64.2% Utility gas 33.5% Electricity 1.2% Bottled, tank, or LP gas
Population in 1990: 2,684. Population change in the 1990s: +8,821 (+328.7%).
Place of birth for U.S.-born residents:
This state: 46,066Northeast: 4,688Midwest: 8,330South: 12,348West: 9,475
36% of the 77494 zip code residents lived in the same house 5 years ago.
Out of people who lived in different houses, 25% lived in this county.
Out of people who lived in different counties, 50% lived in Texas.
84% of the 77494 zip code residents lived in the same house 1 year ago.
Out of people who lived in different houses, 29% moved from this county.
Out of people who lived in different houses, 39% moved from different county within same state.
Out of people who lived in different houses, 16% moved from different state.
Out of people who lived in different houses, 20% moved from abroad.
Private vs. public school enrollment:
Students in private schools in grades 1 to 8 (elementary and middle school): 1,006
Students in private schools in grades 9 to 12 (high school): 1,050
Students in private undergraduate colleges: 964
Occupation by median earnings in the past 12 months ($)
159,831 Architecture and engineering occupations 143,670 Legal occupations 141,277 Life, physical, and social science occupations 135,018 Management occupations 120,252 Computer and mathematical occupations 96,759 Business and financial operations occupations
Companies with federal contracts located in this zip code (KATY, TX):
EVANGELINE INC (23303 TINTON CT; small business) in 45 contracts from 2005 to 2006
Contracts for Hardware, Commercial, Miscellaneous Vehicular Components, Fans, Air Circulators, and Blower Equipment, Engine Fuel System Components, Nonaircraft, and more by Defense Logistics AgencySigned by year: 2000: $0; 2001: $0; 2002: $0; 2003: $0; 2004: $0; 2005: $196,177; 2006: $170,807.
Biggest contracts: with Defense Logistics Agency for Hardware, Commercial. Signed on 2006-01-31. Completion date: 2006-04-27.
with Defense Logistics Agency for Miscellaneous Vehicular Components. Signed on 2006-03-17. Completion date: 2006-05-14.
with Defense Logistics Agency for Hardware, Commercial. Signed on 2005-08-30. Completion date: 2005-11-29.
, same as above. Signed on 2005-05-04. Completion date: 2005-10-27.
INNOVATIVE GLOBAL SOLUTIONS, L (2519 BRAER RIDGE DR; small business) in 2 contracts from 2005 to 2006
$112,500 with ENERGY, Department of for Telephone and Telegraph Equipment. Signed on 2005-09-23. Effective on 2005-09-26. Completion date: 2006-01-05.
with Navy for Facilities Operations Support Services. Signed on 2006-03-24. Completion date: 2007-03-23.
GULLIVER INSTRUMENT SERVICES (25538 SADDLEBROOK WAY; small business)
$18,900 with U.S. Army Corps of Engineers - civil program financing only for Maintenance, Repair and Rebuilding of Equipment -- Instruments and Laboratory Equipment. Signed on 2002-10-24. Completion date: 2003-08-31.
E I S INC (1114 MAHOGANY RUN DR; small business)
$11,135 with Army for Liquid and Gas Flow, Liquid Level, and Mechanical Motion Measuring Instruments. Signed on 2004-12-02. Completion date: 2005-02-24.
Top industries in this zip code by the number of employees in 2005:
Accommodation and Food Services: Full-Service Restaurants (100-249 employees: 2 establishments, 50-99 employees: 3 establishments, 20-49 employees: 2 establishments, 10-19 employees: 2 establishments, 5-9 employees: 4 establishments, 1-4 employees: 5 establishments)Health Care and Social Assistance: General Medical and Surgical Hospitals (250-499: 1)Accommodation and Food Services: Limited-Service Restaurants (50-99: 2, 20-49: 4, 5-9: 1, 1-4: 2)Arts, Entertainment, and Recreation: Fitness and Recreational Sports Centers (100-249: 1, 20-49: 2, 1-4: 2)
People in group quarters in 2010:
226 people in nursing facilities/skilled-nursing facilities
59 people in residential treatment centers for juveniles (non-correctional)
6 people in group homes intended for adults
People in group quarters in 2000:
59 people in other noninstitutional group quarters
Fatal accident statistics in 2014:
Fatal accident count: 4Vehicles involved in fatal accidents: 6Fatal accidents caused by drunken drivers: 2Fatalities: 4Persons involved in fatal accidents: 7Pedestrians involved in fatal accidents: 1
Fatal accident statistics in 2013:
Fatal accident count: 6Vehicles involved in fatal accidents: 10Fatal accidents caused by drunken drivers: 4Fatalities: 6Persons involved in fatal accidents: 16Pedestrians involved in fatal accidents: 0
Home Mortgage Disclosure Act Aggregated Statistics For Year 2009(Based on 3 full and 8 partial tracts) A) FHA, FSA/RHS & VA B) Conventional C) Refinancings D) Home Improvement Loans E) Loans on Dwellings For 5+ Families F) Non-occupant Loans on G) Loans On Manufactured Number Average Value Number Average Value Number Average Value Number Average Value Number Average Value Number Average Value Number Average Value
LOANS ORIGINATED 1,271 $199,324 3,097 $219,439 3,385 $212,547 154 $73,583 2 $14,058,240 140 $172,340 4 $190,655 APPLICATIONS APPROVED, NOT ACCEPTED 63 $198,134 309 $206,377 350 $204,240 31 $81,822 0 $0 18 $208,704 1 $64,100 APPLICATIONS DENIED 135 $197,898 331 $198,347 882 $213,848 160 $49,298 0 $0 56 $153,922 2 $74,860 APPLICATIONS WITHDRAWN 175 $204,803 338 $229,882 770 $210,032 36 $96,391 0 $0 27 $137,548 2 $79,850 FILES CLOSED FOR INCOMPLETENESS 25 $195,266 58 $277,540 173 $216,625 8 $54,446 0 $0 11 $121,704 2 $274,480
Aggregated Statistics For Year 2008(Based on 3 full and 8 partial tracts) A) FHA, FSA/RHS & VA B) Conventional C) Refinancings D) Home Improvement Loans E) Loans on Dwellings For 5+ Families F) Non-occupant Loans on G) Loans On Manufactured Number Average Value Number Average Value Number Average Value Number Average Value Number Average Value Number Average Value Number Average Value
LOANS ORIGINATED 871 $189,961 3,730 $211,590 965 $199,854 251 $61,017 1 $7,643,660 252 $184,554 5 $60,810 APPLICATIONS APPROVED, NOT ACCEPTED 28 $177,530 377 $204,701 144 $190,507 67 $44,726 0 $0 29 $136,022 6 $35,763 APPLICATIONS DENIED 134 $174,517 530 $208,932 547 $197,222 303 $43,578 0 $0 83 $161,649 7 $75,349 APPLICATIONS WITHDRAWN 158 $200,028 565 $201,938 347 $196,322 45 $93,966 0 $0 46 $182,007 0 $0 FILES CLOSED FOR INCOMPLETENESS 12 $202,873 122 $207,823 46 $262,312 18 $51,347 0 $0 14 $168,801 0 $0
Aggregated Statistics For Year 2007(Based on 3 full and 8 partial tracts) A) FHA, FSA/RHS & VA B) Conventional C) Refinancings D) Home Improvement Loans E) Loans on Dwellings For 5+ Families F) Non-occupant Loans on G) Loans On Manufactured Number Average Value Number Average Value Number Average Value Number Average Value Number Average Value Number Average Value Number Average Value
LOANS ORIGINATED 291 $174,585 6,371 $179,303 683 $192,495 397 $54,826 2 $4,362,975 437 $141,258 10 $29,743 APPLICATIONS APPROVED, NOT ACCEPTED 11 $180,642 934 $158,160 156 $197,808 122 $53,703 0 $0 92 $133,066 3 $81,007 APPLICATIONS DENIED 48 $155,101 920 $153,545 624 $223,819 295 $52,914 0 $0 95 $150,546 3 $15,383 APPLICATIONS WITHDRAWN 49 $175,520 846 $179,343 300 $204,515 43 $66,808 0 $0 65 $133,457 0 $0 FILES CLOSED FOR INCOMPLETENESS 2 $173,670 184 $194,787 165 $225,419 18 $41,971 0 $0 16 $130,784 0 $0
Aggregated Statistics For Year 2006(Based on 3 full and 8 partial tracts) A) FHA, FSA/RHS & VA B) Conventional C) Refinancings D) Home Improvement Loans E) Loans on Dwellings For 5+ Families F) Non-occupant Loans on G) Loans On Manufactured Number Average Value Number Average Value Number Average Value Number Average Value Number Average Value Number Average Value Number Average Value
LOANS ORIGINATED 286 $157,996 6,508 $149,358 530 $179,683 320 $46,095 2 $18,403,920 521 $121,838 9 $38,671 APPLICATIONS APPROVED, NOT ACCEPTED 19 $146,300 959 $135,642 102 $211,899 125 $50,030 0 $0 78 $154,701 4 $26,390 APPLICATIONS DENIED 20 $166,124 775 $135,628 482 $163,168 294 $44,737 0 $0 83 $156,508 12 $42,642 APPLICATIONS WITHDRAWN 74 $163,701 1,031 $145,319 345 $167,281 40 $83,137 0 $0 121 $111,977 0 $0 FILES CLOSED FOR INCOMPLETENESS 0 $0 168 $161,630 109 $198,610 15 $34,241 0 $0 12 $113,828 0 $0
Aggregated Statistics For Year 2005(Based on 3 full and 8 partial tracts) A) FHA, FSA/RHS & VA B) Conventional C) Refinancings D) Home Improvement Loans E) Loans on Dwellings For 5+ Families F) Non-occupant Loans on G) Loans On Manufactured Number Average Value Number Average Value Number Average Value Number Average Value Number Average Value Number Average Value Number Average Value
LOANS ORIGINATED 159 $145,852 4,712 $145,999 539 $153,876 233 $53,478 0 $0 328 $111,120 7 $85,977 APPLICATIONS APPROVED, NOT ACCEPTED 15 $144,681 626 $134,732 90 $158,241 54 $48,990 0 $0 36 $139,961 2 $56,105 APPLICATIONS DENIED 16 $192,090 652 $130,023 484 $156,911 184 $47,643 2 $3,149,005 56 $101,727 17 $45,567 APPLICATIONS WITHDRAWN 38 $152,304 669 $135,558 235 $182,737 69 $200,965 2 $123,765 57 $111,737 0 $0 FILES CLOSED FOR INCOMPLETENESS 0 $0 133 $155,365 205 $163,691 5 $57,392 0 $0 11 $168,079 0 $0
Aggregated Statistics For Year 2004(Based on 3 full and 8 partial tracts) A) FHA, FSA/RHS & VA B) Conventional C) Refinancings D) Home Improvement Loans F) Non-occupant Loans on G) Loans On Manufactured Number Average Value Number Average Value Number Average Value Number Average Value Number Average Value Number Average Value
LOANS ORIGINATED 108 $155,690 3,284 $150,896 924 $144,838 154 $41,340 150 $122,427 4 $70,452 APPLICATIONS APPROVED, NOT ACCEPTED 11 $95,166 515 $143,129 174 $138,738 44 $38,487 33 $111,360 3 $33,957 APPLICATIONS DENIED 16 $148,037 503 $136,753 447 $140,724 108 $37,731 37 $121,359 17 $43,718 APPLICATIONS WITHDRAWN 23 $157,284 459 $144,403 293 $137,922 19 $44,327 21 $93,959 0 $0 FILES CLOSED FOR INCOMPLETENESS 1 $84,570 74 $161,067 284 $172,206 3 $42,567 10 $112,587 0 $0
Aggregated Statistics For Year 2003(Based on 3 full and 8 partial tracts) A) FHA, FSA/RHS & VA B) Conventional C) Refinancings D) Home Improvement Loans F) Non-occupant Loans on Number Average Value Number Average Value Number Average Value Number Average Value Number Average Value
LOANS ORIGINATED 96 $154,619 2,444 $147,593 2,269 $140,135 156 $37,938 91 $108,294 APPLICATIONS APPROVED, NOT ACCEPTED 7 $156,786 317 $136,584 296 $156,052 44 $35,161 10 $137,058 APPLICATIONS DENIED 17 $135,745 342 $122,558 725 $129,278 104 $30,310 27 $132,472 APPLICATIONS WITHDRAWN 14 $147,505 254 $157,746 374 $134,930 10 $24,937 10 $79,769 FILES CLOSED FOR INCOMPLETENESS 1 $33,220 66 $139,598 74 $150,871 9 $39,746 6 $154,905
Aggregated Statistics For Year 1999(Based on 2 partial tracts) A) FHA, FSA/RHS & VA B) Conventional C) Refinancings D) Home Improvement Loans F) Non-occupant Loans on Number Average Value Number Average Value Number Average Value Number Average Value Number Average Value
LOANS ORIGINATED 103 $102,943 1,011 $128,795 202 $103,232 101 $24,575 24 $94,510 APPLICATIONS APPROVED, NOT ACCEPTED 4 $129,532 95 $110,449 51 $98,829 21 $19,417 5 $60,030 APPLICATIONS DENIED 6 $120,970 101 $107,180 59 $76,166 49 $22,498 8 $53,091 APPLICATIONS WITHDRAWN 8 $112,059 96 $146,165 52 $90,530 10 $26,397 4 $43,555 FILES CLOSED FOR INCOMPLETENESS 0 $0 18 $123,679 18 $99,008 5 $22,826 2 $124,230
Private Mortgage Insurance Companies Aggregated Statistics For Year 2009(Based on 3 full and 8 partial tracts) A) Conventional B) Refinancings C) Non-occupant Loans on Number Average Value Number Average Value Number Average Value
LOANS ORIGINATED 634 $236,588 161 $235,268 7 $239,724 APPLICATIONS APPROVED, NOT ACCEPTED 121 $243,876 43 $234,533 4 $119,208 APPLICATIONS DENIED 62 $270,812 15 $222,665 4 $188,208 APPLICATIONS WITHDRAWN 37 $212,054 20 $242,698 0 $0 FILES CLOSED FOR INCOMPLETENESS 6 $243,203 0 $0 2 $179,660
Aggregated Statistics For Year 2008(Based on 3 full and 8 partial tracts) A) Conventional B) Refinancings C) Non-occupant Loans on Number Average Value Number Average Value Number Average Value
LOANS ORIGINATED 1,223 $231,085 108 $205,850 57 $177,104 APPLICATIONS APPROVED, NOT ACCEPTED 293 $237,429 48 $204,289 15 $187,438 APPLICATIONS DENIED 51 $226,735 8 $173,184 17 $157,091 APPLICATIONS WITHDRAWN 46 $239,600 5 $274,164 2 $235,005 FILES CLOSED FOR INCOMPLETENESS 30 $215,981 1 $118,860 9 $217,748
Aggregated Statistics For Year 2007(Based on 3 full and 8 partial tracts) A) Conventional B) Refinancings C) Non-occupant Loans on Number Average Value Number Average Value Number Average Value
LOANS ORIGINATED 1,071 $209,827 62 $215,179 68 $153,651 APPLICATIONS APPROVED, NOT ACCEPTED 159 $212,354 24 $272,037 14 $138,820 APPLICATIONS DENIED 14 $226,304 0 $0 0 $0 APPLICATIONS WITHDRAWN 54 $242,256 11 $259,229 4 $179,160 FILES CLOSED FOR INCOMPLETENESS 10 $276,274 0 $0 2 $120,770
Aggregated Statistics For Year 2006(Based on 3 full and 8 partial tracts) A) Conventional B) Refinancings C) Non-occupant Loans on Number Average Value Number Average Value Number Average Value
LOANS ORIGINATED 391 $193,026 29 $169,700 31 $142,350 APPLICATIONS APPROVED, NOT ACCEPTED 95 $185,480 10 $163,969 9 $145,638 APPLICATIONS DENIED 5 $204,172 12 $183,683 12 $183,022 APPLICATIONS WITHDRAWN 15 $178,583 5 $198,008 3 $162,773 FILES CLOSED FOR INCOMPLETENESS 0 $0 0 $0 0 $0
Aggregated Statistics For Year 2005(Based on 3 full and 8 partial tracts) A) Conventional B) Refinancings C) Non-occupant Loans on Number Average Value Number Average Value Number Average Value
LOANS ORIGINATED 377 $185,329 57 $171,711 32 $137,406 APPLICATIONS APPROVED, NOT ACCEPTED 77 $193,185 13 $173,802 6 $140,372 APPLICATIONS DENIED 5 $163,988 2 $205,610 1 $93,630 APPLICATIONS WITHDRAWN 25 $245,918 5 $138,946 2 $132,745 FILES CLOSED FOR INCOMPLETENESS 2 $240,540 0 $0 0 $0
Aggregated Statistics For Year 2004(Based on 3 full and 8 partial tracts) A) Conventional B) Refinancings C) Non-occupant Loans on D) Loans On Manufactured Number Average Value Number Average Value Number Average Value Number Average Value
LOANS ORIGINATED 417 $187,522 88 $161,969 32 $144,583 2 $196,625 APPLICATIONS APPROVED, NOT ACCEPTED 97 $190,165 39 $164,150 10 $156,719 2 $239,545 APPLICATIONS DENIED 1 $120,010 2 $151,710 1 $43,800 0 $0 APPLICATIONS WITHDRAWN 26 $172,507 6 $203,923 5 $223,886 0 $0 FILES CLOSED FOR INCOMPLETENESS 1 $103,450 3 $142,280 2 $152,710 0 $0
Aggregated Statistics For Year 2003(Based on 3 full and 8 partial tracts) A) Conventional B) Refinancings C) Non-occupant Loans on Number Average Value Number Average Value Number Average Value
LOANS ORIGINATED 507 $176,723 243 $162,961 18 $121,427 APPLICATIONS APPROVED, NOT ACCEPTED 107 $179,252 56 $174,419 7 $98,596 APPLICATIONS DENIED 9 $181,653 6 $239,877 0 $0 APPLICATIONS WITHDRAWN 15 $181,406 23 $162,941 1 $133,310 FILES CLOSED FOR INCOMPLETENESS 3 $171,507 0 $0 0 $0
Aggregated Statistics For Year 1999(Based on 2 partial tracts) A) Conventional B) Refinancings C) Non-occupant Loans on Number Average Value Number Average Value Number Average Value
LOANS ORIGINATED 270 $136,385 40 $127,777 4 $132,570 APPLICATIONS APPROVED, NOT ACCEPTED 32 $139,809 7 $147,587 0 $0 APPLICATIONS DENIED 17 $120,221 2 $115,915 1 $90,120 APPLICATIONS WITHDRAWN 8 $128,868 3 $111,130 0 $0 FILES CLOSED FOR INCOMPLETENESS 9 $170,909 1 $143,580 0 $0
2002 - 2018 National Fire Incident Reporting System (NFIRS) incidents See full 2006 National Fire Incident Reporting System statistics for zip code 77494, Texas
Most common first names in zip code 77494 among deceased individuals Name Count Lived (average)
James 18 75.0 years John 18 74.9 years Mary 17 73.5 years William 13 76.8 years Margaret 13 81.4 years Helen 10 79.9 years Robert 10 72.7 years Ruth 9 84.8 years Charles 9 76.4 years Dorothy 9 88.0 years
Most common last names in zip code 77494 among deceased individuals Last name Count Lived (average)
Smith 11 83.2 years Harris 6 61.3 years Robinson 6 67.8 years White 5 81.0 years Williams 5 69.2 years Griffin 4 84.3 years Jones 4 83.7 years Johnson 4 73.0 years Brown 4 61.5 years Foster 4 84.8 years
Businesses in zip code 77494
Name Count Name Count
ALDO 1 Jack In The Box 2 AT&T 1 Jamba Juice 1 Advance Auto Parts 1 JoS. A. Bank 1 Aeropostale 1 Journeys 1 American Eagle Outfitters 1 Justice 2 Ann Taylor 2 KFC 1 Arby's 1 Kroger 1 Banana Republic 1 Lane Bryant 1 Baskin-Robbins 1 Levi Strauss & Co. 1 Bath & Body Works 1 Long John Silver's 1 Bed Bath & Beyond 1 Marriott 1 Best Western 1 Marshalls 1 Burger King 1 McDonald's 4 CVS 2 Motherhood Maternity 1 Charlotte Russe 1 New York & Co 1 Chick-Fil-A 1 Nike 2 Chico's 1 Nissan 1 Chuck E. Cheese's 1 OfficeMax 1 Clarks 1 Old Navy 1 Coldwater Creek 1 Pac Sun 1 Cricket Wireless 3 Panera Bread 1 DHL 2 Papa John's Pizza 2 Dennys 2 Payless 2 Discount Tire 2 Pizza Hut 1 Domino's Pizza 1 Quiznos 1 DressBarn 1 RadioShack 2 Dressbarn 1 Red Lobster 1 Eddie Bauer 1 SONIC Drive-In 1 Express 1 Skechers USA 1 Famous Footwear 1 Spencer Gifts 1 FedEx 7 Sprint Nextel 1 Finish Line 1 Starbucks 3 Firestone Complete Auto Care 1 T-Mobile 4 Foot Locker 1 T.G.I. Driday's 1 Forever 21 1 Taco Bell 2 Fredericks Of Hollywood 1 Talbots 1 GNC 1 Target 1 GameStop 1 Toys"R"Us 2 Gap 1 U-Haul 3 Gymboree 2 UPS 5 H&R Block 1 Vans 4 Hobby Lobby 1 Victoria's Secret 1 Home Depot 1 Walgreens 2 Hot Topic 1 Walmart 1 J. Jill 1 YMCA 1 J.Crew 1

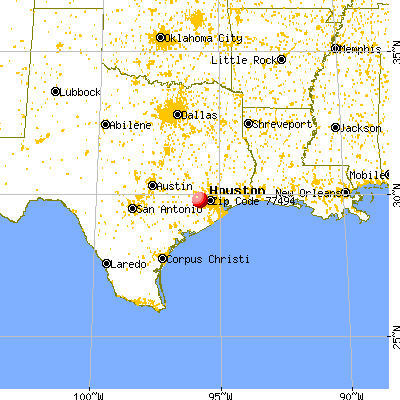


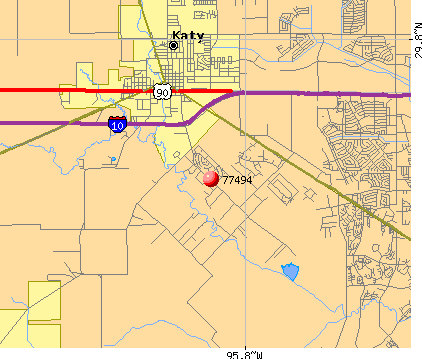 Nearest zip codes: 77450, 77406, 77493, 77441, 77476, 77449.
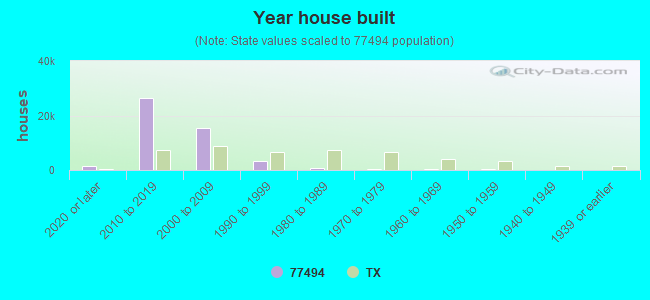
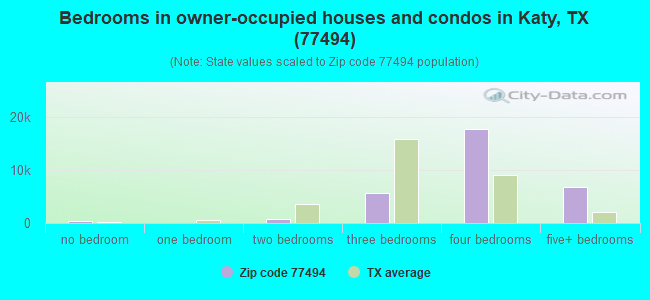
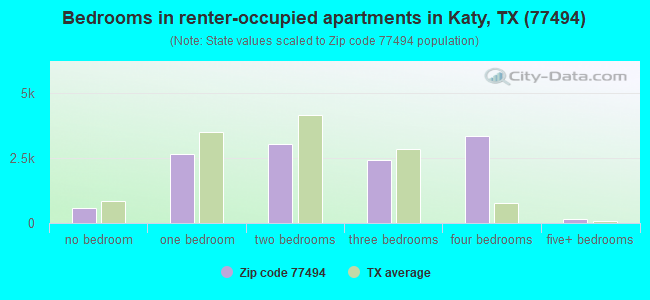
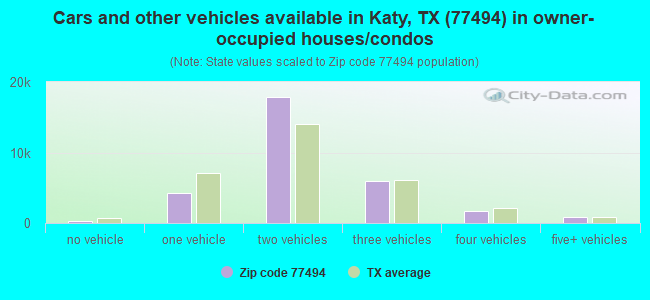
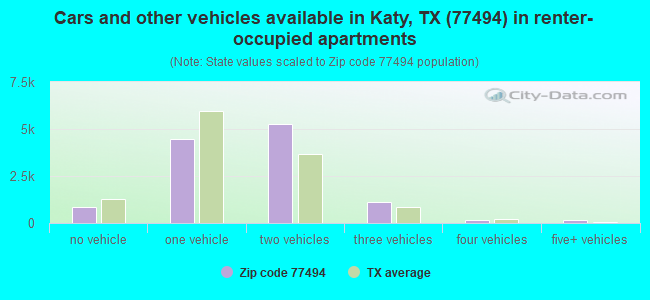


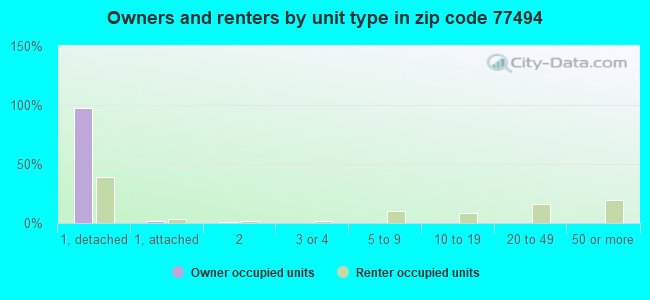
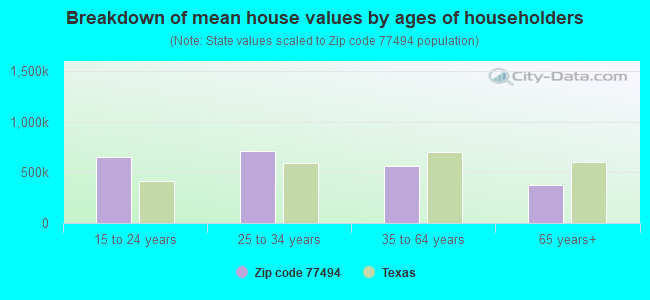


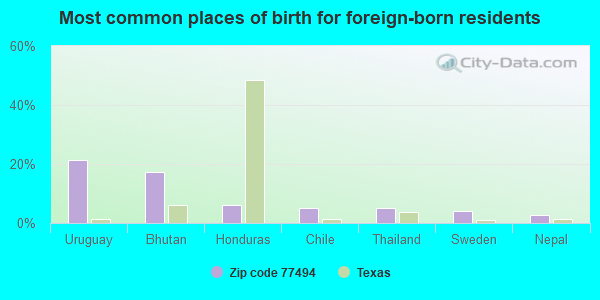
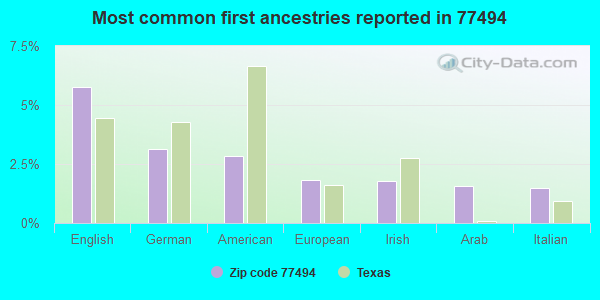
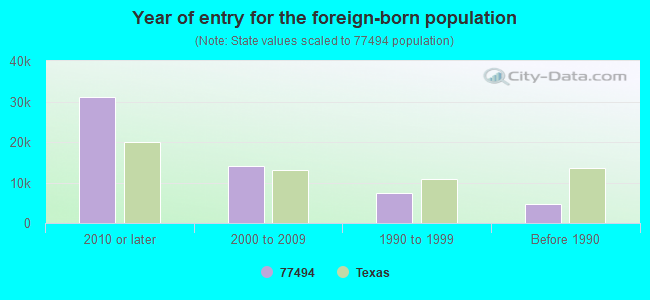
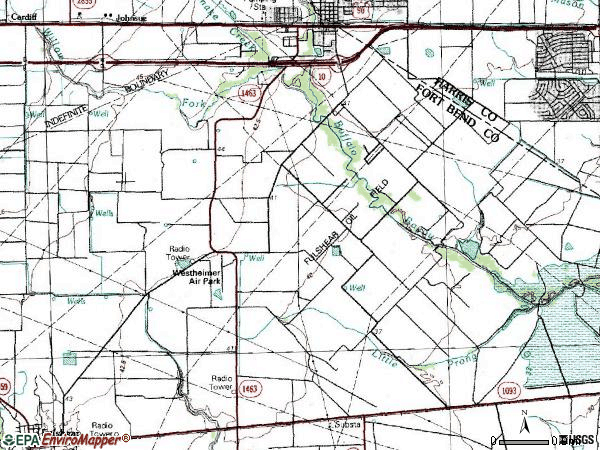

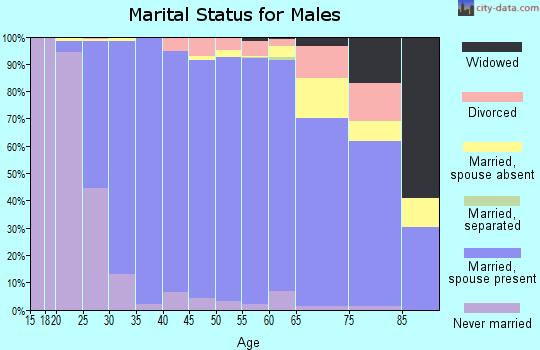
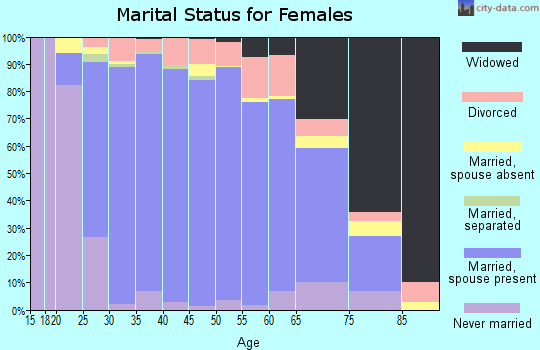
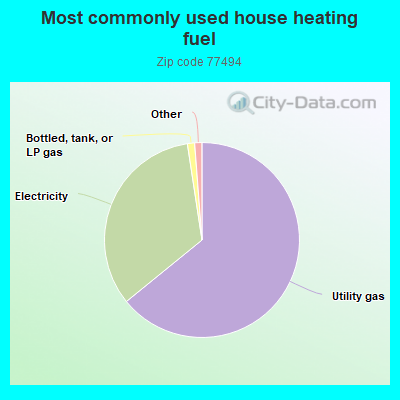
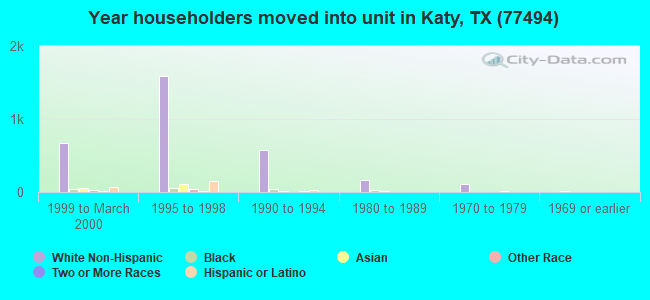
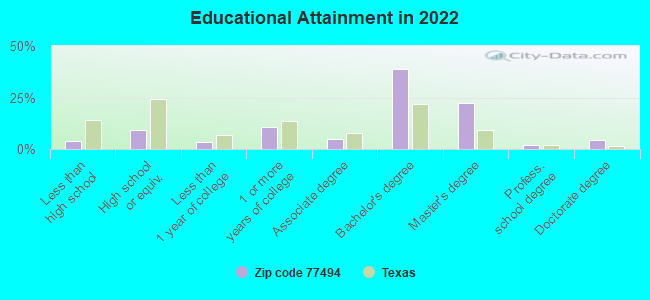
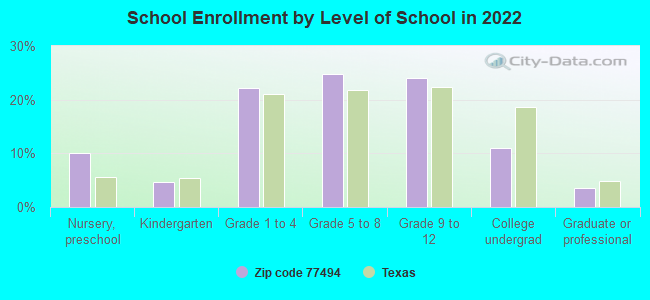
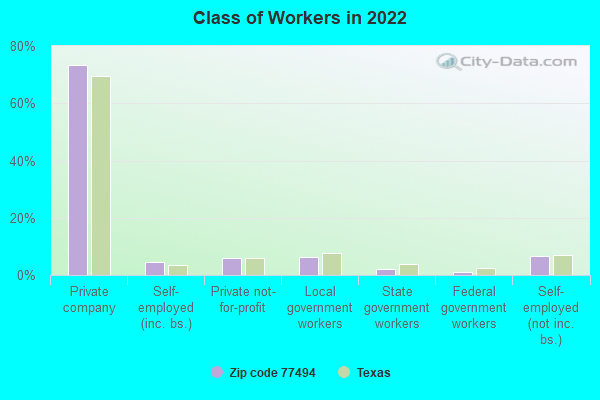
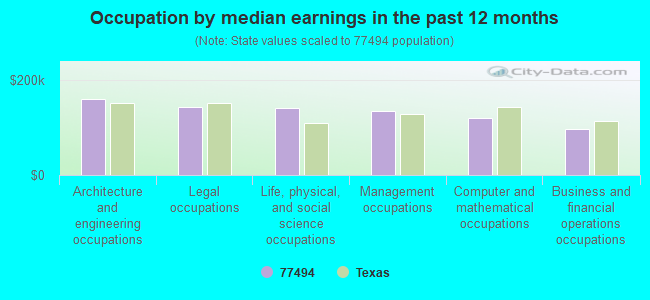
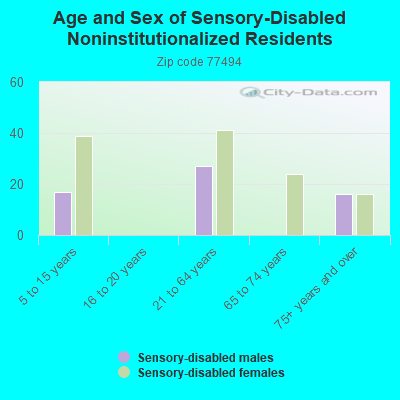
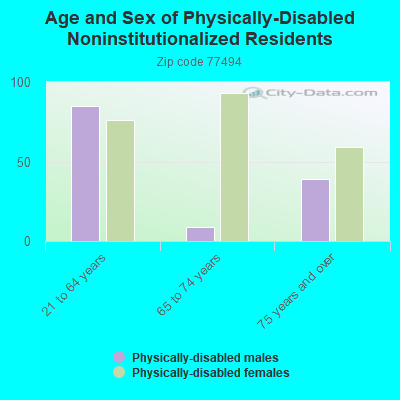
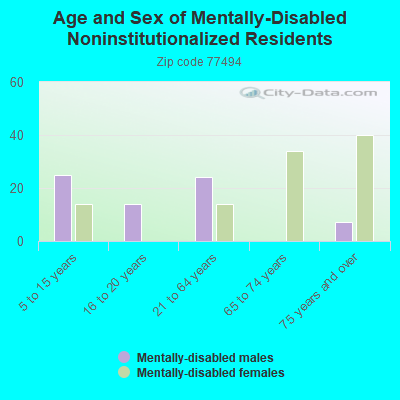
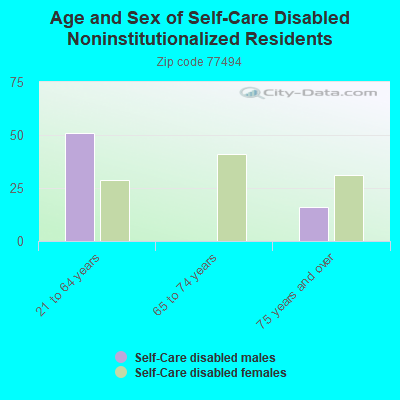
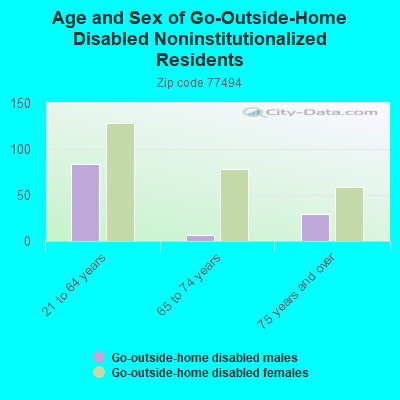
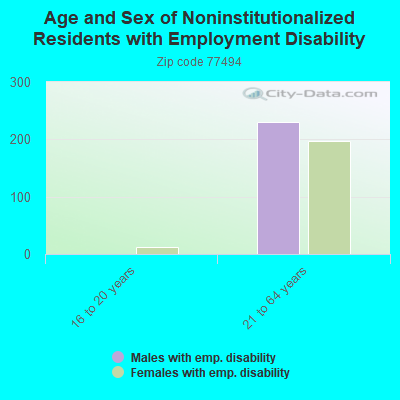
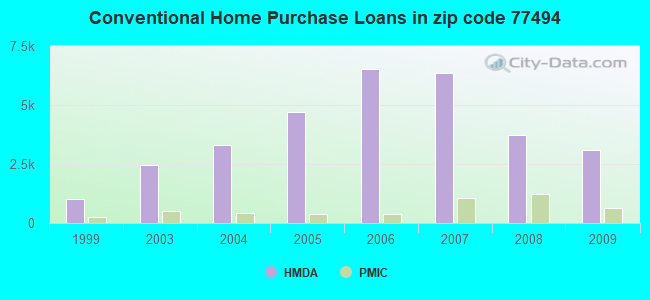
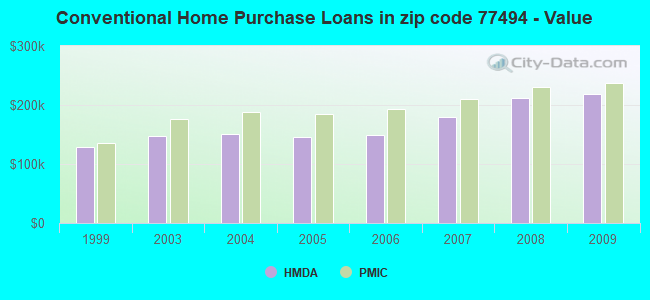
 Based on the data from the years 2002 - 2018 the average number of fire incidents per year is 46. The highest number of fires - 122 took place in 2018, and the least - 15 in 2002. The data has an increasing trend.
 When looking into fire subcategories, the most incidents belonged to: Outside Fires (40.7%), and Structure Fires (40.2%).