Estimated zip code population in 2022: 39,761
Zip code population in 2010: 37,111
Zip code population in 2000: 36,958
Houses and condos: 16,546
Renter-occupied apartments: 6,935
% of renters here:
48%State:
38%
March 2022 cost of living index in zip code 77642: 81.5
(low, U.S. average is 100)
Land area: 19.7
sq. mi.
Water area: 1.8
sq. mi.
Population density: 2,020 people per square mile (low).
OSM Map
General Map
Google Map
MSN Map
OSM Map
General Map
Google Map
MSN Map
OSM Map
General Map
Google Map
MSN Map
OSM Map
General Map
Google Map
MSN Map
Please wait while loading the map...
Real estate property taxes paid for housing units in 2022:
This zip code:
1.4% ($1,500)Texas:
1.5% ($4,050)
Median real estate property taxes paid for housing units with mortgages in 2022: $2,625 (1.8%)
Median real estate property taxes paid for housing units with no mortgage in 2022: $1,125 (1.2%)
Business Search - 14 Million verified businesses
Males: 18,810 Females: 20,950
For population 25 years and over in 77642:
High school or higher: 74.5%Bachelor's degree or higher: 11.4%Graduate or professional degree: 3.4%Unemployed: 5.7%Mean travel time to work (commute): 24.0 minutes
For population 15 years and over in 77642:
Never married: 39.7%Now married: 42.3%Separated: 3.3%Widowed: 5.1%Divorced: 9.6%
Zip code 77642 compared to state average:
Median household income below state average. Median house value significantly below state average. Black race population percentage significantly above state average. Median age below state average. Length of stay since moving in significantly above state average. Number of college students below state average. Percentage of population with a bachelor's degree or higher significantly below state average. 16,025 40.3% Hispanic or Latino 14,696 37.0% Black 5,620 14.1% White 2,925 7.4% Asian 371 0.9% Two or more races 94 0.2% Native Hawaiian and Other 17 0.04% American Indian 9 0.02% Some other race
Data:
Median household income ($)
Median household income (% change since 2000)
Household income diversity
Ratio of average income to average house value (%)
Ratio of average income to average rent
Median household income ($) - White
Median household income ($) - Black or African American
Median household income ($) - Asian
Median household income ($) - Hispanic or Latino
Median household income ($) - American Indian and Alaska Native
Median household income ($) - Multirace
Median household income ($) - Other Race
Median household income for houses/condos with a mortgage ($)
Median household income for apartments without a mortgage ($)
Races - White alone (%)
Races - White alone (% change since 2000)
Races - Black alone (%)
Races - Black alone (% change since 2000)
Races - American Indian alone (%)
Races - American Indian alone (% change since 2000)
Races - Asian alone (%)
Races - Asian alone (% change since 2000)
Races - Hispanic (%)
Races - Hispanic (% change since 2000)
Races - Native Hawaiian and Other Pacific Islander alone (%)
Races - Native Hawaiian and Other Pacific Islander alone (% change since 2000)
Races - Two or more races (%)
Races - Two or more races (% change since 2000)
Races - Other race alone (%)
Races - Other race alone (% change since 2000)
Racial diversity
Unemployment (%)
Unemployment (% change since 2000)
Unemployment (%) - White
Unemployment (%) - Black or African American
Unemployment (%) - Asian
Unemployment (%) - Hispanic or Latino
Unemployment (%) - American Indian and Alaska Native
Unemployment (%) - Multirace
Unemployment (%) - Other Race
Population density (people per square mile)
Population - Males (%)
Population - Females (%)
Population - Males (%) - White
Population - Males (%) - Black or African American
Population - Males (%) - Asian
Population - Males (%) - Hispanic or Latino
Population - Males (%) - American Indian and Alaska Native
Population - Males (%) - Multirace
Population - Males (%) - Other Race
Population - Females (%) - White
Population - Females (%) - Black or African American
Population - Females (%) - Asian
Population - Females (%) - Hispanic or Latino
Population - Females (%) - American Indian and Alaska Native
Population - Females (%) - Multirace
Population - Females (%) - Other Race
Coronavirus confirmed cases (Apr 20, 2024)
Deaths caused by coronavirus (Apr 20, 2024)
Coronavirus confirmed cases (per 100k population) (Apr 20, 2024)
Deaths caused by coronavirus (per 100k population) (Apr 20, 2024)
Daily increase in number of cases (Apr 20, 2024)
Weekly increase in number of cases (Apr 20, 2024)
Cases doubled (in days) (Apr 20, 2024)
Hospitalized patients (Apr 18, 2022)
Negative test results (Apr 18, 2022)
Total test results (Apr 18, 2022)
COVID Vaccine doses distributed (per 100k population) (Sep 19, 2023)
COVID Vaccine doses administered (per 100k population) (Sep 19, 2023)
COVID Vaccine doses distributed (Sep 19, 2023)
COVID Vaccine doses administered (Sep 19, 2023)
Likely homosexual households (%)
Likely homosexual households (% change since 2000)
Likely homosexual households - Lesbian couples (%)
Likely homosexual households - Lesbian couples (% change since 2000)
Likely homosexual households - Gay men (%)
Likely homosexual households - Gay men (% change since 2000)
Cost of living index
Median gross rent ($)
Median contract rent ($)
Median monthly housing costs ($)
Median house or condo value ($)
Median house or condo value ($ change since 2000)
Mean house or condo value by units in structure - 1, detached ($)
Mean house or condo value by units in structure - 1, attached ($)
Mean house or condo value by units in structure - 2 ($)
Mean house or condo value by units in structure by units in structure - 3 or 4 ($)
Mean house or condo value by units in structure - 5 or more ($)
Mean house or condo value by units in structure - Boat, RV, van, etc. ($)
Mean house or condo value by units in structure - Mobile home ($)
Median house or condo value ($) - White
Median house or condo value ($) - Black or African American
Median house or condo value ($) - Asian
Median house or condo value ($) - Hispanic or Latino
Median house or condo value ($) - American Indian and Alaska Native
Median house or condo value ($) - Multirace
Median house or condo value ($) - Other Race
Median resident age
Resident age diversity
Median resident age - Males
Median resident age - Females
Median resident age - White
Median resident age - Black or African American
Median resident age - Asian
Median resident age - Hispanic or Latino
Median resident age - American Indian and Alaska Native
Median resident age - Multirace
Median resident age - Other Race
Median resident age - Males - White
Median resident age - Males - Black or African American
Median resident age - Males - Asian
Median resident age - Males - Hispanic or Latino
Median resident age - Males - American Indian and Alaska Native
Median resident age - Males - Multirace
Median resident age - Males - Other Race
Median resident age - Females - White
Median resident age - Females - Black or African American
Median resident age - Females - Asian
Median resident age - Females - Hispanic or Latino
Median resident age - Females - American Indian and Alaska Native
Median resident age - Females - Multirace
Median resident age - Females - Other Race
Commute - mean travel time to work (minutes)
Travel time to work - Less than 5 minutes (%)
Travel time to work - Less than 5 minutes (% change since 2000)
Travel time to work - 5 to 9 minutes (%)
Travel time to work - 5 to 9 minutes (% change since 2000)
Travel time to work - 10 to 19 minutes (%)
Travel time to work - 10 to 19 minutes (% change since 2000)
Travel time to work - 20 to 29 minutes (%)
Travel time to work - 20 to 29 minutes (% change since 2000)
Travel time to work - 30 to 39 minutes (%)
Travel time to work - 30 to 39 minutes (% change since 2000)
Travel time to work - 40 to 59 minutes (%)
Travel time to work - 40 to 59 minutes (% change since 2000)
Travel time to work - 60 to 89 minutes (%)
Travel time to work - 60 to 89 minutes (% change since 2000)
Travel time to work - 90 or more minutes (%)
Travel time to work - 90 or more minutes (% change since 2000)
Marital status - Never married (%)
Marital status - Now married (%)
Marital status - Separated (%)
Marital status - Widowed (%)
Marital status - Divorced (%)
Median family income ($)
Median family income (% change since 2000)
Median non-family income ($)
Median non-family income (% change since 2000)
Median per capita income ($)
Median per capita income (% change since 2000)
Median family income ($) - White
Median family income ($) - Black or African American
Median family income ($) - Asian
Median family income ($) - Hispanic or Latino
Median family income ($) - American Indian and Alaska Native
Median family income ($) - Multirace
Median family income ($) - Other Race
Median year house/condo built
Median year apartment built
Year house built - Built 2005 or later (%)
Year house built - Built 2000 to 2004 (%)
Year house built - Built 1990 to 1999 (%)
Year house built - Built 1980 to 1989 (%)
Year house built - Built 1970 to 1979 (%)
Year house built - Built 1960 to 1969 (%)
Year house built - Built 1950 to 1959 (%)
Year house built - Built 1940 to 1949 (%)
Year house built - Built 1939 or earlier (%)
Average household size
Household density (households per square mile)
Average household size - White
Average household size - Black or African American
Average household size - Asian
Average household size - Hispanic or Latino
Average household size - American Indian and Alaska Native
Average household size - Multirace
Average household size - Other Race
Occupied housing units (%)
Vacant housing units (%)
Owner occupied housing units (%)
Renter occupied housing units (%)
Vacancy status - For rent (%)
Vacancy status - For sale only (%)
Vacancy status - Rented or sold, not occupied (%)
Vacancy status - For seasonal, recreational, or occasional use (%)
Vacancy status - For migrant workers (%)
Vacancy status - Other vacant (%)
Residents with income below the poverty level (%)
Residents with income below 50% of the poverty level (%)
Children below poverty level (%)
Poor families by family type - Married-couple family (%)
Poor families by family type - Male, no wife present (%)
Poor families by family type - Female, no husband present (%)
Poverty status for native-born residents (%)
Poverty status for foreign-born residents (%)
Poverty among high school graduates not in families (%)
Poverty among people who did not graduate high school not in families (%)
Residents with income below the poverty level (%) - White
Residents with income below the poverty level (%) - Black or African American
Residents with income below the poverty level (%) - Asian
Residents with income below the poverty level (%) - Hispanic or Latino
Residents with income below the poverty level (%) - American Indian and Alaska Native
Residents with income below the poverty level (%) - Multirace
Residents with income below the poverty level (%) - Other Race
Air pollution - Air Quality Index (AQI)
Air pollution - CO
Air pollution - NO2
Air pollution - SO2
Air pollution - Ozone
Air pollution - PM10
Air pollution - PM25
Air pollution - Pb
Crime - Murders per 100,000 population
Crime - Rapes per 100,000 population
Crime - Robberies per 100,000 population
Crime - Assaults per 100,000 population
Crime - Burglaries per 100,000 population
Crime - Thefts per 100,000 population
Crime - Auto thefts per 100,000 population
Crime - Arson per 100,000 population
Crime - City-data.com crime index
Crime - Violent crime index
Crime - Property crime index
Crime - Murders per 100,000 population (5 year average)
Crime - Rapes per 100,000 population (5 year average)
Crime - Robberies per 100,000 population (5 year average)
Crime - Assaults per 100,000 population (5 year average)
Crime - Burglaries per 100,000 population (5 year average)
Crime - Thefts per 100,000 population (5 year average)
Crime - Auto thefts per 100,000 population (5 year average)
Crime - Arson per 100,000 population (5 year average)
Crime - City-data.com crime index (5 year average)
Crime - Violent crime index (5 year average)
Crime - Property crime index (5 year average)
1996 Presidential Elections Results (%) - Democratic Party (Clinton)
1996 Presidential Elections Results (%) - Republican Party (Dole)
1996 Presidential Elections Results (%) - Other
2000 Presidential Elections Results (%) - Democratic Party (Gore)
2000 Presidential Elections Results (%) - Republican Party (Bush)
2000 Presidential Elections Results (%) - Other
2004 Presidential Elections Results (%) - Democratic Party (Kerry)
2004 Presidential Elections Results (%) - Republican Party (Bush)
2004 Presidential Elections Results (%) - Other
2008 Presidential Elections Results (%) - Democratic Party (Obama)
2008 Presidential Elections Results (%) - Republican Party (McCain)
2008 Presidential Elections Results (%) - Other
2012 Presidential Elections Results (%) - Democratic Party (Obama)
2012 Presidential Elections Results (%) - Republican Party (Romney)
2012 Presidential Elections Results (%) - Other
2016 Presidential Elections Results (%) - Democratic Party (Clinton)
2016 Presidential Elections Results (%) - Republican Party (Trump)
2016 Presidential Elections Results (%) - Other
2020 Presidential Elections Results (%) - Democratic Party (Biden)
2020 Presidential Elections Results (%) - Republican Party (Trump)
2020 Presidential Elections Results (%) - Other
Ancestries Reported - Arab (%)
Ancestries Reported - Czech (%)
Ancestries Reported - Danish (%)
Ancestries Reported - Dutch (%)
Ancestries Reported - English (%)
Ancestries Reported - French (%)
Ancestries Reported - French Canadian (%)
Ancestries Reported - German (%)
Ancestries Reported - Greek (%)
Ancestries Reported - Hungarian (%)
Ancestries Reported - Irish (%)
Ancestries Reported - Italian (%)
Ancestries Reported - Lithuanian (%)
Ancestries Reported - Norwegian (%)
Ancestries Reported - Polish (%)
Ancestries Reported - Portuguese (%)
Ancestries Reported - Russian (%)
Ancestries Reported - Scotch-Irish (%)
Ancestries Reported - Scottish (%)
Ancestries Reported - Slovak (%)
Ancestries Reported - Subsaharan African (%)
Ancestries Reported - Swedish (%)
Ancestries Reported - Swiss (%)
Ancestries Reported - Ukrainian (%)
Ancestries Reported - United States (%)
Ancestries Reported - Welsh (%)
Ancestries Reported - West Indian (%)
Ancestries Reported - Other (%)
Educational Attainment - No schooling completed (%)
Educational Attainment - Less than high school (%)
Educational Attainment - High school or equivalent (%)
Educational Attainment - Less than 1 year of college (%)
Educational Attainment - 1 or more years of college (%)
Educational Attainment - Associate degree (%)
Educational Attainment - Bachelor's degree (%)
Educational Attainment - Master's degree (%)
Educational Attainment - Professional school degree (%)
Educational Attainment - Doctorate degree (%)
School Enrollment - Nursery, preschool (%)
School Enrollment - Kindergarten (%)
School Enrollment - Grade 1 to 4 (%)
School Enrollment - Grade 5 to 8 (%)
School Enrollment - Grade 9 to 12 (%)
School Enrollment - College undergrad (%)
School Enrollment - Graduate or professional (%)
School Enrollment - Not enrolled in school (%)
School enrollment - Public schools (%)
School enrollment - Private schools (%)
School enrollment - Not enrolled (%)
Median number of rooms in houses and condos
Median number of rooms in apartments
Housing units lacking complete plumbing facilities (%)
Housing units lacking complete kitchen facilities (%)
Density of houses
Urban houses (%)
Rural houses (%)
Households with people 60 years and over (%)
Households with people 65 years and over (%)
Households with people 75 years and over (%)
Households with one or more nonrelatives (%)
Households with no nonrelatives (%)
Population in households (%)
Family households (%)
Nonfamily households (%)
Population in families (%)
Family households with own children (%)
Median number of bedrooms in owner occupied houses
Mean number of bedrooms in owner occupied houses
Median number of bedrooms in renter occupied houses
Mean number of bedrooms in renter occupied houses
Median number of vehichles in owner occupied houses
Mean number of vehichles in owner occupied houses
Median number of vehichles in renter occupied houses
Mean number of vehichles in renter occupied houses
Mortgage status - with mortgage (%)
Mortgage status - with second mortgage (%)
Mortgage status - with home equity loan (%)
Mortgage status - with both second mortgage and home equity loan (%)
Mortgage status - without a mortgage (%)
Average family size
Average family size - White
Average family size - Black or African American
Average family size - Asian
Average family size - Hispanic or Latino
Average family size - American Indian and Alaska Native
Average family size - Multirace
Average family size - Other Race
Geographical mobility - Same house 1 year ago (%)
Geographical mobility - Moved within same county (%)
Geographical mobility - Moved from different county within same state (%)
Geographical mobility - Moved from different state (%)
Geographical mobility - Moved from abroad (%)
Place of birth - Born in state of residence (%)
Place of birth - Born in other state (%)
Place of birth - Native, outside of US (%)
Place of birth - Foreign born (%)
Housing units in structures - 1, detached (%)
Housing units in structures - 1, attached (%)
Housing units in structures - 2 (%)
Housing units in structures - 3 or 4 (%)
Housing units in structures - 5 to 9 (%)
Housing units in structures - 10 to 19 (%)
Housing units in structures - 20 to 49 (%)
Housing units in structures - 50 or more (%)
Housing units in structures - Mobile home (%)
Housing units in structures - Boat, RV, van, etc. (%)
House/condo owner moved in on average (years ago)
Renter moved in on average (years ago)
Year householder moved into unit - Moved in 1999 to March 2000 (%)
Year householder moved into unit - Moved in 1995 to 1998 (%)
Year householder moved into unit - Moved in 1990 to 1994 (%)
Year householder moved into unit - Moved in 1980 to 1989 (%)
Year householder moved into unit - Moved in 1970 to 1979 (%)
Year householder moved into unit - Moved in 1969 or earlier (%)
Means of transportation to work - Drove car alone (%)
Means of transportation to work - Carpooled (%)
Means of transportation to work - Public transportation (%)
Means of transportation to work - Bus or trolley bus (%)
Means of transportation to work - Streetcar or trolley car (%)
Means of transportation to work - Subway or elevated (%)
Means of transportation to work - Railroad (%)
Means of transportation to work - Ferryboat (%)
Means of transportation to work - Taxicab (%)
Means of transportation to work - Motorcycle (%)
Means of transportation to work - Bicycle (%)
Means of transportation to work - Walked (%)
Means of transportation to work - Other means (%)
Working at home (%)
Industry diversity
Most Common Industries - Agriculture, forestry, fishing and hunting, and mining (%)
Most Common Industries - Agriculture, forestry, fishing and hunting (%)
Most Common Industries - Mining, quarrying, and oil and gas extraction (%)
Most Common Industries - Construction (%)
Most Common Industries - Manufacturing (%)
Most Common Industries - Wholesale trade (%)
Most Common Industries - Retail trade (%)
Most Common Industries - Transportation and warehousing, and utilities (%)
Most Common Industries - Transportation and warehousing (%)
Most Common Industries - Utilities (%)
Most Common Industries - Information (%)
Most Common Industries - Finance and insurance, and real estate and rental and leasing (%)
Most Common Industries - Finance and insurance (%)
Most Common Industries - Real estate and rental and leasing (%)
Most Common Industries - Professional, scientific, and management, and administrative and waste management services (%)
Most Common Industries - Professional, scientific, and technical services (%)
Most Common Industries - Management of companies and enterprises (%)
Most Common Industries - Administrative and support and waste management services (%)
Most Common Industries - Educational services, and health care and social assistance (%)
Most Common Industries - Educational services (%)
Most Common Industries - Health care and social assistance (%)
Most Common Industries - Arts, entertainment, and recreation, and accommodation and food services (%)
Most Common Industries - Arts, entertainment, and recreation (%)
Most Common Industries - Accommodation and food services (%)
Most Common Industries - Other services, except public administration (%)
Most Common Industries - Public administration (%)
Occupation diversity
Most Common Occupations - Management, business, science, and arts occupations (%)
Most Common Occupations - Management, business, and financial occupations (%)
Most Common Occupations - Management occupations (%)
Most Common Occupations - Business and financial operations occupations (%)
Most Common Occupations - Computer, engineering, and science occupations (%)
Most Common Occupations - Computer and mathematical occupations (%)
Most Common Occupations - Architecture and engineering occupations (%)
Most Common Occupations - Life, physical, and social science occupations (%)
Most Common Occupations - Education, legal, community service, arts, and media occupations (%)
Most Common Occupations - Community and social service occupations (%)
Most Common Occupations - Legal occupations (%)
Most Common Occupations - Education, training, and library occupations (%)
Most Common Occupations - Arts, design, entertainment, sports, and media occupations (%)
Most Common Occupations - Healthcare practitioners and technical occupations (%)
Most Common Occupations - Health diagnosing and treating practitioners and other technical occupations (%)
Most Common Occupations - Health technologists and technicians (%)
Most Common Occupations - Service occupations (%)
Most Common Occupations - Healthcare support occupations (%)
Most Common Occupations - Protective service occupations (%)
Most Common Occupations - Fire fighting and prevention, and other protective service workers including supervisors (%)
Most Common Occupations - Law enforcement workers including supervisors (%)
Most Common Occupations - Food preparation and serving related occupations (%)
Most Common Occupations - Building and grounds cleaning and maintenance occupations (%)
Most Common Occupations - Personal care and service occupations (%)
Most Common Occupations - Sales and office occupations (%)
Most Common Occupations - Sales and related occupations (%)
Most Common Occupations - Office and administrative support occupations (%)
Most Common Occupations - Natural resources, construction, and maintenance occupations (%)
Most Common Occupations - Farming, fishing, and forestry occupations (%)
Most Common Occupations - Construction and extraction occupations (%)
Most Common Occupations - Installation, maintenance, and repair occupations (%)
Most Common Occupations - Production, transportation, and material moving occupations (%)
Most Common Occupations - Production occupations (%)
Most Common Occupations - Transportation occupations (%)
Most Common Occupations - Material moving occupations (%)
People in Group quarters - Institutionalized population (%)
People in Group quarters - Correctional institutions (%)
People in Group quarters - Federal prisons and detention centers (%)
People in Group quarters - Halfway houses (%)
People in Group quarters - Local jails and other confinement facilities (including police lockups) (%)
People in Group quarters - Military disciplinary barracks (%)
People in Group quarters - State prisons (%)
People in Group quarters - Other types of correctional institutions (%)
People in Group quarters - Nursing homes (%)
People in Group quarters - Hospitals/wards, hospices, and schools for the handicapped (%)
People in Group quarters - Hospitals/wards and hospices for chronically ill (%)
People in Group quarters - Hospices or homes for chronically ill (%)
People in Group quarters - Military hospitals or wards for chronically ill (%)
People in Group quarters - Other hospitals or wards for chronically ill (%)
People in Group quarters - Hospitals or wards for drug/alcohol abuse (%)
People in Group quarters - Mental (Psychiatric) hospitals or wards (%)
People in Group quarters - Schools, hospitals, or wards for the mentally retarded (%)
People in Group quarters - Schools, hospitals, or wards for the physically handicapped (%)
People in Group quarters - Institutions for the deaf (%)
People in Group quarters - Institutions for the blind (%)
People in Group quarters - Orthopedic wards and institutions for the physically handicapped (%)
People in Group quarters - Wards in general hospitals for patients who have no usual home elsewhere (%)
People in Group quarters - Wards in military hospitals for patients who have no usual home elsewhere (%)
People in Group quarters - Juvenile institutions (%)
People in Group quarters - Long-term care (%)
People in Group quarters - Homes for abused, dependent, and neglected children (%)
People in Group quarters - Residential treatment centers for emotionally disturbed children (%)
People in Group quarters - Training schools for juvenile delinquents (%)
People in Group quarters - Short-term care, detention or diagnostic centers for delinquent children (%)
People in Group quarters - Type of juvenile institution unknown (%)
People in Group quarters - Noninstitutionalized population (%)
People in Group quarters - College dormitories (includes college quarters off campus) (%)
People in Group quarters - Military quarters (%)
People in Group quarters - On base (%)
People in Group quarters - Barracks, unaccompanied personnel housing (UPH), (Enlisted/Officer), ;and similar group living quarters for military personnel (%)
People in Group quarters - Transient quarters for temporary residents (%)
People in Group quarters - Military ships (%)
People in Group quarters - Group homes (%)
People in Group quarters - Homes or halfway houses for drug/alcohol abuse (%)
People in Group quarters - Homes for the mentally ill (%)
People in Group quarters - Homes for the mentally retarded (%)
People in Group quarters - Homes for the physically handicapped (%)
People in Group quarters - Other group homes (%)
People in Group quarters - Religious group quarters (%)
People in Group quarters - Dormitories (%)
People in Group quarters - Agriculture workers' dormitories on farms (%)
People in Group quarters - Job Corps and vocational training facilities (%)
People in Group quarters - Other workers' dormitories (%)
People in Group quarters - Crews of maritime vessels (%)
People in Group quarters - Other nonhousehold living situations (%)
People in Group quarters - Other noninstitutional group quarters (%)
Residents speaking English at home (%)
Residents speaking English at home - Born in the United States (%)
Residents speaking English at home - Native, born elsewhere (%)
Residents speaking English at home - Foreign born (%)
Residents speaking Spanish at home (%)
Residents speaking Spanish at home - Born in the United States (%)
Residents speaking Spanish at home - Native, born elsewhere (%)
Residents speaking Spanish at home - Foreign born (%)
Residents speaking other language at home (%)
Residents speaking other language at home - Born in the United States (%)
Residents speaking other language at home - Native, born elsewhere (%)
Residents speaking other language at home - Foreign born (%)
Class of Workers - Employee of private company (%)
Class of Workers - Self-employed in own incorporated business (%)
Class of Workers - Private not-for-profit wage and salary workers (%)
Class of Workers - Local government workers (%)
Class of Workers - State government workers (%)
Class of Workers - Federal government workers (%)
Class of Workers - Self-employed workers in own not incorporated business and Unpaid family workers (%)
House heating fuel used in houses and condos - Utility gas (%)
House heating fuel used in houses and condos - Bottled, tank, or LP gas (%)
House heating fuel used in houses and condos - Electricity (%)
House heating fuel used in houses and condos - Fuel oil, kerosene, etc. (%)
House heating fuel used in houses and condos - Coal or coke (%)
House heating fuel used in houses and condos - Wood (%)
House heating fuel used in houses and condos - Solar energy (%)
House heating fuel used in houses and condos - Other fuel (%)
House heating fuel used in houses and condos - No fuel used (%)
House heating fuel used in apartments - Utility gas (%)
House heating fuel used in apartments - Bottled, tank, or LP gas (%)
House heating fuel used in apartments - Electricity (%)
House heating fuel used in apartments - Fuel oil, kerosene, etc. (%)
House heating fuel used in apartments - Coal or coke (%)
House heating fuel used in apartments - Wood (%)
House heating fuel used in apartments - Solar energy (%)
House heating fuel used in apartments - Other fuel (%)
House heating fuel used in apartments - No fuel used (%)
Armed forces status - In Armed Forces (%)
Armed forces status - Civilian (%)
Armed forces status - Civilian - Veteran (%)
Armed forces status - Civilian - Nonveteran (%)
Fatal accidents locations in years 2005-2021
Fatal accidents locations in 2005
Fatal accidents locations in 2006
Fatal accidents locations in 2007
Fatal accidents locations in 2008
Fatal accidents locations in 2009
Fatal accidents locations in 2010
Fatal accidents locations in 2011
Fatal accidents locations in 2012
Fatal accidents locations in 2013
Fatal accidents locations in 2014
Fatal accidents locations in 2015
Fatal accidents locations in 2016
Fatal accidents locations in 2017
Fatal accidents locations in 2018
Fatal accidents locations in 2019
Fatal accidents locations in 2020
Fatal accidents locations in 2021
Alcohol use - People drinking some alcohol every month (%)
Alcohol use - People not drinking at all (%)
Alcohol use - Average days/month drinking alcohol
Alcohol use - Average drinks/week
Alcohol use - Average days/year people drink much
Audiometry - Average condition of hearing (%)
Audiometry - People that can hear a whisper from across a quiet room (%)
Audiometry - People that can hear normal voice from across a quiet room (%)
Audiometry - Ears ringing, roaring, buzzing (%)
Audiometry - Had a job exposure to loud noise (%)
Audiometry - Had off-work exposure to loud noise (%)
Blood Pressure & Cholesterol - Has high blood pressure (%)
Blood Pressure & Cholesterol - Checking blood pressure at home (%)
Blood Pressure & Cholesterol - Frequently checking blood cholesterol (%)
Blood Pressure & Cholesterol - Has high cholesterol level (%)
Consumer Behavior - Money monthly spent on food at supermarket/grocery store
Consumer Behavior - Money monthly spent on food at other stores
Consumer Behavior - Money monthly spent on eating out
Consumer Behavior - Money monthly spent on carryout/delivered foods
Consumer Behavior - Income spent on food at supermarket/grocery store (%)
Consumer Behavior - Income spent on food at other stores (%)
Consumer Behavior - Income spent on eating out (%)
Consumer Behavior - Income spent on carryout/delivered foods (%)
Current Health Status - General health condition (%)
Current Health Status - Blood donors (%)
Current Health Status - Has blood ever tested for HIV virus (%)
Current Health Status - Left-handed people (%)
Dermatology - People using sunscreen (%)
Diabetes - Diabetics (%)
Diabetes - Had a blood test for high blood sugar (%)
Diabetes - People taking insulin (%)
Diet Behavior & Nutrition - Diet health (%)
Diet Behavior & Nutrition - Milk product consumption (# of products/month)
Diet Behavior & Nutrition - Meals not home prepared (#/week)
Diet Behavior & Nutrition - Meals from fast food or pizza place (#/week)
Diet Behavior & Nutrition - Ready-to-eat foods (#/month)
Diet Behavior & Nutrition - Frozen meals/pizza (#/month)
Drug Use - People that ever used marijuana or hashish (%)
Drug Use - Ever used hard drugs (%)
Drug Use - Ever used any form of cocaine (%)
Drug Use - Ever used heroin (%)
Drug Use - Ever used methamphetamine (%)
Health Insurance - People covered by health insurance (%)
Kidney Conditions-Urology - Avg. # of times urinating at night
Medical Conditions - People with asthma (%)
Medical Conditions - People with anemia (%)
Medical Conditions - People with psoriasis (%)
Medical Conditions - People with overweight (%)
Medical Conditions - Elderly people having difficulties in thinking or remembering (%)
Medical Conditions - People who ever received blood transfusion (%)
Medical Conditions - People having trouble seeing even with glass/contacts (%)
Medical Conditions - People with arthritis (%)
Medical Conditions - People with gout (%)
Medical Conditions - People with congestive heart failure (%)
Medical Conditions - People with coronary heart disease (%)
Medical Conditions - People with angina pectoris (%)
Medical Conditions - People who ever had heart attack (%)
Medical Conditions - People who ever had stroke (%)
Medical Conditions - People with emphysema (%)
Medical Conditions - People with thyroid problem (%)
Medical Conditions - People with chronic bronchitis (%)
Medical Conditions - People with any liver condition (%)
Medical Conditions - People who ever had cancer or malignancy (%)
Mental Health - People who have little interest in doing things (%)
Mental Health - People feeling down, depressed, or hopeless (%)
Mental Health - People who have trouble sleeping or sleeping too much (%)
Mental Health - People feeling tired or having little energy (%)
Mental Health - People with poor appetite or overeating (%)
Mental Health - People feeling bad about themself (%)
Mental Health - People who have trouble concentrating on things (%)
Mental Health - People moving or speaking slowly or too fast (%)
Mental Health - People having thoughts they would be better off dead (%)
Oral Health - Average years since last visit a dentist
Oral Health - People embarrassed because of mouth (%)
Oral Health - People with gum disease (%)
Oral Health - General health of teeth and gums (%)
Oral Health - Average days a week using dental floss/device
Oral Health - Average days a week using mouthwash for dental problem
Oral Health - Average number of teeth
Pesticide Use - Households using pesticides to control insects (%)
Pesticide Use - Households using pesticides to kill weeds (%)
Physical Activity - People doing vigorous-intensity work activities (%)
Physical Activity - People doing moderate-intensity work activities (%)
Physical Activity - People walking or bicycling (%)
Physical Activity - People doing vigorous-intensity recreational activities (%)
Physical Activity - People doing moderate-intensity recreational activities (%)
Physical Activity - Average hours a day doing sedentary activities
Physical Activity - Average hours a day watching TV or videos
Physical Activity - Average hours a day using computer
Physical Functioning - People having limitations keeping them from working (%)
Physical Functioning - People limited in amount of work they can do (%)
Physical Functioning - People that need special equipment to walk (%)
Physical Functioning - People experiencing confusion/memory problems (%)
Physical Functioning - People requiring special healthcare equipment (%)
Prescription Medications - Average number of prescription medicines taking
Preventive Aspirin Use - Adults 40+ taking low-dose aspirin (%)
Reproductive Health - Vaginal deliveries (%)
Reproductive Health - Cesarean deliveries (%)
Reproductive Health - Deliveries resulted in a live birth (%)
Reproductive Health - Pregnancies resulted in a delivery (%)
Reproductive Health - Women breastfeeding newborns (%)
Reproductive Health - Women that had a hysterectomy (%)
Reproductive Health - Women that had both ovaries removed (%)
Reproductive Health - Women that have ever taken birth control pills (%)
Reproductive Health - Women taking birth control pills (%)
Reproductive Health - Women that have ever used Depo-Provera or injectables (%)
Reproductive Health - Women that have ever used female hormones (%)
Sexual Behavior - People 18+ that ever had sex (vaginal, anal, or oral) (%)
Sexual Behavior - Males 18+ that ever had vaginal sex with a woman (%)
Sexual Behavior - Males 18+ that ever performed oral sex on a woman (%)
Sexual Behavior - Males 18+ that ever had anal sex with a woman (%)
Sexual Behavior - Males 18+ that ever had any sex with a man (%)
Sexual Behavior - Females 18+ that ever had vaginal sex with a man (%)
Sexual Behavior - Females 18+ that ever performed oral sex on a man (%)
Sexual Behavior - Females 18+ that ever had anal sex with a man (%)
Sexual Behavior - Females 18+ that ever had any kind of sex with a woman (%)
Sexual Behavior - Average age people first had sex
Sexual Behavior - Average number of female sex partners in lifetime (males 18+)
Sexual Behavior - Average number of female vaginal sex partners in lifetime (males 18+)
Sexual Behavior - Average age people first performed oral sex on a woman (18+)
Sexual Behavior - Average number of woman performed oral sex on in lifetime (18+)
Sexual Behavior - Average number of male sex partners in lifetime (males 18+)
Sexual Behavior - Average number of male anal sex partners in lifetime (males 18+)
Sexual Behavior - Average age people first performed oral sex on a man (18+)
Sexual Behavior - Average number of male oral sex partners in lifetime (18+)
Sexual Behavior - People using protection when performing oral sex (%)
Sexual Behavior - Average number of times people have vaginal or anal sex a year
Sexual Behavior - People having sex without condom (%)
Sexual Behavior - Average number of male sex partners in lifetime (females 18+)
Sexual Behavior - Average number of male vaginal sex partners in lifetime (females 18+)
Sexual Behavior - Average number of female sex partners in lifetime (females 18+)
Sexual Behavior - Circumcised males 18+ (%)
Sleep Disorders - Average hours sleeping at night
Sleep Disorders - People that has trouble sleeping (%)
Smoking-Cigarette Use - People smoking cigarettes (%)
Taste & Smell - People 40+ having problems with smell (%)
Taste & Smell - People 40+ having problems with taste (%)
Taste & Smell - People 40+ that ever had wisdom teeth removed (%)
Taste & Smell - People 40+ that ever had tonsils teeth removed (%)
Taste & Smell - People 40+ that ever had a loss of consciousness because of a head injury (%)
Taste & Smell - People 40+ that ever had a broken nose or other serious injury to face or skull (%)
Taste & Smell - People 40+ that ever had two or more sinus infections (%)
Weight - Average height (inches)
Weight - Average weight (pounds)
Weight - Average BMI
Weight - People that are obese (%)
Weight - People that ever were obese (%)
Weight - People trying to lose weight (%)
Urban population: 39,404
Rural population: 356
Estimated median house/condo value in 2022: $105,069
77642:
$105,069Texas:
$275,400
According to our research of Texas and other state lists, there were 72 registered sex offenders living in 77642 zip code as of April 19, 2024 . The ratio of all residents to sex offenders in zip code 77642 is 553 to 1.The ratio of registered sex offenders to all residents in this zip code is lower than the state average.
Median resident age: This zip code:
31.3 yearsTexas median age:
35.6 years
Average household size: This zip code:
2.7 peopleTexas:
2.6 people
Averages for the 2020 tax year for zip code 77642, filed in 2021:
Average Adjusted Gross Income (AGI) in 2020: $40,555 (Individual Income Tax Returns) Here:
$40,555State:
$77,054
Salary/wage: $37,852 (reported on 84.1% of returns )Here:
$37,852State:
$62,766
(% of AGI for various income ranges: 1191.9% for AGIs below $25k , 3469.4% for AGIs $25k-50k , 6434.5% for AGIs $50k-75k , 9353.5% for AGIs $75k-100k , 15655.3% for AGIs $100k-200k , 57420.0% for AGIs over 200k ) Taxable interest for individuals: $948 (reported on 14.0% of returns )This zip code:
$948Texas:
$2,665
(% of AGI for various income ranges: 3.7% for AGIs below $25k , 9.2% for AGIs $25k-50k , 12.1% for AGIs $50k-75k , 21.4% for AGIs $75k-100k , 106.6% for AGIs $100k-200k , 1032.0% for AGIs over 200k ) Ordinary dividends: $5,620 (reported on 4.8% of returns )(% of AGI for various income ranges: 4.8% for AGIs below $25k , 9.0% for AGIs $25k-50k , 33.1% for AGIs $50k-75k , 49.4% for AGIs $75k-100k , 199.2% for AGIs $100k-200k , 2966.0% for AGIs over 200k ) Net capital gain/loss in AGI: +$7,874 (reported on 4.8% of returns )Here:
+$7,874State:
+$39,590
(% of AGI for various income ranges: 0.5% for AGIs below $25k , 13.8% for AGIs $25k-50k , 12.5% for AGIs $50k-75k , 48.9% for AGIs $75k-100k , 267.5% for AGIs $100k-200k , 6342.0% for AGIs over 200k ) Profit/loss from business: +$1,379 (reported on 21.2% of returns )Here:
+$1,379State:
+$10,888
(% of AGI for various income ranges: 82.0% for AGIs below $25k , 32.2% for AGIs $100k-200k , 5736.0% for AGIs over 200k ) Taxable individual retirement arrangement distribution: $23,217 (reported on 3.8% of returns )77642:
$23,217Texas:
$24,740
(% of AGI for various income ranges: 13.7% for AGIs below $25k , 47.2% for AGIs $25k-50k , 129.8% for AGIs $50k-75k , 310.8% for AGIs $75k-100k , 692.2% for AGIs $100k-200k , 5056.0% for AGIs over 200k ) Total itemized deductions: $38,923 (reported on 6.3% of returns )Here:
$38,923State:
$40,428
(% of AGI for various income ranges: 27.0% for AGIs below $25k , 194.3% for AGIs $25k-50k , 561.5% for AGIs $50k-75k , 975.1% for AGIs $75k-100k , 1357.5% for AGIs $100k-200k , 9866.0% for AGIs over 200k ) Charity contributions: $15,340 (reported on 3.1% of returns )Here:
$15,340State:
$18,201
(% of AGI for various income ranges: 41.1% for AGIs $25k-50k , 88.5% for AGIs $50k-75k , 170.4% for AGIs $75k-100k , 341.5% for AGIs $100k-200k , 2376.0% for AGIs over 200k ) Taxes paid: $5,384 (reported on 3.7% of returns )(% of AGI for various income ranges: 1.1% for AGIs below $25k , 13.6% for AGIs $25k-50k , 37.6% for AGIs $50k-75k , 72.4% for AGIs $75k-100k , 151.0% for AGIs $100k-200k , 972.0% for AGIs over 200k ) Earned income credit: $2,778 (reported on 32.9% of returns )(% of AGI for various income ranges: 178.1% for AGIs below $25k , 105.1% for AGIs $25k-50k , 3.3% for AGIs $50k-75k ) Percentage of individuals using paid preparers for their 2020 taxes: 89.8%(% for various income ranges: 89.4% for AGIs below $25k , 91.5% for AGIs $25k-50k , 90.0% for AGIs $50k-75k , 88.4% for AGIs $75k-100k , 87.4% for AGIs $100k-200k , 81.2% for AGIs over 200k )
Averages for the 2012 tax year for zip code 77642, filed in 2013:
Average Adjusted Gross Income (AGI) in 2012: $37,704 (Individual Income Tax Returns) Here:
$37,704State:
$65,384
Salary/wage: $35,449 (reported on 87.4% of returns )Here:
$35,449State:
$52,524
(% of AGI for various income ranges: 79.1% for AGIs below $25k , 87.0% for AGIs $25k-50k , 86.1% for AGIs $50k-75k , 82.4% for AGIs $75k-100k , 80.0% for AGIs $100k-200k , 59.4% for AGIs over 200k ) Taxable interest for individuals: $1,283 (reported on 17.1% of returns )This zip code:
$1,283Texas:
$2,372
(% of AGI for various income ranges: 0.6% for AGIs below $25k , 0.4% for AGIs $25k-50k , 0.4% for AGIs $50k-75k , 0.6% for AGIs $75k-100k , 0.6% for AGIs $100k-200k , 2.1% for AGIs over 200k ) Ordinary dividends: $5,459 (reported on 6.5% of returns )(% of AGI for various income ranges: 0.8% for AGIs below $25k , 0.5% for AGIs $25k-50k , 0.7% for AGIs $50k-75k , 0.8% for AGIs $75k-100k , 1.0% for AGIs $100k-200k , 5.1% for AGIs over 200k ) Net capital gain/loss in AGI: +$2,306 (reported on 4.4% of returns )Here:
+$2,306State:
+$35,319
(% of AGI for various income ranges: 0.1% for AGIs $25k-50k , 0.1% for AGIs $50k-75k , 0.3% for AGIs $75k-100k , 0.8% for AGIs $100k-200k , 0.5% for AGIs over 200k ) Profit/loss from business: +$5,321 (reported on 14.9% of returns )Here:
+$5,321State:
+$13,732
(% of AGI for various income ranges: 9.5% for AGIs below $25k , 0.2% for AGIs $50k-75k , 2.9% for AGIs $100k-200k ) Taxable individual retirement arrangement distribution: $16,778 (reported on 6.0% of returns )77642:
$16,778Texas:
$19,511
(% of AGI for various income ranges: 1.7% for AGIs below $25k , 1.7% for AGIs $25k-50k , 2.4% for AGIs $50k-75k , 4.1% for AGIs $75k-100k , 3.8% for AGIs $100k-200k , 3.2% for AGIs over 200k ) Total itemized deductions: $20,741 (26% of AGI, reported on 13.4% of returns )Here:
$20,741State:
$24,724
Here:
25.9% of AGIState:
15.9% of AGI
(% of AGI for various income ranges: 2.7% for AGIs below $25k , 6.0% for AGIs $25k-50k , 8.6% for AGIs $50k-75k , 8.4% for AGIs $75k-100k , 9.2% for AGIs $100k-200k , 14.1% for AGIs over 200k ) Charity contributions: $5,412 (reported on 10.4% of returns )(% of AGI for various income ranges: 0.4% for AGIs below $25k , 1.0% for AGIs $25k-50k , 1.5% for AGIs $50k-75k , 1.7% for AGIs $75k-100k , 2.6% for AGIs $100k-200k , 3.1% for AGIs over 200k ) Taxes paid: $3,830 (reported on 13.0% of returns )(% of AGI for various income ranges: 0.4% for AGIs below $25k , 0.8% for AGIs $25k-50k , 1.3% for AGIs $50k-75k , 1.5% for AGIs $75k-100k , 2.3% for AGIs $100k-200k , 2.6% for AGIs over 200k ) Earned income credit: $2,632 (reported on 32.3% of returns )(% of AGI for various income ranges: 11.5% for AGIs below $25k , 1.5% for AGIs $25k-50k ) Percentage of individuals using paid preparers for their 2012 taxes: 63.4%(% for various income ranges: 60.5% for AGIs below $25k , 63.4% for AGIs $25k-50k , 68.7% for AGIs $50k-75k , 71.3% for AGIs $75k-100k , 65.9% for AGIs $100k-200k , 80.0% for AGIs over 200k )
Averages for the 2004 tax year for zip code 77642, filed in 2005:
Average Adjusted Gross Income (AGI) in 2004: $29,228 (Individual Income Tax Returns) Here:
$29,228State:
$47,881
Salary/wage: $27,432 (reported on 85.2% of returns )Here:
$27,432State:
$41,947
(% of AGI for various income ranges: 124.1% for AGIs below $10k , 80.7% for AGIs $10k-25k , 85.3% for AGIs $25k-50k , 76.7% for AGIs $50k-75k , 78.9% for AGIs $75k-100k , 67.0% for AGIs over 100k ) Taxable interest for individuals: $1,931 (reported on 28.5% of returns )This zip code:
$1,931Texas:
$2,255
(% of AGI for various income ranges: 4.4% for AGIs below $10k , 2.1% for AGIs $10k-25k , 1.3% for AGIs $25k-50k , 2.2% for AGIs $50k-75k , 2.4% for AGIs $75k-100k , 1.5% for AGIs over 100k ) Taxable dividends: $2,860 (reported on 11.0% of returns )(% of AGI for various income ranges: 2.0% for AGIs below $10k , 0.9% for AGIs $10k-25k , 0.6% for AGIs $25k-50k , 0.9% for AGIs $50k-75k , 1.4% for AGIs $75k-100k , 1.8% for AGIs over 100k ) Net capital gain/loss: +$3,090 (reported on 8.1% of returns )Here:
+$3,090State:
+$16,110
(% of AGI for various income ranges: -0.1% for AGIs below $10k , -0.1% for AGIs $10k-25k , 0.2% for AGIs $25k-50k , 0.4% for AGIs $50k-75k , 0.6% for AGIs $75k-100k , 3.7% for AGIs over 100k ) Profit/loss from business: +$5,685 (reported on 13.4% of returns )Here:
+$5,685State:
+$11,013
(% of AGI for various income ranges: 6.9% for AGIs below $10k , 4.2% for AGIs $10k-25k , 0.7% for AGIs $25k-50k , 1.0% for AGIs $50k-75k , 0.7% for AGIs $75k-100k , 6.2% for AGIs over 100k ) IRA payment deduction: $2,906 (reported on 1.0% of returns )(% of AGI for various income ranges: 0.1% for AGIs $10k-25k , 0.1% for AGIs $25k-50k , 0.1% for AGIs $50k-75k , 0.1% for AGIs $75k-100k , 0.1% for AGIs over 100k ) Self-employed pension: $20,143 (reported on 0.1% of returns )Here:
$20,143Texas:
$16,401
Total itemized deductions: $17,003 (26% of AGI, reported on 13.5% of returns )Here:
$17,003State:
$19,631
Here:
26.1% of AGIState:
18.9% of AGI
(% of AGI for various income ranges: 3.6% for AGIs below $10k , 3.6% for AGIs $10k-25k , 8.6% for AGIs $25k-50k , 9.3% for AGIs $50k-75k , 9.4% for AGIs $75k-100k , 9.4% for AGIs over 100k ) Charity contributions deductions: $4,642 (7% of AGI, reported on 11.3% of returns )Here:
6.9% of AGIState:
4.2% of AGI
(% of AGI for various income ranges: 0.4% for AGIs below $10k , 0.6% for AGIs $10k-25k , 1.6% for AGIs $25k-50k , 2.1% for AGIs $50k-75k , 2.6% for AGIs $75k-100k , 2.8% for AGIs over 100k ) Total tax: $4,329 (reported on 56.8% of returns )(% of AGI for various income ranges: 3.6% for AGIs below $10k , 2.7% for AGIs $10k-25k , 4.8% for AGIs $25k-50k , 9.2% for AGIs $50k-75k , 11.8% for AGIs $75k-100k , 18.3% for AGIs over 100k ) Earned income credit: $2,119 (reported on 34.7% of returns )Percentage of individuals using paid preparers for their 2004 taxes: 67.4%(% for various income ranges: 66.0% for AGIs below $10k , 70.6% for AGIs $10k-25k , 68.7% for AGIs $25k-50k , 62.0% for AGIs $50k-75k , 55.6% for AGIs $75k-100k , 65.2% for AGIs over 100k )
Estimated median household income in 2022: This zip code:
$41,643Texas:
$72,284
Nearest zip codes: 77619 ,
77651 ,
77611 ,
77640 ,
77630 ,
77627 .
Port Neches Zip Code Map
Percentage of family households: This zip code:
53.4%Texas:
50.5%
Percentage of households with unmarried partners: This zip code:
5.0%Texas:
48.7%
Likely homosexual households (counted as self-reported same-sex unmarried-partner households)
Lesbian couples: 0.1% of all households Gay men: 0.1% of all households
Household received Food Stamps/SNAP in the past 12 months: 4,091Household did not receive Food Stamps/SNAP in the past 12 months: 10,342
Women who had a birth in the past 12 months: 343 (216 now married , 126 unmarried) Women who did not have a birth in the past 12 months: 9,610 (3,429 now married , 6,206 unmarried)
Housing units in zip code 77642 with a mortgage: 2,169 (75
second mortgage , 45
both second mortgage and home equity loan )
Houses without a mortgage: 135
Median monthly owner costs for units with a mortgage: $1,342
Median monthly owner costs for units without a mortgage: $462
Residents with income below the poverty level in 2022:
This zip code:
28.7%Whole state:
14.0%
Residents with income below 50% of the poverty level in 2022:
This zip code:
13.7%Whole state:
7.4%
Median number of rooms in houses and condos: Median number of rooms in apartments: Notable locations in this zip code not listed on our city pages
Click to draw/clear zip code borders Notable locations in zip code 77642: (A) , Rainbow Marina (B) , Port Arthur Fire Department Station Number 4 (C) , Port Arthur Fire Department Station Number 6 (D) , Port Arthur Fire Department Station Number 8 (E) , Port Arthur Fire Department Station Number 5 (F) , KJAC-TV Building (G) , Rose Hill House (H) . Display/hide their locations on the map
Shopping Center: (1) . Display/hide its location on the map
Churches in zip code 77642 include: (A) , Presbyterian Church of the Covenant (B) , Spanish United Pentecostal Church (C) , United Methodist Church de Gethsemani (D) , Lakeview United Methodist Church (E) , First Southern Methodist Church of Port Arthur (F) , Saint George Greek Orthodox Church (G) , Central Church of the Nazarene (H) , Bellaire Baptist Church (I) . Display/hide their locations on the map
Cemetery: (1) . Display/hide its location on the map
Parks in zip code 77642 include: (1) , Adams Park (2) , Rose Hill Park (3) , Fairlea Park (4) , London Bridge Park (5) , Hermann Park (6) , Gates Park (7) , Pioneer Park (8) , Memorial Stadium (9) . Display/hide their locations on the map
Year house built (houses)
50 2020 or later1,472 2010 to 20191,849 2000 to 20091,235 1990 to 19991,830 1980 to 19893,179 1970 to 19792,647 1960 to 19692,007 1950 to 1959768 1940 to 1949656 1939 or earlier
Zip code 77642 household income distribution in 2022 2,121 Less than $10,0001,139 $10,000 to $14,999891 $15,000 to $19,999778 $20,000 to $24,999527 $25,000 to $29,999732 $30,000 to $34,999725 $35,000 to $39,999660 $40,000 to $44,999471 $45,000 to $49,9991,242 $50,000 to $59,9991,314 $60,000 to $74,9991,384 $75,000 to $99,9991,070 $100,000 to $124,999322 $125,000 to $149,999529 $150,000 to $199,999528 $200,000 or moreEstimate of home value of owner-occupied houses/condos in 2022 in zip code 77642 59 Less than $10,00039 $10,000 to $14,99926 $15,000 to $19,99993 $20,000 to $24,999341 $25,000 to $29,999404 $30,000 to $34,999307 $35,000 to $39,999327 $40,000 to $49,999366 $50,000 to $59,999410 $60,000 to $69,999361 $70,000 to $79,999428 $80,000 to $89,999334 $90,000 to $99,999563 $100,000 to $124,999281 $125,000 to $149,999527 $150,000 to $174,999176 $175,000 to $199,999373 $200,000 to $249,999356 $250,000 to $299,999294 $300,000 to $399,99960 $400,000 to $499,999102 $500,000 to $749,99918 $750,000 to $999,99984 $2,000,000 or moreRent paid by renters in 2022 in zip code 77642 377 Less than $100266 $100 to $149467 $150 to $199421 $200 to $249226 $250 to $299313 $300 to $34970 $350 to $39952 $400 to $44929 $450 to $49951 $500 to $54989 $550 to $599238 $600 to $649385 $650 to $699355 $700 to $749418 $750 to $799683 $800 to $899557 $900 to $9991,036 $1,000 to $1,249194 $1,250 to $1,49956 $1,500 to $1,99910 $2,000 to $2,499326 No cash rent
Median gross rent in 2022: $913.
Median price asked for vacant for-sale houses and condos in 2022: $455,866.
Estimated median house (or condo) value in 2022 for: White Non-Hispanic householders: $123,482Black or African American householders: $99,111American Indian or Alaska Native householders: $73,114Asian householders: $106,422Native Hawaiian and other Pacific Islander householders: $176,016Some other race householders: $76,093Two or more races householders: $108,318Hispanic or Latino householders: $78,259Estimated median house or condo value in 2022: $105,069
77642:
$105,069Texas:
$275,400
Lower value quartile - upper value quartile: $59,209 - $180,024
Mean price in 2022: Detached houses: $166,860Here:
$166,860State:
$369,058
Townhouses or other attached units: $164,895Here:
$164,895State:
$327,631
Mobile homes: $82,401Here:
$82,401State:
$124,413
Housing units in structures:
One, detached: 9,937One, attached: 329Two: 4113 or 4: 9995 to 9: 2,11710 to 19: 1,55720 to 49: 42250 or more: 542Mobile homes: 123Unemployment : 5.7%
Means of transportation to work in zip code 77642 85.6% 12,390 Drove a car alone6.7% 968 Carpooled0.6% 88 Bus or trolley bus0.2% 32 Bicycle0.8% 112 Walked0.4% 61 Other means1.5% 216 Worked at homeTravel time to work (commute) in zip code 77642 107 Less than 5 minutes1,082 5 to 9 minutes1,956 10 to 14 minutes2,794 15 to 19 minutes3,414 20 to 24 minutes545 25 to 29 minutes2,025 30 to 34 minutes87 35 to 39 minutes167 40 to 44 minutes182 45 to 59 minutes1,011 60 to 89 minutes371 90 or more minutes
Percentage of zip code residents living and working in this county: 84.1%
Household type by relationship:
Households: 39,761
Male householders: 6,186 (2,349 living alone ), Female householders: 8,149 (2,033 living alone )5,525 spouses (5,515 opposite-sex spouses ), 704 unmarried partners , (658 opposite-sex unmarried partners ), 14,355 children (13,925 natural , 60 adopted , 365 stepchildren ), 1,050 grandchildren , 763 brothers or sisters , 891 parents , 39 foster children , 602 other relatives , 790 non-relatives In group quarters: 570 (-1 institutionalized population )
Size of family households: 3,880 2-persons , 2,341 3-persons , 1,526 4-persons , 737 5-persons , 562 6-persons , 439 7-or-more-persons
Size of nonfamily households: 4,383 1-person , 437 2-persons , 18 4-persons , 6 5-persons , 10 6-persons
5,505 married couples with children. single-parent households (504 men , 4,384 women ).
58.1% of residents of 77642 zip code speak English at home. of residents speak Spanish at home (54% very well, 20% well, 16% not well, 10% not at all ).of residents speak other Indo-European language at home (72% very well, 28% well ).of residents speak Asian or Pacific Island language at home (50% very well, 20% well, 20% not well, 10% not at all ).
Foreign born population: 9,722 (24.5%)
(36.2%
of them are naturalized citizens )
This zip code:
24.5%Whole state:
17.2%
55% Honduras 12% Thailand 8% Guatemala 7% Mexico 3% Barbados 3% Bhutan 2% Nepal 2% German 2% French 1% English 1% American 1% Irish 0% Italian 0% French Canadian
Year of entry for the foreign-born population
3,450 2010 or later 2,666 2000 to 2009 2,228 1990 to 1999 2,153 Before 1990
There are
186 Medical Specialists in Zip Code 77642 .
Facilities with environmental interests located in this zip code:
ATOFINA PETROCHEMICALS INCORPORATED (HIGHWAY 366 AND 32ND STREET in PORT ARTHUR, TX)
AIR MAJOR (AIRS/AFS) - ICIS-, ENFORCEMENT/COMPLIANCE ACTIVITY (Integrated Compliance Information System) - ICIS-06-2002-0901, FORMAL ENFORCEMENT ACTION, ICIS-HQ-2000-0065, ICIS-06-1985-0077, CRITERIA AND HAZARDOUS AIR POLLUTANT INVENTORY (Inventory of air pollution sources) National Pollutant Discharge Elimination System MAJOR (Tracking pollutant discharge elimination systems) - permit (Resource Conservation and Recovery Act (tracking hazardous waste)) HAZARDOUS WASTE BIENNIAL REPORTER (Resource Conservation and Recovery Act (tracking hazardous waste)) Large Quantity Generators, more that 1000 kg of hazardous waste/month (Resource Conservation and Recovery Act (tracking hazardous waste)) - notification TSD (Resource Conservation and Recovery Act (tracking hazardous waste)) - notification TRI REPORTER (Tracking of toxic chemicals releasing facilities) Business SIC classification: INDUSTRIAL ORGANIC CHEMICALS; PETROLEUM REFININGBusiness NAICS classification: PETROLEUM REFINERIES.Organizations: TOTAL PETROCHEMICALS USA INC (CONTACT/OPERATOR)
Alternative names: ATOFINA PETROCHEMICAL, INC., ATOFINA PETROCHEMICALS INC. PORT ARTHUR REFY., FINA OIL & CHEMICAL CO, FINA OIL AND CHEMICAL CO - COSDEN CHEM, FINA OIL AND CHEMICAL COMPANY, FINA OIL & CHEM. (PORT ARTHUR), FINA PORT ARTHUR FINA OIL & CHEMICAL CO., TOTAL PETROCHEMICALS USA INC, TOTAL PETROCHEMICALS USA INC PORT ARTHUR REFINERY
ABB LUMMUS GLOBAL INC (HWY 366 @ 17TH ST GATE in PORT ARTHUR, TX)
(Resource Conservation and Recovery Act (tracking hazardous waste))
A M F MATERIALS & TRANSPORT (7145 GULFWAY DR in PORT ARTHUR, TX)
TRANSPORTER (Resource Conservation and Recovery Act (tracking hazardous waste)) Alternative names: AMF MATERIALS & TRANSP
Housing units lacking complete plumbing facilities: 3.0%
Housing units lacking complete kitchen facilities: 3.0%
61.3% Electricity 35.8% Utility gas 2.1% No fuel used 0.6% Bottled, tank, or LP gas
Population in 1990: 33,943. Population change in the 1990s: +3,015 (+8.9%).
Place of birth for U.S.-born residents:
This state: 23,752Northeast: 468Midwest: 634South: 3,319West: 957
57% of the 77642 zip code residents lived in the same house 5 years ago.
Out of people who lived in different houses, 72% lived in this county.
Out of people who lived in different counties, 50% lived in Texas.
94% of the 77642 zip code residents lived in the same house 1 year ago.
Out of people who lived in different houses, 68% moved from this county.
Out of people who lived in different houses, 14% moved from different county within same state.
Out of people who lived in different houses, 8% moved from different state.
Out of people who lived in different houses, 11% moved from abroad.
Private vs. public school enrollment:
Students in private schools in grades 1 to 8 (elementary and middle school): 262
Students in private schools in grades 9 to 12 (high school): 291
Students in private undergraduate colleges: 192
Occupation by median earnings in the past 12 months ($)
86,559 Life, physical, and social science occupations 83,809 Health diagnosing and treating practitioners and other technical occupations 78,410 Architecture and engineering occupations 68,344 Management occupations 65,251 Transportation occupations 64,742 Computer and mathematical occupations
Companies with federal contracts located in this zip code:
MAGNUM FABRICATIONS (6648 GULFWAY DR in PORT ARTHUR, TX; small business)
$21,454 with Army for Trailers. Signed on 2003-09-30. Completion date: 2003-11-30.
Top industries in this zip code by the number of employees in 2005:
Health Care and Social Assistance: General Medical and Surgical Hospitals (500-999 employees: 1 establishment)Health Care and Social Assistance: Nursing Care Facilities (100-249: 4)Health Care and Social Assistance: Offices of Physicians (except Mental Health Specialists) (50-99: 1, 20-49: 3, 10-19: 13, 5-9: 19, 1-4: 25)Construction: Oil and Gas Pipeline and Related Structures Construction (250-499: 1)Construction: Framing Contractors (250-499: 1)Accommodation and Food Services: Limited-Service Restaurants (20-49: 6, 10-19: 7, 5-9: 1, 1-4: 1)Accommodation and Food Services: Full-Service Restaurants (50-99: 2, 20-49: 2, 5-9: 3, 1-4: 4)
People in group quarters in 2010:
501 people in nursing facilities/skilled-nursing facilities
80 people in other noninstitutional facilities
29 people in emergency and transitional shelters (with sleeping facilities) for people experiencing homelessness
14 people in group homes for juveniles (non-correctional)
12 people in group homes intended for adults
People in group quarters in 2000:
387 people in nursing homes
83 people in other noninstitutional group quarters
31 people in other group homes
24 people in religious group quarters
20 people in schools, hospitals, or wards for the intellectually disabled
15 people in other nonhousehold living situations
7 people in crews of maritime vessels
Fatal accident statistics in 2014:
Fatal accident count: 5Vehicles involved in fatal accidents: 8Fatal accidents caused by drunken drivers: 1Fatalities: 5Persons involved in fatal accidents: 11Pedestrians involved in fatal accidents: 2
Fatal accident statistics in 2013:
Fatal accident count: 3Vehicles involved in fatal accidents: 4Fatal accidents caused by drunken drivers: 0Fatalities: 3Persons involved in fatal accidents: 5Pedestrians involved in fatal accidents: 2
Home Mortgage Disclosure Act Aggregated Statistics For Year 2009(Based on 7 full and 18 partial tracts) A) FHA, FSA/RHS & VA B) Conventional C) Refinancings D) Home Improvement Loans E) Loans on Dwellings For 5+ Families F) Non-occupant Loans on G) Loans On Manufactured Number Average Value Number Average Value Number Average Value Number Average Value Number Average Value Number Average Value Number Average Value
LOANS ORIGINATED 80 $101,058 81 $134,459 183 $85,238 59 $40,489 3 $3,030,250 21 $40,600 0 $0 APPLICATIONS APPROVED, NOT ACCEPTED 7 $100,826 7 $64,957 35 $102,227 7 $39,516 0 $0 3 $44,080 2 $88,550 APPLICATIONS DENIED 15 $95,836 49 $108,856 137 $103,118 97 $24,315 0 $0 8 $51,576 0 $0 APPLICATIONS WITHDRAWN 6 $134,405 11 $115,351 49 $103,262 11 $76,547 0 $0 1 $30,000 0 $0 FILES CLOSED FOR INCOMPLETENESS 4 $81,465 5 $83,574 19 $136,007 2 $11,000 0 $0 4 $37,585 0 $0
Aggregated Statistics For Year 2008(Based on 7 full and 18 partial tracts) A) FHA, FSA/RHS & VA B) Conventional C) Refinancings D) Home Improvement Loans E) Loans on Dwellings For 5+ Families F) Non-occupant Loans on G) Loans On Manufactured Number Average Value Number Average Value Number Average Value Number Average Value Number Average Value Number Average Value Number Average Value
LOANS ORIGINATED 62 $110,041 164 $102,913 144 $95,628 96 $35,455 11 $3,795,729 27 $74,510 1 $138,110 APPLICATIONS APPROVED, NOT ACCEPTED 8 $93,950 43 $77,926 44 $70,972 15 $24,459 0 $0 7 $61,920 8 $80,699 APPLICATIONS DENIED 42 $75,391 95 $95,697 181 $76,502 149 $29,083 2 $2,827,300 36 $102,375 3 $50,153 APPLICATIONS WITHDRAWN 7 $97,421 11 $83,144 58 $107,175 10 $31,107 0 $0 7 $44,199 0 $0 FILES CLOSED FOR INCOMPLETENESS 6 $100,017 5 $100,300 8 $67,786 5 $52,700 0 $0 5 $92,998 0 $0
Aggregated Statistics For Year 2007(Based on 7 full and 18 partial tracts) A) FHA, FSA/RHS & VA B) Conventional C) Refinancings D) Home Improvement Loans E) Loans on Dwellings For 5+ Families F) Non-occupant Loans on G) Loans On Manufactured Number Average Value Number Average Value Number Average Value Number Average Value Number Average Value Number Average Value Number Average Value
LOANS ORIGINATED 66 $93,587 388 $100,859 214 $74,562 100 $40,035 8 $2,304,260 61 $61,736 10 $38,283 APPLICATIONS APPROVED, NOT ACCEPTED 9 $62,080 85 $90,166 34 $89,303 34 $26,959 0 $0 13 $62,995 6 $47,570 APPLICATIONS DENIED 15 $74,881 153 $94,581 298 $77,458 267 $23,693 3 $5,145,943 69 $68,748 7 $52,940 APPLICATIONS WITHDRAWN 4 $75,408 73 $81,361 120 $94,375 19 $28,146 0 $0 12 $62,388 0 $0 FILES CLOSED FOR INCOMPLETENESS 1 $82,000 17 $111,392 20 $99,313 2 $37,070 0 $0 4 $51,035 0 $0
Aggregated Statistics For Year 2006(Based on 7 full and 18 partial tracts) A) FHA, FSA/RHS & VA B) Conventional C) Refinancings D) Home Improvement Loans E) Loans on Dwellings For 5+ Families F) Non-occupant Loans on G) Loans On Manufactured Number Average Value Number Average Value Number Average Value Number Average Value Number Average Value Number Average Value Number Average Value
LOANS ORIGINATED 56 $80,207 465 $84,277 178 $85,069 55 $34,167 2 $2,357,505 40 $59,448 9 $33,933 APPLICATIONS APPROVED, NOT ACCEPTED 7 $50,880 96 $89,598 48 $76,014 18 $25,371 1 $6,900,000 11 $54,410 2 $40,230 APPLICATIONS DENIED 18 $57,458 216 $77,302 330 $70,379 230 $23,800 0 $0 52 $41,411 8 $32,935 APPLICATIONS WITHDRAWN 12 $93,447 103 $90,425 151 $84,866 31 $35,508 2 $2,879,255 10 $66,614 0 $0 FILES CLOSED FOR INCOMPLETENESS 0 $0 26 $108,229 45 $99,311 2 $54,875 0 $0 5 $81,846 0 $0
Aggregated Statistics For Year 2005(Based on 7 full and 18 partial tracts) A) FHA, FSA/RHS & VA B) Conventional C) Refinancings D) Home Improvement Loans E) Loans on Dwellings For 5+ Families F) Non-occupant Loans on G) Loans On Manufactured Number Average Value Number Average Value Number Average Value Number Average Value Number Average Value Number Average Value Number Average Value
LOANS ORIGINATED 43 $70,611 357 $80,084 254 $76,733 92 $45,642 2 $453,150 61 $51,395 0 $0 APPLICATIONS APPROVED, NOT ACCEPTED 6 $74,577 68 $52,315 73 $56,589 18 $38,101 0 $0 14 $45,544 8 $66,845 APPLICATIONS DENIED 17 $49,145 154 $70,044 478 $64,590 184 $30,011 0 $0 45 $39,589 23 $35,794 APPLICATIONS WITHDRAWN 9 $64,602 113 $113,056 198 $114,987 88 $171,583 2 $8,501,400 26 $207,006 0 $0 FILES CLOSED FOR INCOMPLETENESS 5 $93,428 23 $60,615 37 $81,870 6 $41,825 0 $0 6 $44,887 0 $0
Aggregated Statistics For Year 2004(Based on 7 full and 18 partial tracts) A) FHA, FSA/RHS & VA B) Conventional C) Refinancings D) Home Improvement Loans E) Loans on Dwellings For 5+ Families F) Non-occupant Loans on G) Loans On Manufactured Number Average Value Number Average Value Number Average Value Number Average Value Number Average Value Number Average Value Number Average Value
LOANS ORIGINATED 65 $65,840 365 $75,008 381 $63,672 89 $36,783 6 $1,580,780 76 $43,800 1 $30,990 APPLICATIONS APPROVED, NOT ACCEPTED 3 $62,173 72 $68,587 73 $54,712 15 $34,792 0 $0 5 $69,402 5 $30,200 APPLICATIONS DENIED 8 $50,069 170 $56,423 596 $58,344 209 $29,233 0 $0 44 $30,187 22 $45,866 APPLICATIONS WITHDRAWN 10 $55,001 66 $59,637 219 $70,242 17 $24,975 0 $0 15 $39,770 0 $0 FILES CLOSED FOR INCOMPLETENESS 3 $61,667 14 $74,977 81 $75,408 5 $18,108 0 $0 7 $37,643 0 $0
Aggregated Statistics For Year 2003(Based on 7 full and 18 partial tracts) A) FHA, FSA/RHS & VA B) Conventional C) Refinancings D) Home Improvement Loans E) Loans on Dwellings For 5+ Families F) Non-occupant Loans on Number Average Value Number Average Value Number Average Value Number Average Value Number Average Value Number Average Value
LOANS ORIGINATED 74 $66,229 320 $76,733 552 $72,246 79 $20,561 2 $178,420 69 $47,774 APPLICATIONS APPROVED, NOT ACCEPTED 1 $63,000 50 $58,656 121 $53,434 14 $18,742 0 $0 17 $48,944 APPLICATIONS DENIED 4 $36,392 115 $47,036 576 $60,265 131 $19,603 0 $0 60 $42,081 APPLICATIONS WITHDRAWN 12 $62,722 62 $49,142 207 $59,882 6 $11,902 0 $0 13 $50,375 FILES CLOSED FOR INCOMPLETENESS 2 $87,185 19 $55,157 15 $57,485 1 $15,000 0 $0 2 $55,740
Aggregated Statistics For Year 2002(Based on 7 full and 18 partial tracts) A) FHA, FSA/RHS & VA B) Conventional C) Refinancings D) Home Improvement Loans E) Loans on Dwellings For 5+ Families F) Non-occupant Loans on Number Average Value Number Average Value Number Average Value Number Average Value Number Average Value Number Average Value
LOANS ORIGINATED 68 $57,897 272 $75,843 254 $67,095 55 $32,719 10 $577,024 30 $47,456 APPLICATIONS APPROVED, NOT ACCEPTED 1 $56,000 47 $88,621 96 $56,031 12 $10,057 0 $0 4 $37,060 APPLICATIONS DENIED 4 $57,712 143 $62,218 289 $46,060 107 $14,230 1 $638,000 38 $31,265 APPLICATIONS WITHDRAWN 6 $46,725 51 $79,325 142 $55,241 9 $23,006 2 $48,430 7 $33,193 FILES CLOSED FOR INCOMPLETENESS 7 $48,830 25 $49,482 67 $68,108 2 $13,595 0 $0 0 $0
Aggregated Statistics For Year 2001(Based on 7 full and 18 partial tracts) A) FHA, FSA/RHS & VA B) Conventional C) Refinancings D) Home Improvement Loans E) Loans on Dwellings For 5+ Families F) Non-occupant Loans on Number Average Value Number Average Value Number Average Value Number Average Value Number Average Value Number Average Value
LOANS ORIGINATED 82 $65,949 271 $69,826 214 $53,911 61 $14,564 6 $962,867 20 $41,951 APPLICATIONS APPROVED, NOT ACCEPTED 15 $48,024 40 $62,258 71 $52,680 13 $19,992 0 $0 7 $17,481 APPLICATIONS DENIED 13 $42,345 117 $57,645 246 $43,226 99 $16,658 0 $0 24 $36,098 APPLICATIONS WITHDRAWN 18 $44,751 38 $67,636 167 $46,350 3 $8,840 2 $803,470 5 $72,134 FILES CLOSED FOR INCOMPLETENESS 3 $61,740 24 $52,122 18 $41,282 0 $0 0 $0 3 $18,527
Aggregated Statistics For Year 2000(Based on 7 full and 18 partial tracts) A) FHA, FSA/RHS & VA B) Conventional C) Refinancings D) Home Improvement Loans E) Loans on Dwellings For 5+ Families F) Non-occupant Loans on Number Average Value Number Average Value Number Average Value Number Average Value Number Average Value Number Average Value
LOANS ORIGINATED 64 $57,231 314 $60,276 158 $39,010 72 $17,568 4 $173,902 42 $41,948 APPLICATIONS APPROVED, NOT ACCEPTED 3 $36,793 37 $53,088 66 $32,945 31 $17,592 0 $0 6 $27,620 APPLICATIONS DENIED 14 $69,027 146 $43,008 194 $32,946 99 $12,032 0 $0 31 $24,651 APPLICATIONS WITHDRAWN 13 $49,738 63 $54,810 127 $41,011 9 $31,468 0 $0 4 $28,142 FILES CLOSED FOR INCOMPLETENESS 2 $54,995 38 $54,153 51 $40,178 3 $36,000 0 $0 4 $30,008
Aggregated Statistics For Year 1999(Based on 5 full and 9 partial tracts) A) FHA, FSA/RHS & VA B) Conventional C) Refinancings D) Home Improvement Loans E) Loans on Dwellings For 5+ Families F) Non-occupant Loans on Number Average Value Number Average Value Number Average Value Number Average Value Number Average Value Number Average Value
LOANS ORIGINATED 31 $59,214 195 $54,379 137 $44,987 43 $15,680 1 $146,560 26 $38,119 APPLICATIONS APPROVED, NOT ACCEPTED 3 $49,863 22 $42,210 35 $34,650 25 $19,344 1 $58,340 4 $25,782 APPLICATIONS DENIED 9 $44,000 99 $41,953 88 $31,283 89 $22,356 0 $0 15 $22,928 APPLICATIONS WITHDRAWN 5 $52,662 32 $54,156 68 $39,405 9 $15,726 1 $9,910 9 $47,798 FILES CLOSED FOR INCOMPLETENESS 1 $57,860 13 $46,429 20 $57,747 0 $0 0 $0 3 $34,580
Private Mortgage Insurance Companies Aggregated Statistics For Year 2009(Based on 5 full and 10 partial tracts) A) Conventional B) Refinancings C) Non-occupant Loans on Number Average Value Number Average Value Number Average Value
LOANS ORIGINATED 21 $109,385 3 $111,497 0 $0 APPLICATIONS APPROVED, NOT ACCEPTED 7 $92,319 5 $218,632 0 $0 APPLICATIONS DENIED 6 $91,520 2 $298,270 2 $43,450 APPLICATIONS WITHDRAWN 1 $142,600 0 $0 0 $0 FILES CLOSED FOR INCOMPLETENESS 2 $73,680 2 $165,915 0 $0
Aggregated Statistics For Year 2008(Based on 5 full and 18 partial tracts) A) Conventional B) Refinancings C) Non-occupant Loans on Number Average Value Number Average Value Number Average Value
LOANS ORIGINATED 87 $114,063 14 $207,061 9 $103,058 APPLICATIONS APPROVED, NOT ACCEPTED 25 $109,487 5 $210,400 3 $119,303 APPLICATIONS DENIED 4 $73,680 0 $0 0 $0 APPLICATIONS WITHDRAWN 3 $119,227 0 $0 0 $0 FILES CLOSED FOR INCOMPLETENESS 2 $94,255 0 $0 2 $94,255
Aggregated Statistics For Year 2007(Based on 7 full and 18 partial tracts) A) Conventional B) Refinancings C) Non-occupant Loans on Number Average Value Number Average Value Number Average Value
LOANS ORIGINATED 199 $98,219 2 $285,905 16 $71,311 APPLICATIONS APPROVED, NOT ACCEPTED 37 $105,179 1 $243,000 1 $98,000 APPLICATIONS DENIED 5 $92,186 0 $0 0 $0 APPLICATIONS WITHDRAWN 13 $106,165 2 $93,210 0 $0 FILES CLOSED FOR INCOMPLETENESS 0 $0 0 $0 0 $0
Aggregated Statistics For Year 2006(Based on 7 full and 18 partial tracts) A) Conventional B) Refinancings C) Non-occupant Loans on Number Average Value Number Average Value Number Average Value
LOANS ORIGINATED 171 $82,918 3 $208,940 11 $71,989 APPLICATIONS APPROVED, NOT ACCEPTED 20 $83,072 3 $222,903 0 $0 APPLICATIONS DENIED 0 $0 0 $0 0 $0 APPLICATIONS WITHDRAWN 11 $117,205 0 $0 0 $0 FILES CLOSED FOR INCOMPLETENESS 0 $0 0 $0 0 $0
Aggregated Statistics For Year 2005(Based on 7 full and 18 partial tracts) A) Conventional B) Refinancings C) Non-occupant Loans on Number Average Value Number Average Value Number Average Value
LOANS ORIGINATED 101 $91,276 17 $152,784 17 $65,242 APPLICATIONS APPROVED, NOT ACCEPTED 20 $70,875 9 $215,481 8 $36,545 APPLICATIONS DENIED 2 $46,340 0 $0 0 $0 APPLICATIONS WITHDRAWN 2 $29,500 3 $117,673 0 $0 FILES CLOSED FOR INCOMPLETENESS 1 $50,000 0 $0 1 $50,000
Aggregated Statistics For Year 2004(Based on 5 full and 18 partial tracts) A) Conventional B) Refinancings C) Non-occupant Loans on Number Average Value Number Average Value Number Average Value
LOANS ORIGINATED 102 $75,890 31 $130,862 11 $65,901 APPLICATIONS APPROVED, NOT ACCEPTED 17 $50,486 11 $101,511 7 $38,614 APPLICATIONS DENIED 4 $51,548 0 $0 0 $0 APPLICATIONS WITHDRAWN 1 $63,000 2 $124,635 0 $0 FILES CLOSED FOR INCOMPLETENESS 0 $0 0 $0 0 $0
Aggregated Statistics For Year 2003(Based on 7 full and 18 partial tracts) A) Conventional B) Refinancings C) Non-occupant Loans on Number Average Value Number Average Value Number Average Value
LOANS ORIGINATED 101 $76,008 49 $123,680 15 $51,723 APPLICATIONS APPROVED, NOT ACCEPTED 16 $51,701 10 $92,230 4 $48,705 APPLICATIONS DENIED 0 $0 0 $0 0 $0 APPLICATIONS WITHDRAWN 4 $50,668 1 $185,480 2 $69,855 FILES CLOSED FOR INCOMPLETENESS 1 $57,000 0 $0 0 $0
Aggregated Statistics For Year 2002(Based on 5 full and 18 partial tracts) A) Conventional B) Refinancings C) Non-occupant Loans on Number Average Value Number Average Value Number Average Value
LOANS ORIGINATED 115 $87,747 30 $145,221 8 $50,318 APPLICATIONS APPROVED, NOT ACCEPTED 15 $80,535 5 $142,508 0 $0 APPLICATIONS DENIED 0 $0 0 $0 0 $0 APPLICATIONS WITHDRAWN 6 $169,053 4 $152,258 2 $135,945 FILES CLOSED FOR INCOMPLETENESS 0 $0 0 $0 0 $0
Aggregated Statistics For Year 2001(Based on 7 full and 18 partial tracts) A) Conventional B) Refinancings C) Non-occupant Loans on Number Average Value Number Average Value Number Average Value
LOANS ORIGINATED 119 $77,382 22 $133,225 3 $49,483 APPLICATIONS APPROVED, NOT ACCEPTED 8 $65,849 11 $127,855 2 $27,240 APPLICATIONS DENIED 5 $39,984 0 $0 0 $0 APPLICATIONS WITHDRAWN 7 $91,611 0 $0 0 $0 FILES CLOSED FOR INCOMPLETENESS 0 $0 0 $0 0 $0
Aggregated Statistics For Year 2000(Based on 7 full and 16 partial tracts) A) Conventional B) Refinancings C) Non-occupant Loans on Number Average Value Number Average Value Number Average Value
LOANS ORIGINATED 144 $70,400 15 $75,292 7 $33,440 APPLICATIONS APPROVED, NOT ACCEPTED 13 $60,072 2 $182,530 0 $0 APPLICATIONS DENIED 3 $60,973 0 $0 0 $0 APPLICATIONS WITHDRAWN 1 $85,000 0 $0 0 $0 FILES CLOSED FOR INCOMPLETENESS 0 $0 0 $0 0 $0
Aggregated Statistics For Year 1999(Based on 4 full and 8 partial tracts) A) Conventional B) Refinancings C) Non-occupant Loans on Number Average Value Number Average Value Number Average Value
LOANS ORIGINATED 66 $65,311 8 $90,679 2 $66,835 APPLICATIONS APPROVED, NOT ACCEPTED 7 $70,476 3 $59,257 2 $47,915 APPLICATIONS DENIED 6 $57,327 0 $0 0 $0 APPLICATIONS WITHDRAWN 1 $43,020 0 $0 0 $0 FILES CLOSED FOR INCOMPLETENESS 2 $103,000 0 $0 0 $0
2003 - 2018 National Fire Incident Reporting System (NFIRS) incidents See full 2006 National Fire Incident Reporting System statistics for zip code 77642, Texas
Most common first names in zip code 77642 among deceased individuals Name Count Lived (average)
Mary 184 78.8 years James 132 73.5 years John 118 77.5 years William 93 75.4 years Robert 82 73.2 years Joseph 77 75.8 years Charles 72 73.4 years Helen 59 80.5 years Dorothy 55 76.7 years Mildred 50 80.5 years
Most common last names in zip code 77642 among deceased individuals Last name Count Lived (average)
Jones 56 76.6 years Hebert 54 77.3 years Williams 54 75.2 years Broussard 52 78.2 years Smith 50 76.5 years Johnson 47 71.3 years Landry 45 79.5 years Guidry 42 78.0 years Brown 38 76.8 years Leblanc 36 79.2 years
Businesses in zip code 77642
Name Count Name Count
AT&T 1 Pac Sun 1 Advance Auto Parts 1 Payless 1 Applebee's 1 Pizza Hut 1 AutoZone 1 Popeyes 1 Bath & Body Works 1 Quiznos 1 Bed Bath & Beyond 1 RadioShack 2 Burger King 1 Rue21 1 CVS 2 SONIC Drive-In 1 Carl\s Jr. 1 Sears 2 Church's Chicken 1 Spencer Gifts 1 Cricket Wireless 2 Sprint Nextel 1 Curves 1 Starbucks 1 Econo Lodge 1 Studio 6 1 FedEx 5 Subway 4 Finish Line 1 Super 8 1 GameStop 1 T-Mobile 1 H&R Block 1 Target 1 Holiday Inn 2 U-Haul 1 JCPenney 1 UPS 3 Journeys 1 Vans 1 KFC 2 Waffle House 1 Lane Furniture 1 Walgreens 2 Little Caesars Pizza 1 Walmart 1 McDonald's 2 World Gym 1 Motel 6 1 YMCA 1 Nike 4
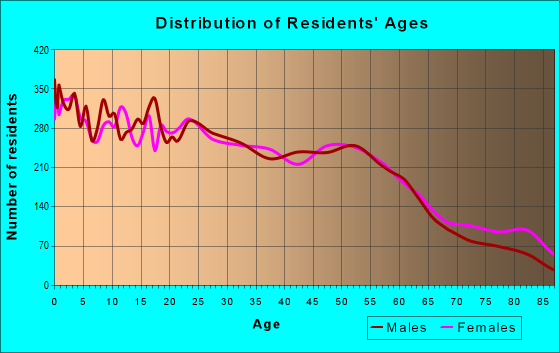
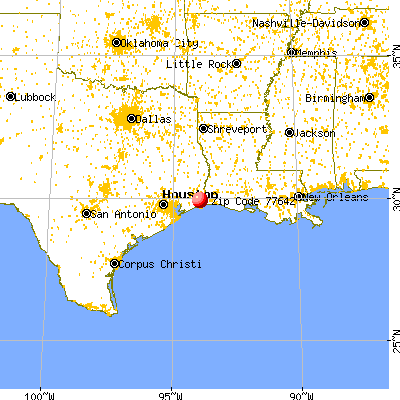

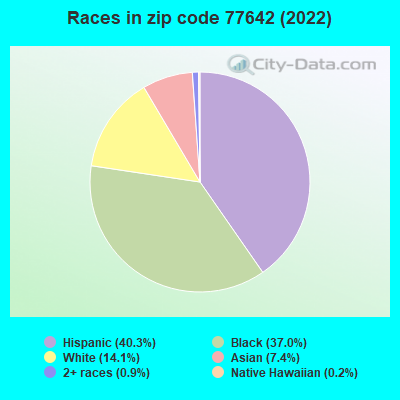


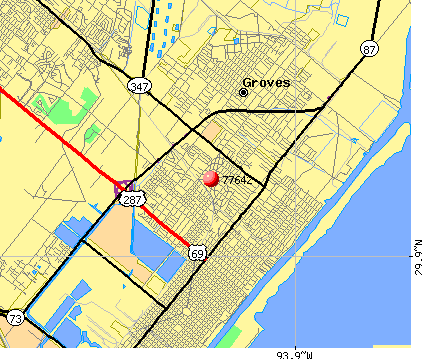 Nearest zip codes: 77619, 77651, 77611, 77640, 77630, 77627.
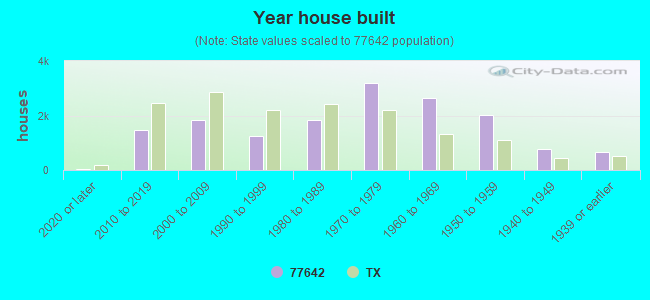

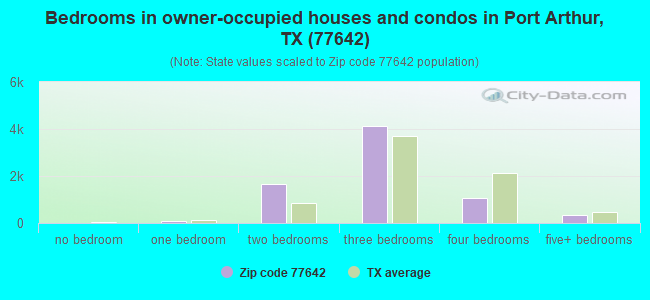
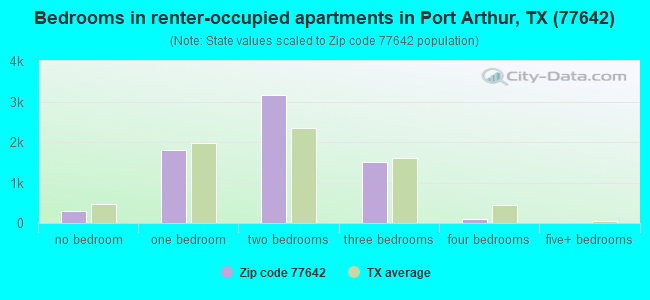
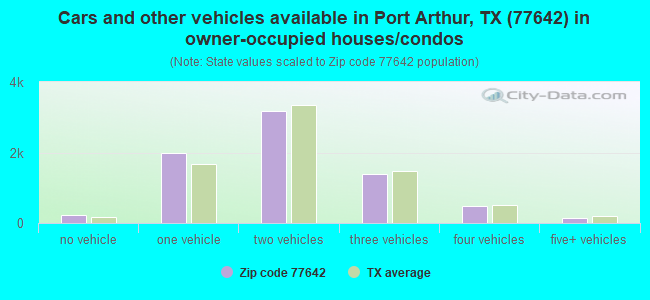
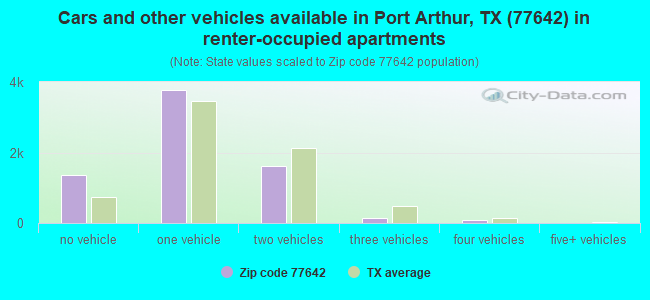


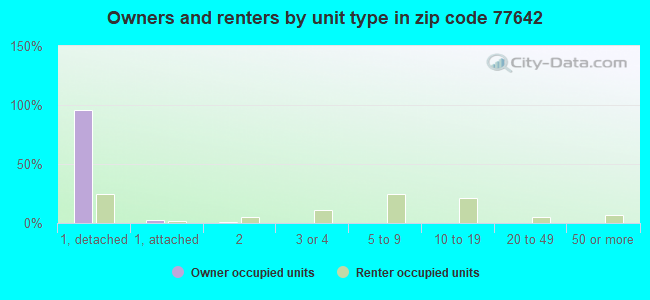
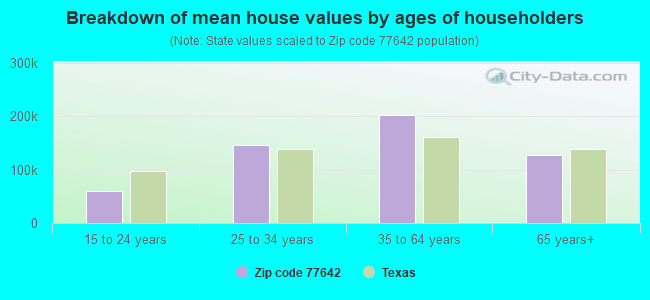


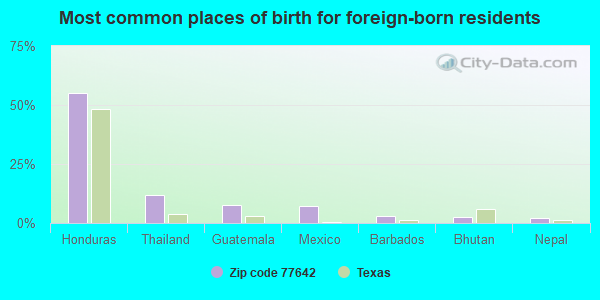
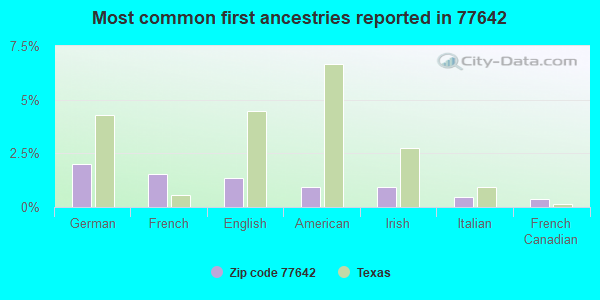
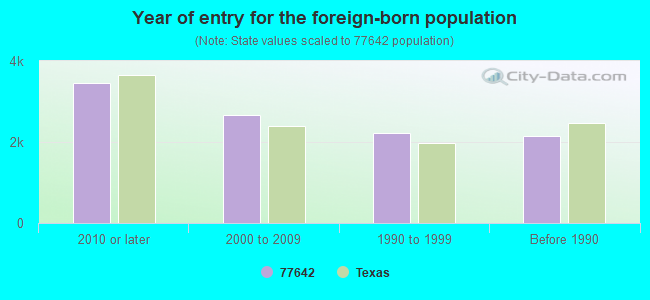


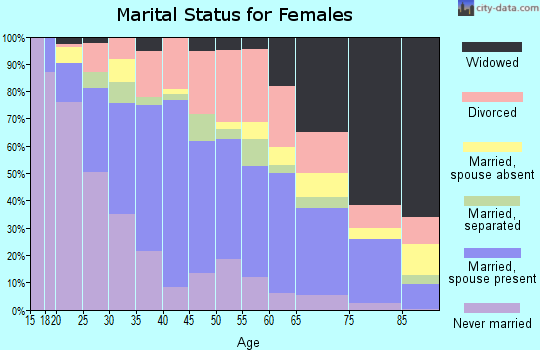
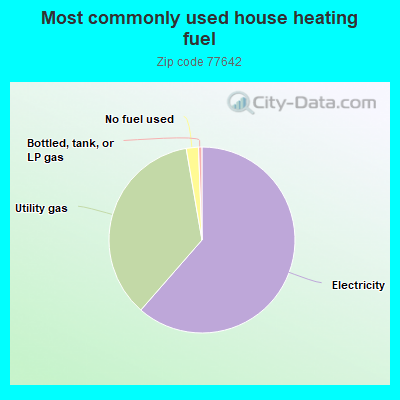
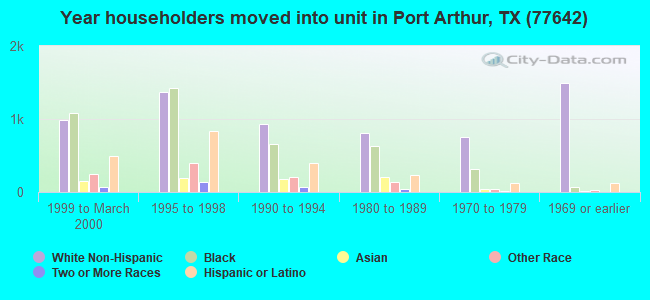
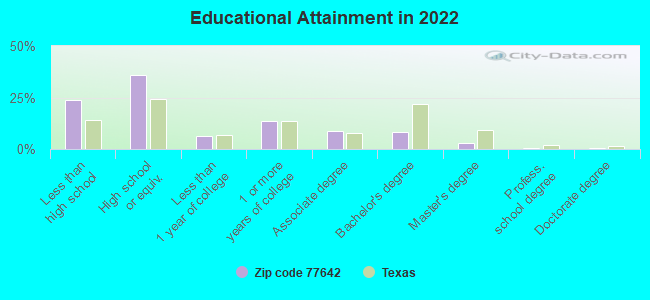
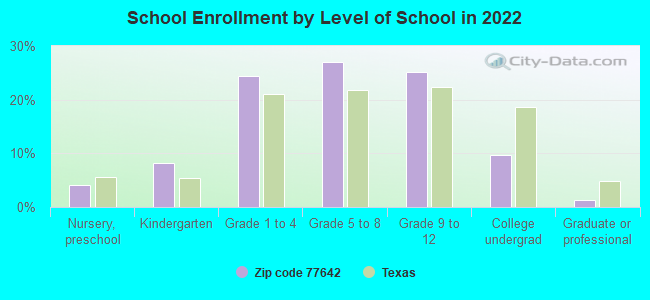
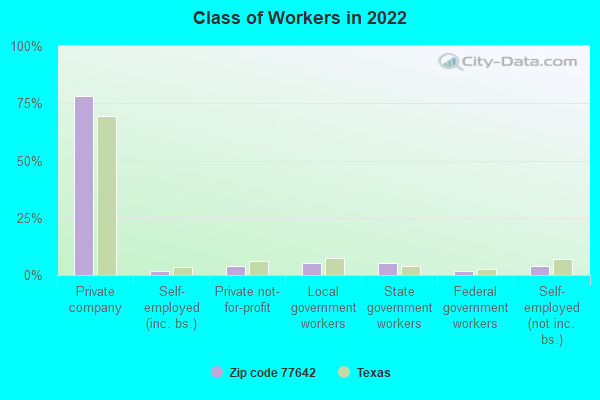
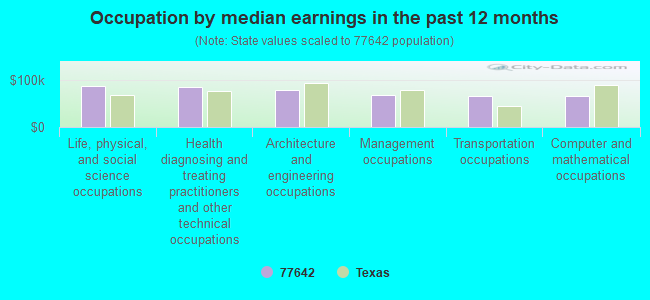
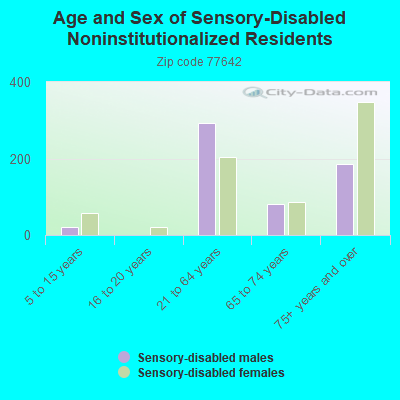
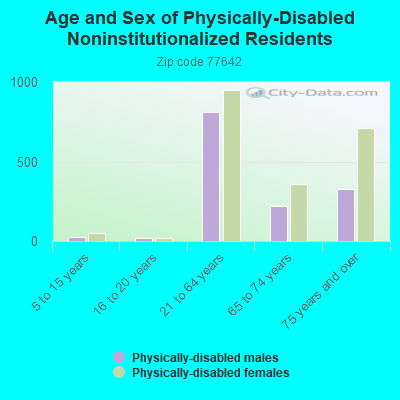
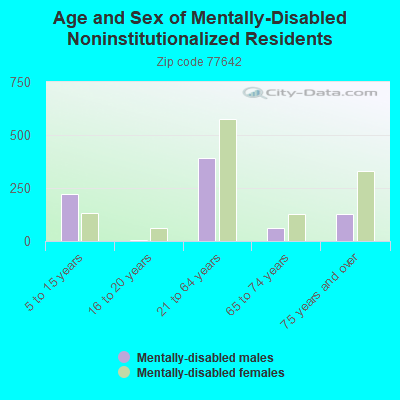
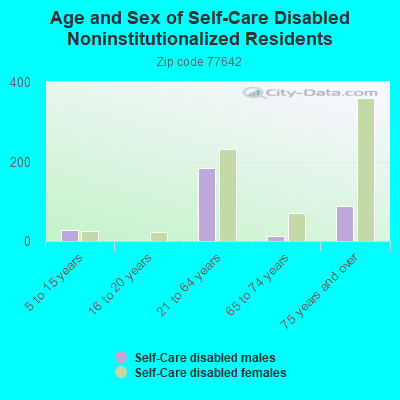
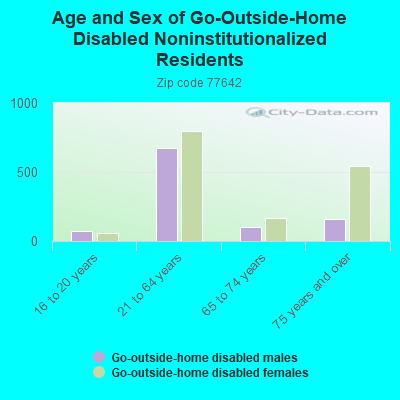
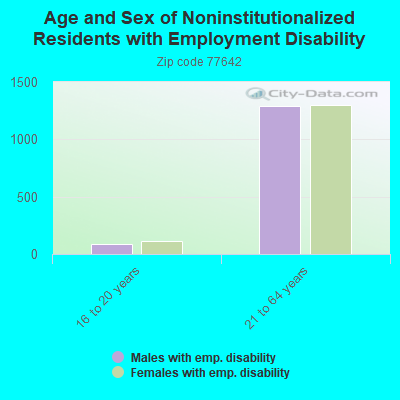
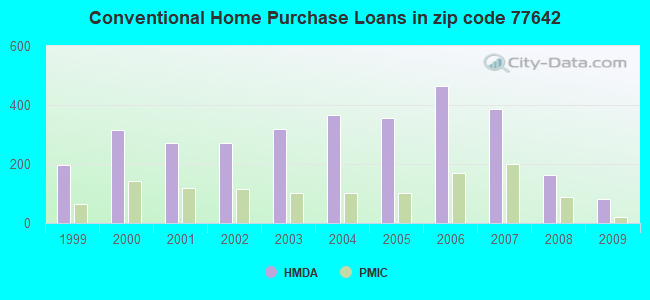
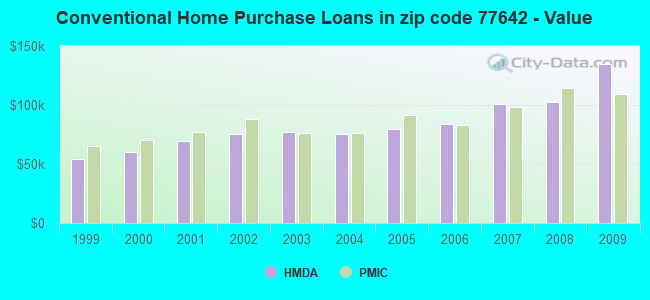
 Based on the data from the years 2003 - 2018 the average number of fires per year is 133. The highest number of fires - 236 took place in 2011, and the least - 14 in 2006. The data has an increasing trend.
 When looking into fire subcategories, the most incidents belonged to: Outside Fires (43.4%), and Structure Fires (35.2%).