Estimated zip code population in 2022: 4,286 Zip code population in 2010: 3,386 Zip code population in 2000: 2,383
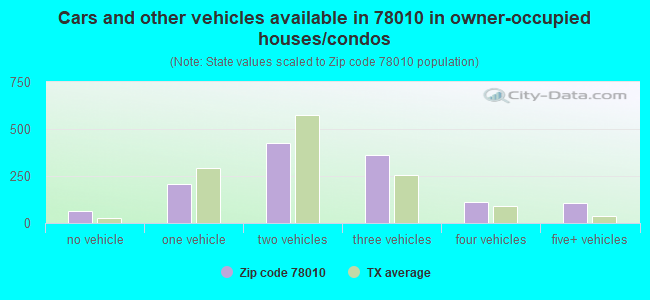
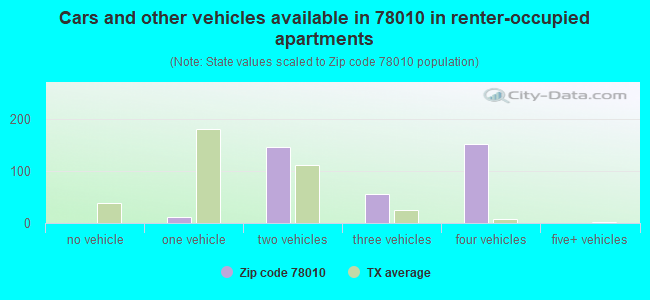
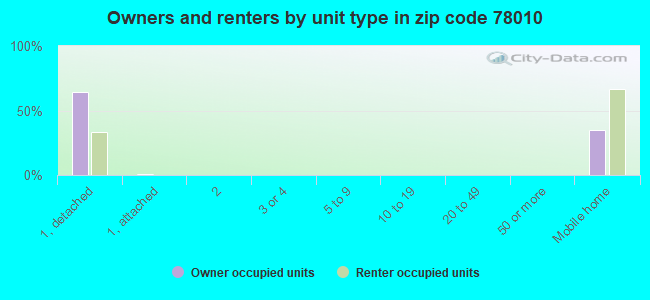
Houses and condos: 1,904 Renter-occupied apartments: 372
% of renters here:
23%
State:
38%
March 2022 cost of living index in zip code 78010: 78.3 (low, U.S. average is 100)
Land area: 73.3 sq. mi. Water area: 0.4 sq. mi.
Population density: 58 people per square mile
(very low).
OSM Map
General Map
Google Map
MSN Map
OSM Map
General Map
Google Map
MSN Map
OSM Map
General Map
Google Map
MSN Map
OSM Map
General Map
Google Map
MSN Map
Please wait while loading the map...
Real estate property taxes paid for housing units in 2022:
This zip code:
0.9% ($2,422)
Texas:
1.5% ($4,050)
Median real estate property taxes paid for housing units with mortgages in 2022: $2,281 (1.1%) Median real estate property taxes paid for housing units with no mortgage in 2022: $2,574 (0.8%)
Business Search- 14 Million verified businesses
Males: 2,392
(55.8%)
Females: 1,894
(44.2%)
For population 25 years and over in 78010:
High school or higher: 81.4%
Bachelor's degree or higher: 24.3%
Graduate or professional degree: 7.8%
Unemployed: 4.8%
Mean travel time to work (commute): 26.4 minutes
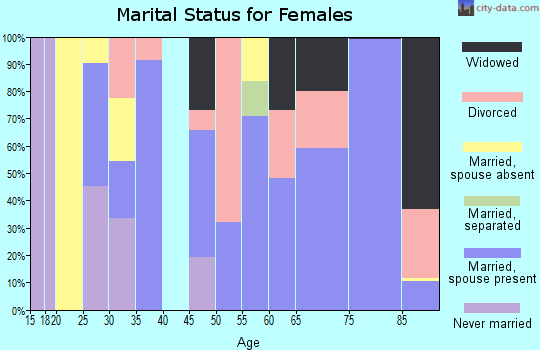
For population 15 years and over in 78010:
Never married: 23.2%
Now married: 51.3%
Separated: 0.0%
Widowed: 5.0%
Divorced: 20.6%
Zip code 78010 compared to state average:
Black race population percentage significantly below state average.
Median age significantly above state average.
Renting percentage below state average.
Length of stay since moving in significantly above state average.
Number of college students significantly below state average.
Averages for the 2020 tax year for zip code 78010, filed in 2021:
Average Adjusted Gross Income (AGI) in 2020: $61,401 (Individual Income Tax Returns)
Here:
$61,401
State:
$77,054
Salary/wage: $47,577 (reported on 72.2% of returns)
Here:
$47,577
State:
$62,766
(% of AGI for various income ranges: 1117.4% for AGIs below $25k, 3563.0% for AGIs $25k-50k, 6447.5% for AGIs $50k-75k, 8247.8% for AGIs $75k-100k, 12145.8% for AGIs $100k-200k)
Taxable interest for individuals: $2,130 (reported on 29.1% of returns)
This zip code:
$2,130
Texas:
$2,665
(% of AGI for various income ranges: 17.9% for AGIs below $25k, 10.7% for AGIs $25k-50k, 94.2% for AGIs $50k-75k, 33.3% for AGIs $75k-100k, 221.7% for AGIs $100k-200k)
Ordinary dividends: $17,132 (reported on 14.6% of returns)
Here:
$17,132
State:
$10,044
(% of AGI for various income ranges: 16.8% for AGIs below $25k, 9.6% for AGIs $25k-50k, 154.2% for AGIs $50k-75k, 105.6% for AGIs $75k-100k, 500.8% for AGIs $100k-200k)
Net capital gain/loss in AGI: +$22,665 (reported on 15.2% of returns)
Here:
+$22,665
State:
+$39,590
(% of AGI for various income ranges: 0.5% for AGIs below $25k, 24.8% for AGIs $25k-50k, 134.2% for AGIs $50k-75k, 242.2% for AGIs $75k-100k, 818.3% for AGIs $100k-200k)
Profit/loss from business: +$11,162 (reported on 29.8% of returns)
Here:
+$11,162
State:
+$10,888
(% of AGI for various income ranges: 391.6% for AGIs below $25k, 502.6% for AGIs $25k-50k, 566.7% for AGIs $50k-75k, 201.1% for AGIs $75k-100k, 932.5% for AGIs $100k-200k)
Taxable individual retirement arrangement distribution: $33,379 (reported on 9.3% of returns)
78010:
$33,379
Texas:
$24,740
(% of AGI for various income ranges: 55.0% for AGIs below $25k, 140.4% for AGIs $25k-50k, 578.9% for AGIs $75k-100k, 2970.0% for AGIs $100k-200k)
Total itemized deductions: $34,500 (reported on 5.3% of returns)
Here:
$34,500
State:
$40,428
(% of AGI for various income ranges: 520.8% for AGIs $50k-75k, 855.0% for AGIs $100k-200k)
Charity contributions: $14,817 (reported on 4.0% of returns)
Here:
$14,817
State:
$18,201
(% of AGI for various income ranges: 254.2% for AGIs $100k-200k)
Taxes paid: $6,178 (reported on 6.0% of returns)
78010:
$6,178
State:
$7,821
(% of AGI for various income ranges: 117.5% for AGIs $50k-75k, 160.8% for AGIs $100k-200k)
Earned income credit: $2,525 (reported on 21.2% of returns)
Here:
$2,525
State:
$2,584
(% of AGI for various income ranges: 135.5% for AGIs below $25k, 108.5% for AGIs $25k-50k)
Percentage of individuals using paid preparers for their 2020 taxes: 92.1%
Here:
92%
State:
92%
(% for various income ranges: 89.7% for AGIs below $25k, 94.6% for AGIs $25k-50k, 89.5% for AGIs $50k-75k, 100.0% for AGIs $75k-100k, 88.9% for AGIs $100k-200k, 100.0% for AGIs over 200k)
Averages for the 2012 tax year for zip code 78010, filed in 2013:
Average Adjusted Gross Income (AGI) in 2012: $51,164 (Individual Income Tax Returns)
Here:
$51,164
State:
$65,384
Salary/wage: $42,018 (reported on 76.1% of returns)
Here:
$42,018
State:
$52,524
(% of AGI for various income ranges: 74.3% for AGIs below $25k, 72.2% for AGIs $25k-50k, 67.8% for AGIs $50k-75k, 68.1% for AGIs $75k-100k, 64.1% for AGIs $100k-200k, 43.5% for AGIs over 200k)
Taxable interest for individuals: $2,554 (reported on 29.7% of returns)
This zip code:
$2,554
Texas:
$2,372
(% of AGI for various income ranges: 0.9% for AGIs below $25k, 0.8% for AGIs $25k-50k, 0.5% for AGIs $50k-75k, 0.7% for AGIs $75k-100k, 1.8% for AGIs $100k-200k, 2.9% for AGIs over 200k)
Ordinary dividends: $6,742 (reported on 17.4% of returns)
Here:
$6,742
State:
$9,721
(% of AGI for various income ranges: 1.0% for AGIs below $25k, 1.0% for AGIs $25k-50k, 1.9% for AGIs $50k-75k, 1.8% for AGIs $75k-100k, 2.6% for AGIs $100k-200k, 4.0% for AGIs over 200k)
Net capital gain/loss in AGI: +$14,132 (reported on 13.8% of returns)
Here:
+$14,132
State:
+$35,319
(% of AGI for various income ranges: 0.2% for AGIs below $25k, 0.5% for AGIs $50k-75k, 1.2% for AGIs $75k-100k, 4.4% for AGIs $100k-200k, 11.1% for AGIs over 200k)
Profit/loss from business: +$10,844 (reported on 24.6% of returns)
Here:
+$10,844
State:
+$13,732
(% of AGI for various income ranges: 13.1% for AGIs below $25k, 8.1% for AGIs $25k-50k, 3.1% for AGIs $50k-75k, 2.2% for AGIs $75k-100k, 8.9% for AGIs $100k-200k)
Taxable individual retirement arrangement distribution: $15,631 (reported on 9.4% of returns)
78010:
$15,631
Texas:
$19,511
(% of AGI for various income ranges: 1.1% for AGIs below $25k, 2.0% for AGIs $25k-50k, 1.8% for AGIs $50k-75k, 4.7% for AGIs $75k-100k, 8.3% for AGIs $100k-200k)
Total itemized deductions: $24,800 (18% of AGI, reported on 17.4% of returns)
Here:
$24,800
State:
$24,724
Here:
18.5% of AGI
State:
15.9% of AGI
(% of AGI for various income ranges: 8.2% for AGIs $25k-50k, 8.6% for AGIs $50k-75k, 8.8% for AGIs $75k-100k, 13.3% for AGIs $100k-200k, 8.6% for AGIs over 200k)
Charity contributions: $5,778 (reported on 13.0% of returns)
Here:
$5,778
State:
$6,808
(% of AGI for various income ranges: 0.8% for AGIs $25k-50k, 1.0% for AGIs $50k-75k, 1.1% for AGIs $75k-100k, 2.3% for AGIs $100k-200k, 2.4% for AGIs over 200k)
Taxes paid: $5,388 (reported on 17.4% of returns)
78010:
$5,388
State:
$6,921
(% of AGI for various income ranges: 1.5% for AGIs $25k-50k, 1.5% for AGIs $50k-75k, 1.9% for AGIs $75k-100k, 3.4% for AGIs $100k-200k, 1.9% for AGIs over 200k)
Earned income credit: $2,426 (reported on 24.6% of returns)
Here:
$2,426
State:
$2,570
(% of AGI for various income ranges: 8.1% for AGIs below $25k, 1.5% for AGIs $25k-50k)
Percentage of individuals using paid preparers for their 2012 taxes: 55.1%
Here:
55%
State:
51%
(% for various income ranges: 54.0% for AGIs below $25k, 52.9% for AGIs $25k-50k, 52.9% for AGIs $50k-75k, 54.5% for AGIs $75k-100k, 60.0% for AGIs $100k-200k, 100.0% for AGIs over 200k)
Averages for the 2004 tax year for zip code 78010, filed in 2005:
Average Adjusted Gross Income (AGI) in 2004: $36,546 (Individual Income Tax Returns)
Here:
$36,546
State:
$47,881
Salary/wage: $31,173 (reported on 76.4% of returns)
Here:
$31,173
State:
$41,947
(% of AGI for various income ranges: 97.4% for AGIs below $10k, 70.4% for AGIs $10k-25k, 73.3% for AGIs $25k-50k, 66.9% for AGIs $50k-75k, 69.7% for AGIs $75k-100k, 49.5% for AGIs over 100k)
Taxable interest for individuals: $2,591 (reported on 33.8% of returns)
This zip code:
$2,591
Texas:
$2,255
(% of AGI for various income ranges: 7.2% for AGIs below $10k, 2.0% for AGIs $10k-25k, 1.6% for AGIs $25k-50k, 2.3% for AGIs $50k-75k, 2.3% for AGIs $75k-100k, 3.0% for AGIs over 100k)
Taxable dividends: $4,277 (reported on 19.1% of returns)
Here:
$4,277
State:
$4,261
(% of AGI for various income ranges: 1.9% for AGIs below $10k, 1.1% for AGIs $10k-25k, 0.8% for AGIs $25k-50k, 1.1% for AGIs $50k-75k, 2.9% for AGIs $75k-100k, 4.7% for AGIs over 100k)
Net capital gain/loss: +$12,782 (reported on 17.7% of returns)
Here:
+$12,782
State:
+$16,110
(% of AGI for various income ranges: -2.4% for AGIs below $10k, 1.7% for AGIs $10k-25k, -0.2% for AGIs $25k-50k, 0.5% for AGIs $50k-75k, 2.9% for AGIs $75k-100k, 20.0% for AGIs over 100k)
Profit/loss from business: +$7,836 (reported on 24.0% of returns)
Here:
+$7,836
State:
+$11,013
(% of AGI for various income ranges: 12.1% for AGIs below $10k, 13.0% for AGIs $10k-25k, 5.8% for AGIs $25k-50k, 3.5% for AGIs $50k-75k, 1.5% for AGIs $75k-100k, 2.5% for AGIs over 100k)
IRA payment deduction: $1,700 (reported on 1.6% of returns)
78010:
$1,700
Texas:
$3,120
Total itemized deductions: $17,070 (21% of AGI, reported on 16.2% of returns)
Here:
$17,070
State:
$19,631
Here:
21.4% of AGI
State:
18.9% of AGI
(% of AGI for various income ranges: 4.8% for AGIs $10k-25k, 6.7% for AGIs $25k-50k, 8.8% for AGIs $50k-75k, 10.0% for AGIs $75k-100k, 8.5% for AGIs over 100k)
Charity contributions deductions: $3,811 (4% of AGI, reported on 12.8% of returns)
Here:
$3,811
State:
$4,753
Here:
4.4% of AGI
State:
4.2% of AGI
(% of AGI for various income ranges: 0.4% for AGIs $10k-25k, 0.7% for AGIs $25k-50k, 1.2% for AGIs $50k-75k, 1.3% for AGIs $75k-100k, 2.6% for AGIs over 100k)
Total tax: $5,495 (reported on 70.3% of returns)
78010:
$5,495
State:
$9,058
(% of AGI for various income ranges: 4.3% for AGIs below $10k, 4.6% for AGIs $10k-25k, 6.5% for AGIs $25k-50k, 9.5% for AGIs $50k-75k, 11.1% for AGIs $75k-100k, 18.3% for AGIs over 100k)
Earned income credit: $2,007 (reported on 22.4% of returns)
Here:
$2,007
State:
$2,024
Percentage of individuals using paid preparers for their 2004 taxes: 62.3%
Here:
62%
State:
57%
(% for various income ranges: 55.0% for AGIs below $10k, 69.3% for AGIs $10k-25k, 59.4% for AGIs $25k-50k, 58.7% for AGIs $50k-75k, 59.6% for AGIs $75k-100k, 78.0% for AGIs over 100k)
Household received Food Stamps/SNAP in the past 12 months: 331 Household did not receive Food Stamps/SNAP in the past 12 months: 1,324
Women who had a birth in the past 12 months: 1 (0 now married, 0 unmarried) Women who did not have a birth in the past 12 months: 713 (259 now married, 455 unmarried)
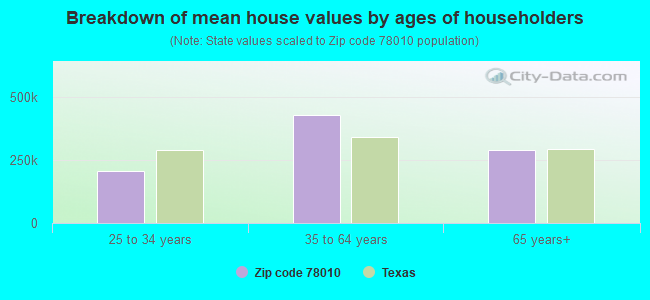
Housing units in zip code 78010 with a mortgage: 542 (65 second mortgage, 24 both second mortgage and home equity loan) Median monthly owner costs for units with a mortgage: $1,379 Median monthly owner costs for units without a mortgage: $528
Residents with income below the poverty level in 2022:
This zip code:
14.9%
Whole state:
14.0%
Residents with income below 50% of the poverty level in 2022:
This zip code:
7.2%
Whole state:
7.4%
Median number of rooms in houses and condos:
Here:
5.5
State:
6.3
Median number of rooms in apartments:
Here:
4.6
State:
4.0
Notable locations in this zip code not listed on our city pages
Notable locations in zip code 78010: Camp Christian (A), Old Camp Verde (B), Center Point Volunteer Fire Department (C), Elm Pass Volunteer Fire Department (D), Starlite Recovery Center (E). Display/hide their locations on the map
Creeks: Turtle Creek (A), Steel Creek (B), Palmer Creek (C), Spring Creek (D), Mico Creek (E), Elm Creek (F), Bluff Creek (G). Display/hide their locations on the map
In group quarters: 33 (-1 institutionalized population)
Size of family households: 543 2-persons, 205 3-persons, 181 4-persons, 203 5-persons, 53 6-persons, 11 7-or-more-persons
Size of nonfamily households: 301 1-person, 146 2-persons
339 married couples with children.
516 single-parent households (313 men, 203 women).
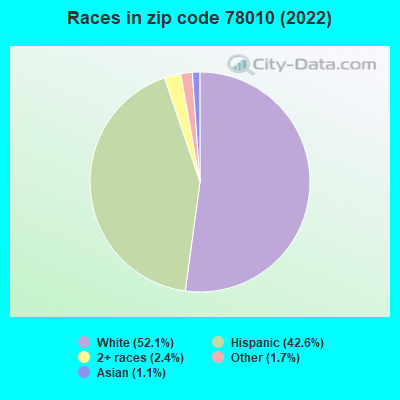
69.0% of residents of 78010 zip code speak English at home.
30.1% of residents speak Spanish at home (63% very well, 10% well, 24% not well, 3% not at all).
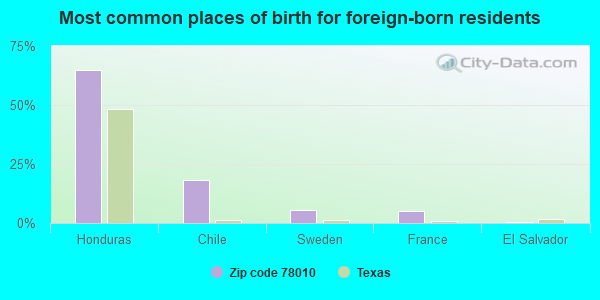
Foreign born population: 777 (18.1%) (67.4% of them are naturalized citizens)
This zip code:
18.1%
Whole state:
17.2%
65%Honduras
18%Chile
5%Sweden
5%France
1%El Salvador
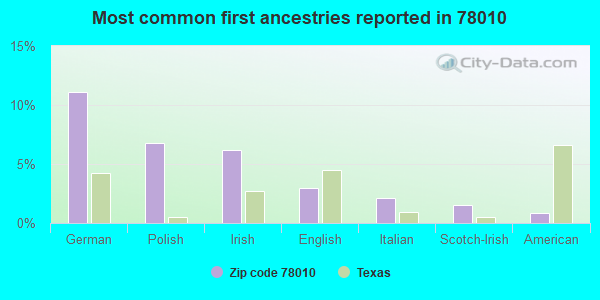
11%German
7%Polish
6%Irish
3%English
2%Italian
1%Scotch-Irish
1%American
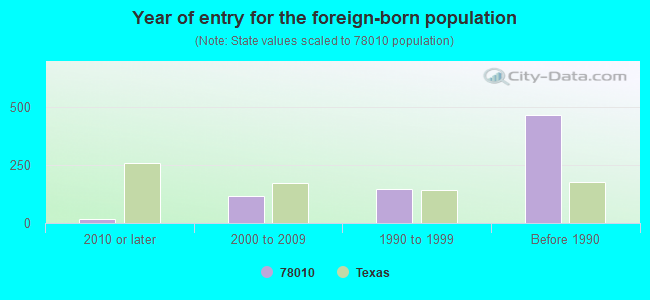
Year of entry for the foreign-born population
182010 or later
1182000 to 2009
1481990 to 1999
467Before 1990
Facilities with environmental interests located in this zip code:
AMERICAN TELEPHONE AND TELEGRAPH COMPANY (HIGHWAY 173 3 MI SW in CAMP VERDE, TX)
(Resource Conservation and Recovery Act (tracking hazardous waste)) Alternative names: AMERICAN TEL & TEL CO LONG LINES
Housing units lacking complete plumbing facilities: 6.2% Housing units lacking complete kitchen facilities: 7.4%
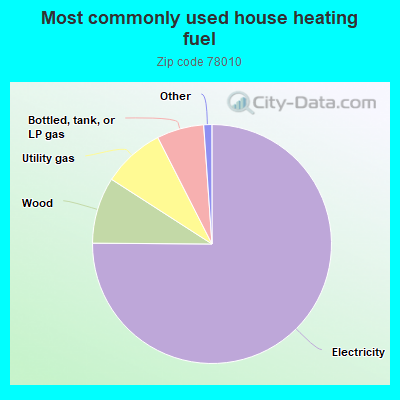
75.2%Electricity
9.0%Wood
8.4%Utility gas
6.4%Bottled, tank, or LP gas
0.6%No fuel used
0.5%Solar energy
Population in 1990: 2,704.
Place of birth for U.S.-born residents:
This state: 2,547
Northeast: 41
Midwest: 394
South: 155
West: 328
56% of the 78010 zip code residents lived in the same house 5 years ago. Out of people who lived in different houses, 44% lived in this county. Out of people who lived in different counties, 50% lived in Texas.
90% of the 78010 zip code residents lived in the same house 1 year ago. Out of people who lived in different houses, 15% moved from this county. Out of people who lived in different houses, 72% moved from different county within same state. Out of people who lived in different houses, 18% moved from different state.
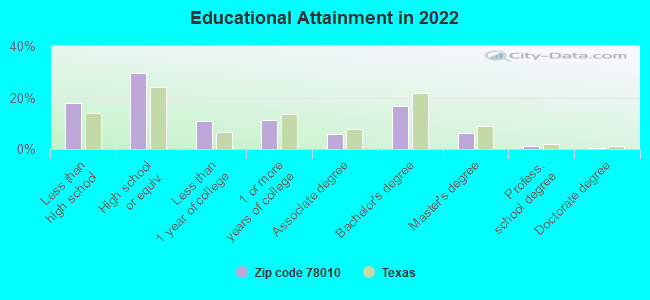
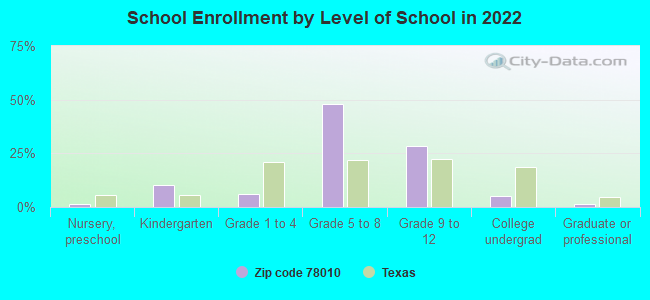
Private vs. public school enrollment:
Students in private schools in grades 1 to 8 (elementary and middle school): 12
Here:
3.2%
Texas:
8.8%
Students in private schools in grades 9 to 12 (high school): 30
Here:
14.3%
Texas:
8.0%
Students in private undergraduate colleges: 9
Here:
26.1%
Texas:
16.2%
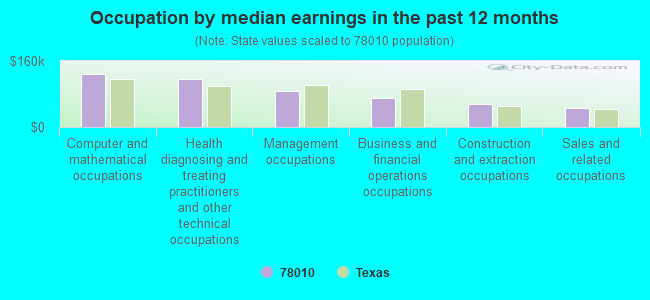
Occupation by median earnings in the past 12 months ($)
128,989Computer and mathematical occupations
115,451Health diagnosing and treating practitioners and other technical occupations
88,096Management occupations
69,379Business and financial operations occupations
55,995Construction and extraction occupations
46,343Sales and related occupations
Top industries in this zip code by the number of employees in 2005:
Accommodation and Food Services: Limited-Service Restaurants (20-49: 1)
Arts, Entertainment, and Recreation: Fitness and Recreational Sports Centers (20-49: 1)
Construction: Highway, Street, and Bridge Construction (20-49: 1)
Construction: All Other Specialty Trade Contractors (10-19: 1, 5-9: 1, 1-4: 3)
Mining: Crushed and Broken Limestone Mining and Quarrying (10-19: 1, 1-4: 1)
Other Services (except Public Administration): Commercial and Industrial Machinery and Equipment (except Automotive and Electronic) Repair and Maintenance (10-19: 1)
People in group quarters in 2010:
7 people in residential treatment centers for juveniles (non-correctional)
People in group quarters in 2000:
23 people in hospitals or wards for drug/alcohol abuse
Fatal accident statistics in 2014:
Fatal accident count: 1
Vehicles involved in fatal accidents: 1
Fatal accidents caused by drunken drivers: 0
Fatalities: 1
Persons involved in fatal accidents: 1
Pedestrians involved in fatal accidents: 0
Fatal accident statistics in 2013:
Fatal accident count: 1
Vehicles involved in fatal accidents: 3
Fatal accidents caused by drunken drivers: 1
Fatalities: 1
Persons involved in fatal accidents: 5
Pedestrians involved in fatal accidents: 0
Most common first names in zip code 78010 among deceased individuals
Name
Count
Lived (average)
William
21
71.9 years
James
20
71.6 years
Robert
17
72.9 years
John
13
76.8 years
Mary
13
81.7 years
Charles
12
71.2 years
George
10
78.9 years
Alfred
9
68.1 years
Carl
8
75.4 years
Dorothy
8
82.0 years
Most common last names in zip code 78010 among deceased individuals
Last name
Count
Lived (average)
Taylor
12
70.5 years
Smith
10
76.9 years
Lackey
8
71.6 years
Page
8
77.9 years
Rees
7
82.9 years
Anderson
6
78.5 years
Brown
6
80.0 years
Jones
6
74.3 years
Jeffers
5
69.2 years
Thomas
5
71.0 years
Discuss , Texas (TX) on our hugely popular Texas forum.


 Nearest zip codes: 78013, 78028, 78003, 78063, 78055, 78025.