Estimated zip code population in 2022: 79,013 Zip code population in 2010: 44,817 Zip code population in 2000: 1,391
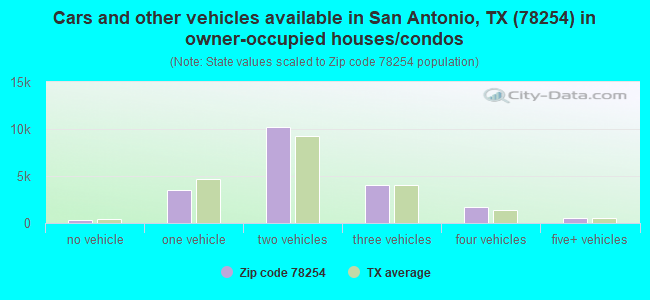
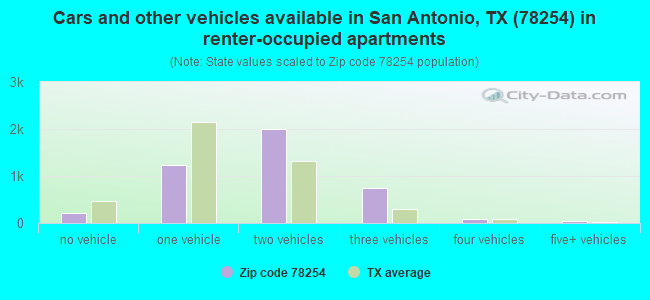
Houses and condos: 25,228 Renter-occupied apartments: 4,403
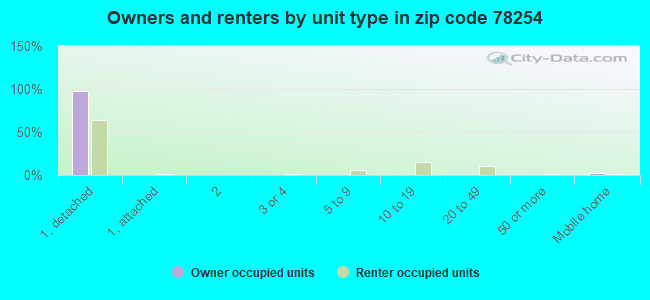
% of renters here:
18%
State:
38%
March 2022 cost of living index in zip code 78254: 88.4 (less than average, U.S. average is 100)
Land area: 27.1 sq. mi. Water area: 0.1 sq. mi.
Population density: 2,919 people per square mile
(average).
OSM Map
General Map
Google Map
MSN Map
OSM Map
General Map
Google Map
MSN Map
OSM Map
General Map
Google Map
MSN Map
OSM Map
General Map
Google Map
MSN Map
Please wait while loading the map...
Real estate property taxes paid for housing units in 2022:
This zip code:
1.8% ($5,681)
Texas:
1.5% ($4,050)
Median real estate property taxes paid for housing units with mortgages in 2022: $5,854 (1.8%) Median real estate property taxes paid for housing units with no mortgage in 2022: $5,287 (1.8%)
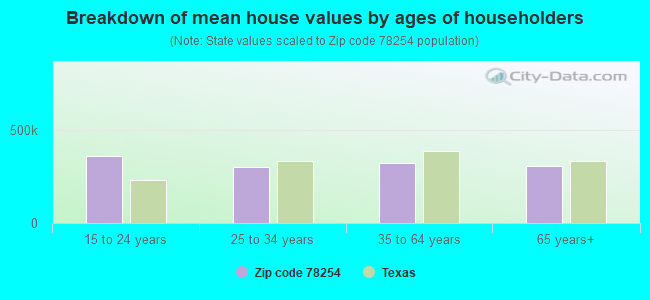
Estimated median house/condo value in 2022: $314,396
78254:
$314,396
Texas:
$275,400
According to our research of Texas and other state lists, there were 58 registered sex offenders living in 78254 zip code as of April 19, 2024. The ratio of all residents to sex offenders in zip code 78254 is 912 to 1. The ratio of registered sex offenders to all residents in this zip code is lower than the state average.
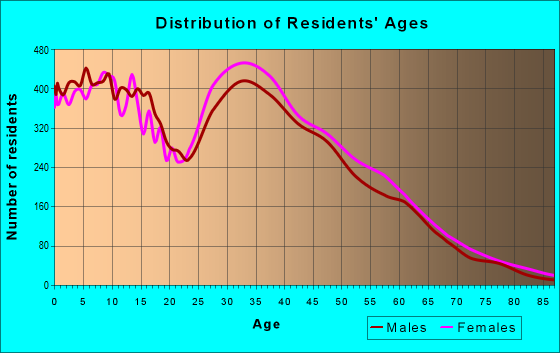
Median resident age:
This zip code:
32.3 years
Texas median age:
35.6 years
Average household size:
This zip code:
3.2 people
Texas:
2.6 people
Averages for the 2020 tax year for zip code 78254, filed in 2021:
Average Adjusted Gross Income (AGI) in 2020: $65,943 (Individual Income Tax Returns)
Here:
$65,943
State:
$77,054
Salary/wage: $62,119 (reported on 88.6% of returns)
Here:
$62,119
State:
$62,766
(% of AGI for various income ranges: 1130.6% for AGIs below $25k, 3614.1% for AGIs $25k-50k, 6438.1% for AGIs $50k-75k, 9419.1% for AGIs $75k-100k, 17174.8% for AGIs $100k-200k, 53750.6% for AGIs over 200k)
Taxable interest for individuals: $713 (reported on 20.7% of returns)
This zip code:
$713
Texas:
$2,665
(% of AGI for various income ranges: 7.1% for AGIs below $25k, 8.9% for AGIs $25k-50k, 13.3% for AGIs $50k-75k, 16.8% for AGIs $75k-100k, 39.8% for AGIs $100k-200k, 301.2% for AGIs over 200k)
Ordinary dividends: $1,990 (reported on 11.4% of returns)
Here:
$1,990
State:
$10,044
(% of AGI for various income ranges: 5.9% for AGIs below $25k, 9.1% for AGIs $25k-50k, 19.3% for AGIs $50k-75k, 23.9% for AGIs $75k-100k, 68.3% for AGIs $100k-200k, 617.0% for AGIs over 200k)
Net capital gain/loss in AGI: +$6,267 (reported on 11.4% of returns)
Here:
+$6,267
State:
+$39,590
(% of AGI for various income ranges: 4.5% for AGIs below $25k, 13.4% for AGIs $25k-50k, 30.9% for AGIs $50k-75k, 51.6% for AGIs $75k-100k, 212.6% for AGIs $100k-200k, 3299.4% for AGIs over 200k)
Profit/loss from business: +$7,138 (reported on 17.2% of returns)
Here:
+$7,138
State:
+$10,888
(% of AGI for various income ranges: 88.3% for AGIs below $25k, 94.5% for AGIs $25k-50k, 111.2% for AGIs $50k-75k, 122.2% for AGIs $75k-100k, 291.3% for AGIs $100k-200k, 2158.2% for AGIs over 200k)
Taxable individual retirement arrangement distribution: $17,739 (reported on 4.6% of returns)
78254:
$17,739
Texas:
$24,740
(% of AGI for various income ranges: 21.4% for AGIs below $25k, 34.3% for AGIs $25k-50k, 80.1% for AGIs $50k-75k, 108.4% for AGIs $75k-100k, 248.8% for AGIs $100k-200k, 1659.4% for AGIs over 200k)
Self-employed (Keogh) retirement plans: $12,900 (reported on 0.1% of returns)
78254:
$12,900
Texas:
$29,298
(% of AGI for various income ranges: 14.3% for AGIs $100k-200k)
Total itemized deductions: $26,718 (reported on 8.1% of returns)
Here:
$26,718
State:
$40,428
(% of AGI for various income ranges: 30.8% for AGIs below $25k, 140.9% for AGIs $25k-50k, 319.9% for AGIs $50k-75k, 380.2% for AGIs $75k-100k, 574.8% for AGIs $100k-200k, 2629.7% for AGIs over 200k)
Charity contributions: $8,109 (reported on 6.0% of returns)
Here:
$8,109
State:
$18,201
(% of AGI for various income ranges: 2.7% for AGIs below $25k, 18.6% for AGIs $25k-50k, 46.9% for AGIs $50k-75k, 68.9% for AGIs $75k-100k, 158.7% for AGIs $100k-200k, 1087.9% for AGIs over 200k)
Taxes paid: $7,019 (reported on 7.9% of returns)
78254:
$7,019
State:
$7,821
(% of AGI for various income ranges: 6.1% for AGIs below $25k, 34.4% for AGIs $25k-50k, 81.7% for AGIs $50k-75k, 105.8% for AGIs $75k-100k, 152.7% for AGIs $100k-200k, 611.8% for AGIs over 200k)
Earned income credit: $2,279 (reported on 14.7% of returns)
Here:
$2,279
State:
$2,584
(% of AGI for various income ranges: 86.3% for AGIs below $25k, 77.1% for AGIs $25k-50k, 1.7% for AGIs $50k-75k)
Percentage of individuals using paid preparers for their 2020 taxes: 94.1%
Here:
94%
State:
92%
(% for various income ranges: 92.7% for AGIs below $25k, 94.6% for AGIs $25k-50k, 94.3% for AGIs $50k-75k, 95.0% for AGIs $75k-100k, 94.6% for AGIs $100k-200k, 94.3% for AGIs over 200k)
Averages for the 2012 tax year for zip code 78254, filed in 2013:
Average Adjusted Gross Income (AGI) in 2012: $55,700 (Individual Income Tax Returns)
Here:
$55,700
State:
$65,384
Salary/wage: $51,764 (reported on 90.8% of returns)
Here:
$51,764
State:
$52,524
(% of AGI for various income ranges: 83.7% for AGIs below $25k, 88.2% for AGIs $25k-50k, 87.0% for AGIs $50k-75k, 86.8% for AGIs $75k-100k, 84.7% for AGIs $100k-200k, 61.1% for AGIs over 200k)
Taxable interest for individuals: $665 (reported on 24.8% of returns)
This zip code:
$665
Texas:
$2,372
(% of AGI for various income ranges: 0.5% for AGIs below $25k, 0.3% for AGIs $25k-50k, 0.3% for AGIs $50k-75k, 0.2% for AGIs $75k-100k, 0.3% for AGIs $100k-200k, 0.4% for AGIs over 200k)
Ordinary dividends: $2,224 (reported on 11.8% of returns)
Here:
$2,224
State:
$9,721
(% of AGI for various income ranges: 0.9% for AGIs below $25k, 0.3% for AGIs $25k-50k, 0.4% for AGIs $50k-75k, 0.3% for AGIs $75k-100k, 0.5% for AGIs $100k-200k, 1.0% for AGIs over 200k)
Net capital gain/loss in AGI: +$4,472 (reported on 8.7% of returns)
Here:
+$4,472
State:
+$35,319
(% of AGI for various income ranges: 0.1% for AGIs $25k-50k, 0.2% for AGIs $50k-75k, 0.3% for AGIs $75k-100k, 0.5% for AGIs $100k-200k, 6.3% for AGIs over 200k)
Profit/loss from business: +$8,247 (reported on 14.1% of returns)
Here:
+$8,247
State:
+$13,732
(% of AGI for various income ranges: 7.2% for AGIs below $25k, 2.4% for AGIs $25k-50k, 1.4% for AGIs $50k-75k, 1.2% for AGIs $75k-100k, 1.5% for AGIs $100k-200k, 3.4% for AGIs over 200k)
Taxable individual retirement arrangement distribution: $12,584 (reported on 5.6% of returns)
78254:
$12,584
Texas:
$19,511
(% of AGI for various income ranges: 1.3% for AGIs below $25k, 1.0% for AGIs $25k-50k, 1.1% for AGIs $50k-75k, 1.1% for AGIs $75k-100k, 1.4% for AGIs $100k-200k, 1.9% for AGIs over 200k)
Self-employment retirement plans: $11,800 (reported on 0.2% of returns)
78254:
$11,800
Texas:
$23,938
Total itemized deductions: $17,440 (21% of AGI, reported on 35.5% of returns)
Here:
$17,440
State:
$24,724
Here:
20.8% of AGI
State:
15.9% of AGI
(% of AGI for various income ranges: 7.5% for AGIs below $25k, 12.4% for AGIs $25k-50k, 12.5% for AGIs $50k-75k, 11.5% for AGIs $75k-100k, 10.8% for AGIs $100k-200k, 8.0% for AGIs over 200k)
Charity contributions: $3,098 (reported on 26.9% of returns)
Here:
$3,098
State:
$6,808
(% of AGI for various income ranges: 0.4% for AGIs below $25k, 1.0% for AGIs $25k-50k, 1.5% for AGIs $50k-75k, 1.5% for AGIs $75k-100k, 1.8% for AGIs $100k-200k, 2.3% for AGIs over 200k)
Taxes paid: $5,197 (reported on 35.0% of returns)
78254:
$5,197
State:
$6,921
(% of AGI for various income ranges: 1.7% for AGIs below $25k, 3.2% for AGIs $25k-50k, 3.5% for AGIs $50k-75k, 3.4% for AGIs $75k-100k, 3.5% for AGIs $100k-200k, 2.5% for AGIs over 200k)
Earned income credit: $2,241 (reported on 16.5% of returns)
Here:
$2,241
State:
$2,570
(% of AGI for various income ranges: 6.7% for AGIs below $25k, 1.3% for AGIs $25k-50k)
Percentage of individuals using paid preparers for their 2012 taxes: 34.7%
Here:
35%
State:
51%
(% for various income ranges: 33.8% for AGIs below $25k, 33.6% for AGIs $25k-50k, 34.4% for AGIs $50k-75k, 34.4% for AGIs $75k-100k, 37.6% for AGIs $100k-200k, 55.6% for AGIs over 200k)
Averages for the 2004 tax year for zip code 78254, filed in 2005:
Average Adjusted Gross Income (AGI) in 2004: $48,604 (Individual Income Tax Returns)
Here:
$48,604
State:
$47,881
Salary/wage: $45,665 (reported on 91.9% of returns)
Here:
$45,665
State:
$41,947
(% of AGI for various income ranges: 132.2% for AGIs below $10k, 85.9% for AGIs $10k-25k, 88.9% for AGIs $25k-50k, 88.7% for AGIs $50k-75k, 88.5% for AGIs $75k-100k, 79.2% for AGIs over 100k)
Taxable interest for individuals: $859 (reported on 36.5% of returns)
This zip code:
$859
Texas:
$2,255
(% of AGI for various income ranges: 3.3% for AGIs below $10k, 1.1% for AGIs $10k-25k, 0.6% for AGIs $25k-50k, 0.6% for AGIs $50k-75k, 0.5% for AGIs $75k-100k, 0.7% for AGIs over 100k)
Taxable dividends: $1,067 (reported on 17.3% of returns)
Here:
$1,067
State:
$4,261
(% of AGI for various income ranges: 2.1% for AGIs below $10k, 0.5% for AGIs $10k-25k, 0.3% for AGIs $25k-50k, 0.3% for AGIs $50k-75k, 0.3% for AGIs $75k-100k, 0.5% for AGIs over 100k)
Net capital gain/loss: +$3,716 (reported on 14.1% of returns)
Here:
+$3,716
State:
+$16,110
(% of AGI for various income ranges: 1.9% for AGIs below $10k, 0.0% for AGIs $10k-25k, 0.2% for AGIs $25k-50k, 0.1% for AGIs $50k-75k, 0.7% for AGIs $75k-100k, 3.0% for AGIs over 100k)
Profit/loss from business: +$8,693 (reported on 15.0% of returns)
Here:
+$8,693
State:
+$11,013
(% of AGI for various income ranges: 3.0% for AGIs below $10k, 4.8% for AGIs $10k-25k, 1.8% for AGIs $25k-50k, 1.7% for AGIs $50k-75k, 1.7% for AGIs $75k-100k, 4.4% for AGIs over 100k)
IRA payment deduction: $2,693 (reported on 2.3% of returns)
78254:
$2,693
Texas:
$3,120
(% of AGI for various income ranges: 0.2% for AGIs $10k-25k, 0.2% for AGIs $25k-50k, 0.1% for AGIs $50k-75k, 0.1% for AGIs $75k-100k, 0.1% for AGIs over 100k)
Self-employed pension: $11,203 (reported on 0.5% of returns)
Here:
$11,203
Texas:
$16,401
Total itemized deductions: $15,288 (21% of AGI, reported on 42.0% of returns)
Here:
$15,288
State:
$19,631
Here:
21.0% of AGI
State:
18.9% of AGI
(% of AGI for various income ranges: 9.5% for AGIs below $10k, 8.8% for AGIs $10k-25k, 14.3% for AGIs $25k-50k, 14.7% for AGIs $50k-75k, 14.3% for AGIs $75k-100k, 11.5% for AGIs over 100k)
Charity contributions deductions: $2,413 (3% of AGI, reported on 34.8% of returns)
Here:
$2,413
State:
$4,753
Here:
3.2% of AGI
State:
4.2% of AGI
(% of AGI for various income ranges: 0.5% for AGIs below $10k, 0.9% for AGIs $10k-25k, 1.3% for AGIs $25k-50k, 1.7% for AGIs $50k-75k, 1.8% for AGIs $75k-100k, 2.2% for AGIs over 100k)
Total tax: $6,140 (reported on 78.9% of returns)
78254:
$6,140
State:
$9,058
(% of AGI for various income ranges: 3.3% for AGIs below $10k, 4.1% for AGIs $10k-25k, 6.1% for AGIs $25k-50k, 8.0% for AGIs $50k-75k, 9.8% for AGIs $75k-100k, 16.3% for AGIs over 100k)
Earned income credit: $1,725 (reported on 12.5% of returns)
Here:
$1,725
State:
$2,024
Percentage of individuals using paid preparers for their 2004 taxes: 41.4%
Here:
41%
State:
57%
(% for various income ranges: 32.3% for AGIs below $10k, 46.9% for AGIs $10k-25k, 42.2% for AGIs $25k-50k, 41.8% for AGIs $50k-75k, 40.0% for AGIs $75k-100k, 43.9% for AGIs over 100k)
Likely homosexual households (counted as self-reported same-sex unmarried-partner households)
Lesbian couples: 0.1% of all households
Gay men: 0.0% of all households
Household received Food Stamps/SNAP in the past 12 months: 1,478 Household did not receive Food Stamps/SNAP in the past 12 months: 23,285
Women who had a birth in the past 12 months: 1,196 (973 now married, 231 unmarried) Women who did not have a birth in the past 12 months: 19,694 (10,224 now married, 9,420 unmarried)
Housing units in zip code 78254 with a mortgage: 15,451 (592 second mortgage, 10 home equity loan, 584 both second mortgage and home equity loan) Houses without a mortgage: 96
Median monthly owner costs for units with a mortgage: $1,894 Median monthly owner costs for units without a mortgage: $806
Residents with income below the poverty level in 2022:
This zip code:
5.1%
Whole state:
14.0%
Residents with income below 50% of the poverty level in 2022:
This zip code:
4.0%
Whole state:
7.4%
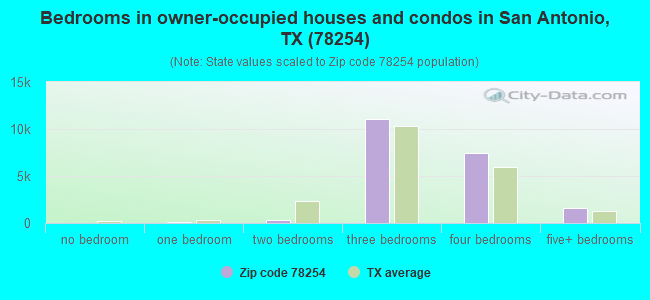
Median number of rooms in houses and condos:
Here:
6.6
State:
6.3
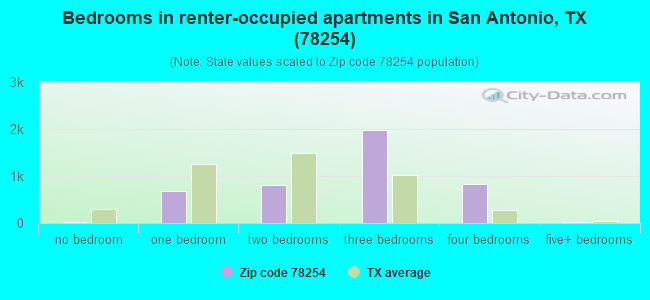
Median number of rooms in apartments:
Here:
5.1
State:
4.0
Notable locations in this zip code not listed on our city pages
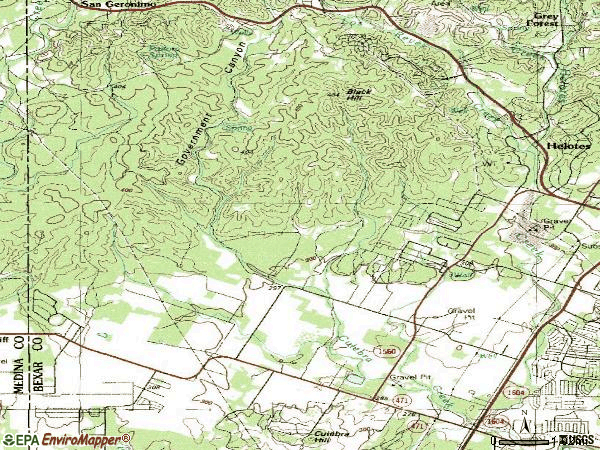
Notable locations in zip code 78254: Kallison Ranch (A), Wildcat Windmill (B), San Antonio Fire Department Station 49 (C). Display/hide their locations on the map
Churches in zip code 78254 include: Zion Church (A), Northwest Community Evangelical Free Church (B), Zion Lutheran Church of Helote Church (C), Kids of the Kingdom Church (D), Alamo Seventh Day Church of God (E), River of Life Small Group Christian Church (F). Display/hide their locations on the map
Tourist attractions (not listed on the city page) : Animal Sanctuary of the United States (Recreation Areas; 9626 Leslie) (1), Adams Land & Livestock (Recreation Areas; 11855 State Highway 211) (2). Display/hide their approximate locations on the map
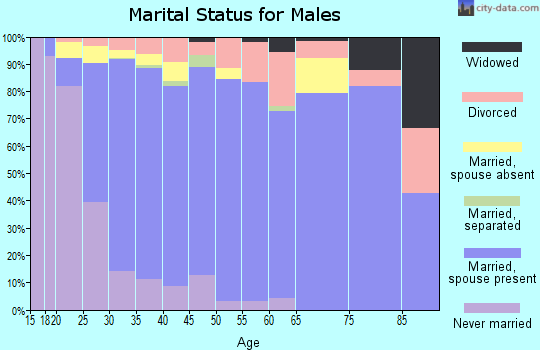
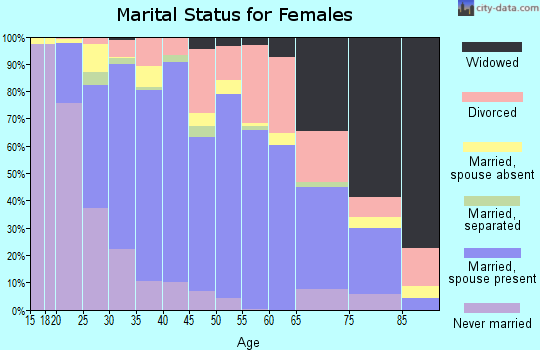
17,485 married couples with children.
3,935 single-parent households (1,406 men, 2,529 women).
72.6% of residents of 78254 zip code speak English at home.
22.4% of residents speak Spanish at home (76% very well, 16% well, 5% not well, 2% not at all).
2.1% of residents speak other Indo-European language at home (80% very well, 13% well, 7% not well).
1.4% of residents speak Asian or Pacific Island language at home (72% very well, 25% well, 3% not well).
1.6% of residents speak other language at home (60% very well, 22% well, 19% not well).
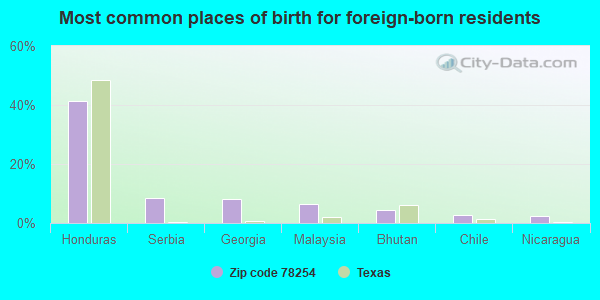
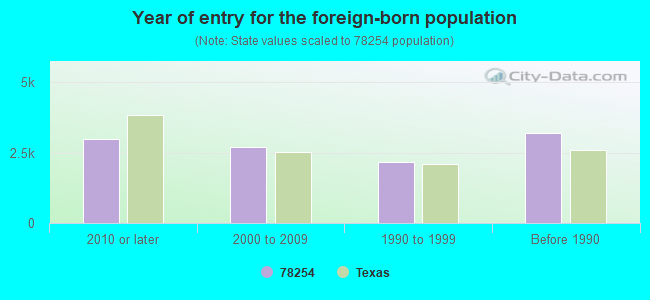
Foreign born population: 7,971 (10.1%) (64.6% of them are naturalized citizens)
Housing units lacking complete plumbing facilities: 0.1% Housing units lacking complete kitchen facilities: 0.5%
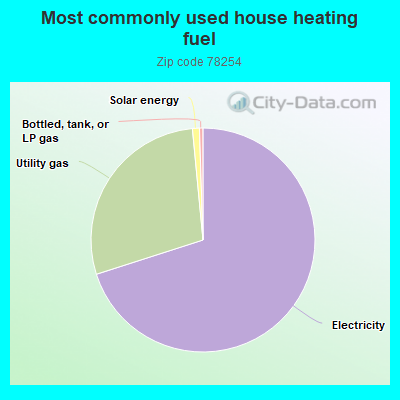
69.7%Electricity
28.3%Utility gas
1.0%Solar energy
0.5%Bottled, tank, or LP gas
Population in 1990: 1,340. Population change in the 1990s: +51 (+3.8%).
Place of birth for U.S.-born residents:
This state: 44,892
Northeast: 3,099
Midwest: 3,812
South: 7,274
West: 8,926
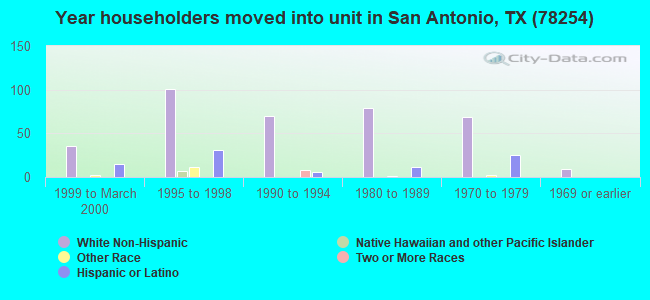
66% of the 78254 zip code residents lived in the same house 5 years ago. Out of people who lived in different houses, 73% lived in this county. Out of people who lived in different counties, 50% lived in Texas.
83% of the 78254 zip code residents lived in the same house 1 year ago. Out of people who lived in different houses, 61% moved from this county. Out of people who lived in different houses, 14% moved from different county within same state. Out of people who lived in different houses, 21% moved from different state. Out of people who lived in different houses, 2% moved from abroad.
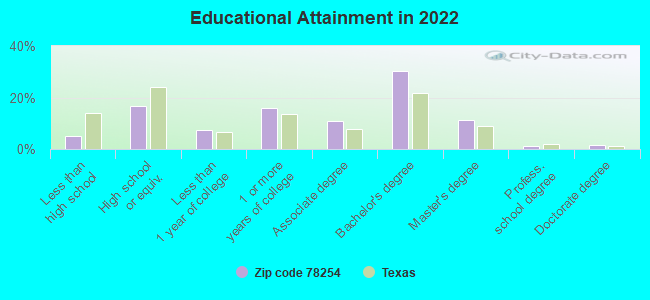
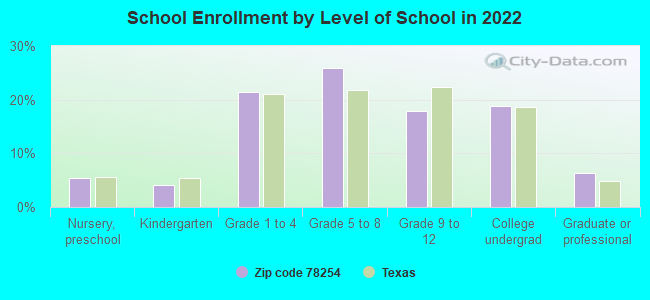
Private vs. public school enrollment:
Students in private schools in grades 1 to 8 (elementary and middle school): 845
Here:
7.0%
Texas:
8.8%
Students in private schools in grades 9 to 12 (high school): 190
Here:
4.2%
Texas:
8.0%
Students in private undergraduate colleges: 964
Here:
20.0%
Texas:
16.2%
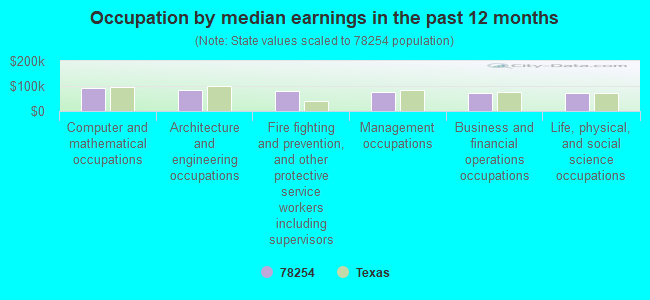
Occupation by median earnings in the past 12 months ($)
91,474Computer and mathematical occupations
85,677Architecture and engineering occupations
79,333Fire fighting and prevention, and other protective service workers including supervisors
74,964Management occupations
72,009Business and financial operations occupations
71,729Life, physical, and social science occupations
Companies with federal contracts located in this zip code (SAN ANTONIO, TX):
AARDVARK KEITH MOVING, INC (11351 WICKWILDE; small business) : $887,067 in 23 contractsfrom 2000 to 2006
Contracts for Other Management Support Services, Relocation Services, Motor Freight, Office Furniture, and moreby Air Force, Army Signed by year:2000: $30,000; 2001: $0; 2002: $173,473; 2003: $397,632; 2004: $9,873; 2005: $276,951; 2006: -$862.
Biggest contracts:
$225,683 with Air Force for Other Management Support Services. Signed on 2003-12-01. Completion date: 2004-11-30.
$191,972, same as above.Signed on 2005-11-04. Completion date: 2006-09-30.
$146,399, same as above.Signed on 2002-12-01. Completion date: 2003-11-30.
$85,995, same as above.Signed on 2003-07-01. Completion date: 2003-11-30.
THOMAS M DUGINSKI (8915 SHADY LEAF; small business) : $544,213 in 7 contractsfrom 2002 to 2006
Contracts for Neurology Services by Air Force, Army Signed by year:2000: $0; 2001: $0; 2002: $132,000; 2003: $132,000; 2004: $121,838; 2005: $167,000; 2006: -$8,625.
Biggest contracts:
$144,000 with Air Force for Neurology Services. Signed on 2005-10-01. Completion date: 2006-09-30.
$132,000 with Army for Neurology Services. Signed on 2003-09-04. Completion date: 2003-09-12.
$132,000, same as above.Signed on 2002-09-12. Completion date: 2003-09-12.
$92,000 with Air Force for Neurology Services. Signed on 2004-12-01. Completion date: 2005-07-31.
BRAIDA, NICOLE N (9114 SHADE TREE; small business)
$190,020 with Air Force for Psychiatry Services. Signed on 2005-09-30. Completion date: 2006-09-29.
TERRA LINGUA (8800 BRIGADOON ST; small business)
$47,870 with Air Force for Training/Curriculum Development. Signed on 2004-02-05. Completion date: 2004-08-13.
HENDRICKS, DENNIS M (8734 CURRY HEIGHTS; small business)
$27,535 with Air Force for Maintenance, Repair and Rebuilding of Equipment -- Refrigeration, Air Conditioning, and Air Circulating Equipment. Signed on 2005-09-23. Completion date: 2006-03-31.
EDWARDS HOLDINGS, INC (7490 FM 1560 N; small business)
$3,078 with Air Force for Maintenance, Repair and Rebuilding of Equipment -- Engines, Turbines, and Components. Signed on 2005-03-17. Completion date: 2005-04-12.
OFFICE OF ARBITRATOR RUBEN R A (8610 CHEVIOT HTS; small business)
$3,000 with Army for Other Professional Services. Signed on 2006-03-31. Completion date: 2006-04-03.
Top industries in this zip code by the number of employees in 2005:
Construction: Water and Sewer Line and Related Structures Construction (100-249 employees: 1 establishment, 20-49 employees: 1 establishment, 1-4 employees: 1 establishment)
Construction: Site Preparation Contractors (100-249: 1, 10-19: 2, 1-4: 1)
Health Care and Social Assistance: Child and Youth Services (100-249: 1)
Construction: Poured Concrete Foundation and Structure Contractors (50-99: 1, 20-49: 1, 1-4: 1)
Other Services (except Public Administration): Religious Organizations (20-49: 1, 10-19: 2, 5-9: 1, 1-4: 3)
Accommodation and Food Services: Limited-Service Restaurants (50-99: 1, 1-4: 2)
Accommodation and Food Services: Full-Service Restaurants (50-99: 1, 1-4: 2)
Health Care and Social Assistance: Home Health Care Services (50-99: 1)
Construction: Power and Communication Line and Related Structures Construction (50-99: 1)
People in group quarters in 2010:
113 people in nursing facilities/skilled-nursing facilities
6 people in group homes intended for adults
People in group quarters in 2000:
55 people in college dormitories (includes college quarters off campus)
Fatal accident statistics in 2014:
Fatal accident count: 2
Vehicles involved in fatal accidents: 5
Fatal accidents caused by drunken drivers: 0
Fatalities: 2
Persons involved in fatal accidents: 9
Pedestrians involved in fatal accidents: 0
Fatal accident statistics in 2013:
Fatal accident count: 3
Vehicles involved in fatal accidents: 4
Fatal accidents caused by drunken drivers: 0
Fatalities: 3
Persons involved in fatal accidents: 4
Pedestrians involved in fatal accidents: 1
Home Mortgage Disclosure Act Aggregated Statistics For Year 2009 (Based on 4 partial tracts)
A) FHA, FSA/RHS & VA Home Purchase Loans
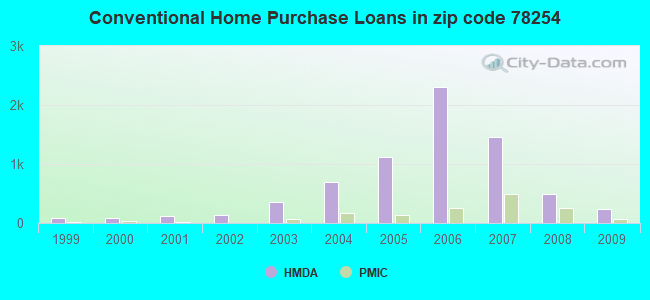
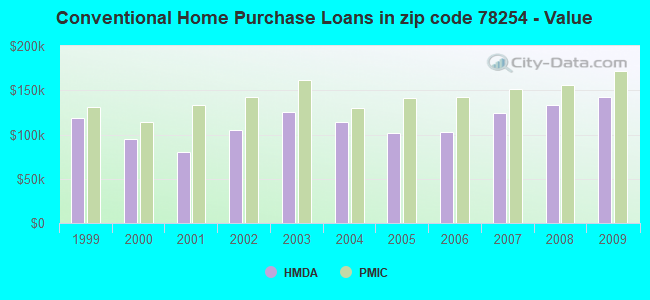
B) Conventional Home Purchase Loans
C) Refinancings
D) Home Improvement Loans
F) Non-occupant Loans on < 5 Family Dwellings (A B C & D)
G) Loans On Manufactured Home Dwelling (A B C & D)
Number
Average Value
Number
Average Value
Number
Average Value
Number
Average Value
Number
Average Value
Number
Average Value
LOANS ORIGINATED
797
$153,254
240
$141,923
906
$155,950
40
$32,985
71
$113,409
25
$37,722
APPLICATIONS APPROVED, NOT ACCEPTED
47
$160,270
25
$83,036
112
$149,113
7
$34,199
7
$118,386
16
$47,775
APPLICATIONS DENIED
117
$159,633
58
$106,745
353
$145,811
62
$30,445
35
$109,341
25
$45,224
APPLICATIONS WITHDRAWN
103
$150,746
28
$160,693
265
$150,202
14
$70,322
23
$114,904
3
$18,230
FILES CLOSED FOR INCOMPLETENESS
14
$154,181
10
$156,224
55
$163,687
0
$0
3
$123,200
1
$45,560
Aggregated Statistics For Year 2008 (Based on 4 partial tracts)
A) FHA, FSA/RHS & VA Home Purchase Loans
B) Conventional Home Purchase Loans
C) Refinancings
D) Home Improvement Loans
F) Non-occupant Loans on < 5 Family Dwellings (A B C & D)
G) Loans On Manufactured Home Dwelling (A B C & D)
Number
Average Value
Number
Average Value
Number
Average Value
Number
Average Value
Number
Average Value
Number
Average Value
LOANS ORIGINATED
949
$156,897
493
$133,573
397
$151,337
55
$41,935
119
$123,271
73
$35,872
APPLICATIONS APPROVED, NOT ACCEPTED
76
$151,563
68
$118,296
63
$157,302
22
$43,663
11
$125,504
24
$37,837
APPLICATIONS DENIED
106
$154,123
111
$120,215
374
$136,774
146
$38,421
28
$131,343
36
$48,939
APPLICATIONS WITHDRAWN
118
$154,572
83
$149,402
169
$153,197
21
$57,127
24
$112,063
3
$40,330
FILES CLOSED FOR INCOMPLETENESS
19
$160,546
18
$141,319
15
$175,961
0
$0
3
$65,190
0
$0
Aggregated Statistics For Year 2007 (Based on 4 partial tracts)
A) FHA, FSA/RHS & VA Home Purchase Loans
B) Conventional Home Purchase Loans
C) Refinancings
D) Home Improvement Loans
F) Non-occupant Loans on < 5 Family Dwellings (A B C & D)
G) Loans On Manufactured Home Dwelling (A B C & D)
Number
Average Value
Number
Average Value
Number
Average Value
Number
Average Value
Number
Average Value
Number
Average Value
LOANS ORIGINATED
731
$154,530
1,464
$124,744
312
$148,215
74
$33,346
340
$111,094
41
$38,444
APPLICATIONS APPROVED, NOT ACCEPTED
45
$150,688
209
$115,349
78
$128,486
28
$29,890
52
$104,822
7
$51,143
APPLICATIONS DENIED
138
$145,138
311
$108,736
384
$129,105
152
$35,736
98
$103,799
43
$44,765
APPLICATIONS WITHDRAWN
189
$145,787
400
$118,942
151
$128,299
19
$36,256
68
$106,843
6
$56,155
FILES CLOSED FOR INCOMPLETENESS
7
$136,066
42
$142,809
36
$163,894
7
$36,264
5
$109,388
0
$0
Aggregated Statistics For Year 2006 (Based on 4 partial tracts)
A) FHA, FSA/RHS & VA Home Purchase Loans
B) Conventional Home Purchase Loans
C) Refinancings
D) Home Improvement Loans
F) Non-occupant Loans on < 5 Family Dwellings (A B C & D)
G) Loans On Manufactured Home Dwelling (A B C & D)
Number
Average Value
Number
Average Value
Number
Average Value
Number
Average Value
Number
Average Value
Number
Average Value
LOANS ORIGINATED
842
$147,684
2,297
$102,716
237
$146,790
87
$30,166
624
$92,527
11
$46,875
APPLICATIONS APPROVED, NOT ACCEPTED
59
$138,996
367
$98,179
55
$132,055
21
$37,932
84
$90,610
17
$52,062
APPLICATIONS DENIED
79
$144,940
402
$97,354
271
$120,943
122
$38,917
104
$91,184
42
$56,369
APPLICATIONS WITHDRAWN
175
$146,057
638
$100,360
181
$128,331
15
$49,761
123
$91,975
0
$0
FILES CLOSED FOR INCOMPLETENESS
3
$141,430
81
$103,810
54
$143,624
1
$103,360
15
$117,675
0
$0
Aggregated Statistics For Year 2005 (Based on 4 partial tracts)
A) FHA, FSA/RHS & VA Home Purchase Loans
B) Conventional Home Purchase Loans
C) Refinancings
D) Home Improvement Loans
E) Loans on Dwellings For 5+ Families
F) Non-occupant Loans on < 5 Family Dwellings (A B C & D)
G) Loans On Manufactured Home Dwelling (A B C & D)
Number
Average Value
Number
Average Value
Number
Average Value
Number
Average Value
Number
Average Value
Number
Average Value
Number
Average Value
LOANS ORIGINATED
512
$135,223
1,120
$101,957
269
$138,596
48
$45,394
2
$4,723,590
195
$95,313
49
$45,074
APPLICATIONS APPROVED, NOT ACCEPTED
42
$135,886
147
$88,997
55
$125,963
27
$32,004
0
$0
23
$87,003
10
$61,490
APPLICATIONS DENIED
84
$128,596
235
$93,240
308
$122,154
75
$29,528
0
$0
58
$85,975
34
$45,409
APPLICATIONS WITHDRAWN
93
$131,165
206
$95,488
200
$150,320
32
$147,385
0
$0
46
$118,018
0
$0
FILES CLOSED FOR INCOMPLETENESS
6
$145,548
28
$104,707
74
$155,553
2
$27,200
0
$0
1
$325,040
0
$0
Aggregated Statistics For Year 2004 (Based on 4 partial tracts)
A) FHA, FSA/RHS & VA Home Purchase Loans
B) Conventional Home Purchase Loans
C) Refinancings
D) Home Improvement Loans
F) Non-occupant Loans on < 5 Family Dwellings (A B C & D)
G) Loans On Manufactured Home Dwelling (A B C & D)
Number
Average Value
Number
Average Value
Number
Average Value
Number
Average Value
Number
Average Value
Number
Average Value
LOANS ORIGINATED
599
$123,697
701
$114,655
300
$124,171
19
$65,787
75
$93,561
48
$43,484
APPLICATIONS APPROVED, NOT ACCEPTED
28
$115,120
86
$101,382
58
$127,009
9
$35,429
9
$102,203
10
$43,590
APPLICATIONS DENIED
179
$110,230
141
$94,307
206
$119,400
30
$45,922
20
$95,737
24
$51,777
APPLICATIONS WITHDRAWN
189
$110,402
191
$111,986
120
$125,988
9
$42,073
14
$88,982
3
$65,190
FILES CLOSED FOR INCOMPLETENESS
12
$103,127
36
$112,372
60
$137,369
1
$20,400
2
$96,640
2
$52,210
Aggregated Statistics For Year 2003 (Based on 4 partial tracts)
A) FHA, FSA/RHS & VA Home Purchase Loans
B) Conventional Home Purchase Loans
C) Refinancings
D) Home Improvement Loans
F) Non-occupant Loans on < 5 Family Dwellings (A B C & D)
Number
Average Value
Number
Average Value
Number
Average Value
Number
Average Value
Number
Average Value
LOANS ORIGINATED
388
$115,701
353
$125,977
614
$129,986
29
$25,048
17
$94,071
APPLICATIONS APPROVED, NOT ACCEPTED
21
$104,288
56
$112,754
59
$135,533
5
$52,018
2
$23,205
APPLICATIONS DENIED
82
$97,492
82
$101,044
163
$111,101
29
$21,546
15
$83,037
APPLICATIONS WITHDRAWN
86
$105,730
77
$112,305
145
$129,128
5
$30,590
1
$145,520
FILES CLOSED FOR INCOMPLETENESS
16
$93,314
13
$146,518
34
$124,187
2
$16,575
2
$89,500
Aggregated Statistics For Year 2002 (Based on 2 partial tracts)
A) FHA, FSA/RHS & VA Home Purchase Loans
B) Conventional Home Purchase Loans
C) Refinancings
D) Home Improvement Loans
F) Non-occupant Loans on < 5 Family Dwellings (A B C & D)
Number
Average Value
Number
Average Value
Number
Average Value
Number
Average Value
Number
Average Value
LOANS ORIGINATED
648
$113,652
131
$105,631
154
$106,913
8
$15,331
8
$74,582
APPLICATIONS APPROVED, NOT ACCEPTED
10
$120,493
20
$57,926
15
$121,653
2
$3,315
2
$20,720
APPLICATIONS DENIED
45
$115,686
12
$59,252
30
$75,909
10
$18,894
2
$35,635
APPLICATIONS WITHDRAWN
264
$102,495
45
$103,974
31
$108,854
0
$0
2
$198,890
FILES CLOSED FOR INCOMPLETENESS
5
$110,382
7
$103,469
7
$87,843
0
$0
0
$0
Aggregated Statistics For Year 2001 (Based on 2 partial tracts)
A) FHA, FSA/RHS & VA Home Purchase Loans
B) Conventional Home Purchase Loans
C) Refinancings
D) Home Improvement Loans
F) Non-occupant Loans on < 5 Family Dwellings (A B C & D)
Number
Average Value
Number
Average Value
Number
Average Value
Number
Average Value
Number
Average Value
LOANS ORIGINATED
545
$103,647
121
$80,788
60
$116,432
3
$12,707
12
$80,522
APPLICATIONS APPROVED, NOT ACCEPTED
5
$104,416
46
$55,883
7
$86,896
2
$20,720
5
$121,654
APPLICATIONS DENIED
53
$105,636
106
$49,159
30
$92,096
13
$13,004
3
$40,883
APPLICATIONS WITHDRAWN
267
$93,957
50
$83,400
20
$103,670
3
$46,407
7
$97,787
FILES CLOSED FOR INCOMPLETENESS
8
$100,894
2
$8,285
8
$115,811
0
$0
0
$0
Aggregated Statistics For Year 2000 (Based on 2 partial tracts)
A) FHA, FSA/RHS & VA Home Purchase Loans
B) Conventional Home Purchase Loans
C) Refinancings
D) Home Improvement Loans
F) Non-occupant Loans on < 5 Family Dwellings (A B C & D)
Number
Average Value
Number
Average Value
Number
Average Value
Number
Average Value
Number
Average Value
LOANS ORIGINATED
111
$115,510
78
$94,791
8
$48,479
18
$19,797
3
$82,870
APPLICATIONS APPROVED, NOT ACCEPTED
0
$0
18
$75,136
2
$58,840
7
$12,311
0
$0
APPLICATIONS DENIED
7
$111,756
22
$58,235
8
$64,224
18
$15,009
0
$0
APPLICATIONS WITHDRAWN
13
$135,525
10
$87,842
3
$78,450
2
$20,720
0
$0
FILES CLOSED FOR INCOMPLETENESS
0
$0
3
$146,403
5
$72,594
0
$0
0
$0
Aggregated Statistics For Year 1999 (Based on 2 partial tracts)
A) FHA, FSA/RHS & VA Home Purchase Loans
B) Conventional Home Purchase Loans
C) Refinancings
D) Home Improvement Loans
F) Non-occupant Loans on < 5 Family Dwellings (A B C & D)
Detailed PMIC statistics for the following Tracts:1817.01
, 1821.04
2003 - 2018 National Fire Incident Reporting System (NFIRS) incidents
Based on the data from the years 2003 - 2018 the average number of fires per year is 38. The highest number of reported fires - 99 took place in 2018, and the least - 7 in 2004. The data has an increasing trend.
When looking into fire subcategories, the most incidents belonged to: Outside Fires (42.5%), and Structure Fires (35.9%).
Fire incident types reported to NFIRS in Zip Code 78254


 Nearest zip codes: 78250, 78023, 78251, 78253, 78249, 78240.


 : $887,067 in 23 contracts from 2000 to 2006
 Based on the data from the years 2003 - 2018 the average number of fires per year is 38. The highest number of reported fires - 99 took place in 2018, and the least - 7 in 2004. The data has an increasing trend.
 When looking into fire subcategories, the most incidents belonged to: Outside Fires (42.5%), and Structure Fires (35.9%).