Estimated zip code population in 2022: 49
Houses and condos: 86
Renter-occupied apartments: 13
| % of renters here: | 100% |
| State: | 38% |
78.7
(low, U.S. average is 100)
Land area: 62.1
sq. mi.
Water area: 14.3
sq. mi.
| Population density: 0.789 people per square mile | | (very low). |
- OSM Map
- Google Map
- MSN Map
- OSM Map
- General Map
- Google Map
- MSN Map
- OSM Map
- Google Map
- MSN Map
- OSM Map
- Google Map
- MSN Map
Please wait while loading the map...
Business Search - 14 Million verified businesses
| Males: 35 |  (72.9%) (72.9%) |
| Females: 13 |  (27.1%) (27.1%) |
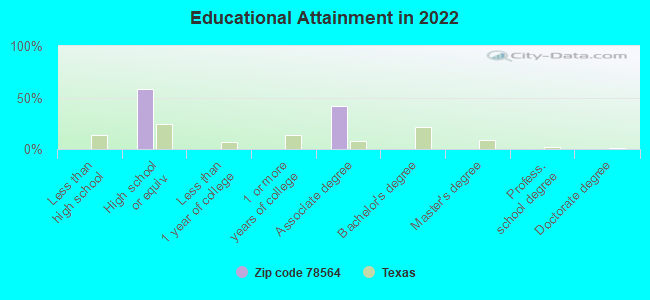
For population 25 years and over in 78564:
- High school or higher: 100.2%
- Bachelor's degree or higher: 0.0%
- Graduate or professional degree: 0.0%
For population 15 years and over in 78564:
- Never married: 100.0%
- Now married: 0.0%
- Separated: 0.0%
- Widowed: 0.0%
- Divorced: 0.0%
Zip code 78564 compared to state average:
- Median household income significantly below state average.
- Median house value significantly below state average.
- Unemployed percentage significantly below state average.
- Black race population percentage significantly below state average.
- Hispanic race population percentage above state average.
- Median age significantly below state average.
- Foreign-born population percentage significantly below state average.
- Renting percentage significantly above state average.
- Number of rooms per house below state average.
- House age significantly above state average.
- Number of college students significantly above state average.
- Percentage of population with a bachelor's degree or higher significantly below state average.
Data:
100%
urban population.
Median resident age:| This zip code: | 27.5 years |
| Texas median age: | 35.6 years |
Average household size:| This zip code: | 3.6 people |
| Texas: | 2.6 people |
Averages for the 2012 tax year for zip code 78564, filed in 2013:
Average Adjusted Gross Income (AGI) in 2012: $21,185 (Individual Income Tax Returns)
| Here: | $21,185 |
| State: | $65,384 |
Salary/wage: $20,970 (reported on 76.9% of returns)
| Here: | $20,970 |
| State: | $52,524 |
(% of AGI for various income ranges: 69.6% for AGIs below $25k, 81.1% for AGIs $25k-50k)
Profit/loss from business: +$4,950 (reported on 30.8% of returns)
| Here: | +$4,950 |
| State: | +$13,732 |
Earned income credit: $3,233 (reported on 46.2% of returns)
(% of AGI for various income ranges: 16.3% for AGIs below $25k)
Percentage of individuals using paid preparers for their 2012 taxes: 69.2%
(% for various income ranges: 60.0% for AGIs below $25k, 100.0% for AGIs $25k-50k)
Averages for the 2004 tax year for zip code 78564, filed in 2005:
Average Adjusted Gross Income (AGI) in 2004: $37,343 (Individual Income Tax Returns)
| Here: | $37,343 |
| State: | $47,881 |
Salary/wage: $17,400 (reported on 71.4% of returns)
| Here: | $17,400 |
| State: | $41,947 |
Taxable interest for individuals: $1,632 (reported on 18.1% of returns)
| This zip code: | $1,632 |
| Texas: | $2,255 |
Profit/loss from business: +$5,438 (reported on 30.5% of returns)
| Here: | +$5,438 |
| State: | +$11,013 |
Total tax: $7,515 (reported on 64.8% of returns)
(% of AGI for various income ranges: 4.8% for AGIs below $10k, 4.7% for AGIs $10k-25k, 5.6% for AGIs $25k-50k, 20.0% for AGIs $75k-100k)
Earned income credit: $2,561 (reported on 39.0% of returns)
Percentage of individuals using paid preparers for their 2004 taxes: 81.0%
(% for various income ranges: 80.8% for AGIs below $10k, 74.4% for AGIs $10k-25k, 81.5% for AGIs $25k-50k, 100.0% for AGIs $75k-100k)
Nearest zip codes: 78545,
78585,
78584,
78076,
78582,
78067.
Percentage of family households:| This zip code: | 97.2% |
| Texas: | 50.5% |
Percentage of households with unmarried partners:| This zip code: | 251.6% |
| Texas: | 48.7% |
No gay or lesbian households reported
Household received Food Stamps/SNAP in the past 12 months: 0
Household did not receive Food Stamps/SNAP in the past 12 months: 13
Women who did not have a birth in the past 12 months: 13 (0 now married, 13 unmarried)
Residents with income below the poverty level in 2022:
| This zip code: | 65.1% |
| Whole state: | 14.0% |

- Year house built (houses)
- 02020 or later
- 02010 to 2019
- 02000 to 2009
- 01990 to 1999
- 01980 to 1989
- 131970 to 1979
- 01960 to 1969
- 661950 to 1959
- 01940 to 1949
- 01939 or earlier
- Bedrooms in renter-occupied apartments in Lopeno, TX (78564)
- 0no bedroom
- 01 bedroom
- 02 bedrooms
- 133 bedrooms
- 04 bedrooms
- 05+ bedrooms
- Cars and other vehicles available in Lopeno, TX (78564) in renter-occupied apartments
- 0no vehicle
- 01 vehicle
- 132 vehicles
- 03 vehicles
- 04 vehicles
- 05+ vehicles
Mean price in 2022:
Detached houses: $182,826| Here: | $182,826 |
| State: | $369,058 |
Mobile homes: $121,975| Here: | $121,975 |
| State: | $124,413 |
Housing units in structures:
Travel time to work (commute) in zip code 78564
![Travel time to work (commute) in zip code 78564]()
- 1825 to 29 minutes
Percentage of zip code residents living and working in this county: 105.6%
Household type by relationship:
Households: 49
- Male householders: 0 (0 living alone), Female householders: 14 (0 living alone)
0 spouses (0 opposite-sex spouses), 21 unmarried partners, (21 opposite-sex unmarried partners), 17 children (17 natural, 0 adopted, 0 stepchildren), 0 grandchildren, 0 brothers or sisters, 0 parents, 0 foster children, 0 other relatives, 0 non-relatives
Size of family households: 13 3-persons
0.0% of residents of 78564 zip code speak English at home.
103.2% of residents speak Spanish at home (100% very well).
Foreign born population: 0 (0.0%)
Housing units lacking complete plumbing facilities: 30.8%
Housing units lacking complete kitchen facilities: 45.3%
Place of birth for U.S.-born residents:
41% of the 78564 zip code residents lived in the same house 1 year ago.
Out of people who lived in different houses, 84% moved from this county.
Students in private undergraduate colleges:
Top industries in this zip code by the number of employees in 2005:
- Finance and Insurance: Miscellaneous Intermediation (5-9 employees: 1 establishment)
| Most common first names in zip code 78564 among deceased individuals |
| Name | Count | Lived (average) |
|---|
| Maria | 10 | 82.8 years |
| Francisca | 3 | 95.3 years |
| Jose | 3 | 67.7 years |
| Josefa | 3 | 81.0 years |
| Antonia | 2 | 76.9 years |
| Ignacio | 2 | 73.0 years |
| Irene | 2 | 74.0 years |
| Jesus | 2 | 64.5 years |
| Lazaro | 2 | 89.0 years |
| Lucio | 2 | 87.5 years |
| Most common last names in zip code 78564 among deceased individuals |
| Last name | Count | Lived (average) |
|---|
| Ramirez | 25 | 82.2 years |
| Gonzalez | 11 | 78.8 years |
| Martinez | 9 | 77.7 years |
| Flores | 6 | 80.8 years |
| Guerra | 6 | 81.7 years |
| Lopez | 5 | 86.2 years |
| Munoz | 5 | 80.2 years |
| Benavides | 4 | 80.7 years |
| Rosas | 4 | 87.2 years |
| Sanchez | 4 | 72.2 years |