Cities: Kyle, TX (19.00%) ,
Niederwald, TX (3.93%) ,
Uhland, TX (2.60%) ,
Mustang Ridge, TX (0.09%) ,
Mountain City, TX (0.08%) Counties: Hays County, TX (83.23%) ,
Caldwell County, TX (16.77%) Estimated zip code population in 2022: 70,100
Zip code population in 2010: 42,954
Zip code population in 2000: 16,001
Houses and condos: 24,613
Renter-occupied apartments: 7,050
% of renters here:
29%State:
38%
March 2022 cost of living index in zip code 78640: 92.9
(less than average, U.S. average is 100)
Land area: 91.7
sq. mi.
Water area: 0.8
sq. mi.
Population density: 765 people per square mile (low).
OSM Map
General Map
Google Map
MSN Map
OSM Map
General Map
Google Map
MSN Map
OSM Map
General Map
Google Map
MSN Map
OSM Map
General Map
Google Map
MSN Map
Please wait while loading the map...
Real estate property taxes paid for housing units in 2022:
This zip code:
1.8% ($5,533)Texas:
1.5% ($4,050)
Median real estate property taxes paid for housing units with mortgages in 2022: $5,766 (1.9%)
Median real estate property taxes paid for housing units with no mortgage in 2022: $4,621 (1.7%)
Profiles of local businesses
Business Search - 14 Million verified businesses
Males: 36,156 Females: 33,944
For population 25 years and over in 78640:
High school or higher: 86.7%Bachelor's degree or higher: 28.8%Graduate or professional degree: 9.6%Unemployed: 3.1%Mean travel time to work (commute): 38.7 minutes
For population 15 years and over in 78640:
Never married: 36.3%Now married: 49.9%Separated: 1.4%Widowed: 2.8%Divorced: 9.5%
Zip code 78640 compared to state average:
Black race population percentage significantly below state average. Length of stay since moving in above state average. House age significantly below state average. 40,969 58.4% Hispanic or Latino 23,845 34.0% White 2,782 4.0% Black 1,559 2.2% Two or more races 520 0.7% Asian 311 0.4% Some other race 110 0.2% American Indian
Data:
Median household income ($)
Median household income (% change since 2000)
Household income diversity
Ratio of average income to average house value (%)
Ratio of average income to average rent
Median household income ($) - White
Median household income ($) - Black or African American
Median household income ($) - Asian
Median household income ($) - Hispanic or Latino
Median household income ($) - American Indian and Alaska Native
Median household income ($) - Multirace
Median household income ($) - Other Race
Median household income for houses/condos with a mortgage ($)
Median household income for apartments without a mortgage ($)
Races - White alone (%)
Races - White alone (% change since 2000)
Races - Black alone (%)
Races - Black alone (% change since 2000)
Races - American Indian alone (%)
Races - American Indian alone (% change since 2000)
Races - Asian alone (%)
Races - Asian alone (% change since 2000)
Races - Hispanic (%)
Races - Hispanic (% change since 2000)
Races - Native Hawaiian and Other Pacific Islander alone (%)
Races - Native Hawaiian and Other Pacific Islander alone (% change since 2000)
Races - Two or more races (%)
Races - Two or more races (% change since 2000)
Races - Other race alone (%)
Races - Other race alone (% change since 2000)
Racial diversity
Unemployment (%)
Unemployment (% change since 2000)
Unemployment (%) - White
Unemployment (%) - Black or African American
Unemployment (%) - Asian
Unemployment (%) - Hispanic or Latino
Unemployment (%) - American Indian and Alaska Native
Unemployment (%) - Multirace
Unemployment (%) - Other Race
Population density (people per square mile)
Population - Males (%)
Population - Females (%)
Population - Males (%) - White
Population - Males (%) - Black or African American
Population - Males (%) - Asian
Population - Males (%) - Hispanic or Latino
Population - Males (%) - American Indian and Alaska Native
Population - Males (%) - Multirace
Population - Males (%) - Other Race
Population - Females (%) - White
Population - Females (%) - Black or African American
Population - Females (%) - Asian
Population - Females (%) - Hispanic or Latino
Population - Females (%) - American Indian and Alaska Native
Population - Females (%) - Multirace
Population - Females (%) - Other Race
Coronavirus confirmed cases (Apr 24, 2024)
Deaths caused by coronavirus (Apr 24, 2024)
Coronavirus confirmed cases (per 100k population) (Apr 24, 2024)
Deaths caused by coronavirus (per 100k population) (Apr 24, 2024)
Daily increase in number of cases (Apr 24, 2024)
Weekly increase in number of cases (Apr 24, 2024)
Cases doubled (in days) (Apr 24, 2024)
Hospitalized patients (Apr 18, 2022)
Negative test results (Apr 18, 2022)
Total test results (Apr 18, 2022)
COVID Vaccine doses distributed (per 100k population) (Sep 19, 2023)
COVID Vaccine doses administered (per 100k population) (Sep 19, 2023)
COVID Vaccine doses distributed (Sep 19, 2023)
COVID Vaccine doses administered (Sep 19, 2023)
Likely homosexual households (%)
Likely homosexual households (% change since 2000)
Likely homosexual households - Lesbian couples (%)
Likely homosexual households - Lesbian couples (% change since 2000)
Likely homosexual households - Gay men (%)
Likely homosexual households - Gay men (% change since 2000)
Cost of living index
Median gross rent ($)
Median contract rent ($)
Median monthly housing costs ($)
Median house or condo value ($)
Median house or condo value ($ change since 2000)
Mean house or condo value by units in structure - 1, detached ($)
Mean house or condo value by units in structure - 1, attached ($)
Mean house or condo value by units in structure - 2 ($)
Mean house or condo value by units in structure by units in structure - 3 or 4 ($)
Mean house or condo value by units in structure - 5 or more ($)
Mean house or condo value by units in structure - Boat, RV, van, etc. ($)
Mean house or condo value by units in structure - Mobile home ($)
Median house or condo value ($) - White
Median house or condo value ($) - Black or African American
Median house or condo value ($) - Asian
Median house or condo value ($) - Hispanic or Latino
Median house or condo value ($) - American Indian and Alaska Native
Median house or condo value ($) - Multirace
Median house or condo value ($) - Other Race
Median resident age
Resident age diversity
Median resident age - Males
Median resident age - Females
Median resident age - White
Median resident age - Black or African American
Median resident age - Asian
Median resident age - Hispanic or Latino
Median resident age - American Indian and Alaska Native
Median resident age - Multirace
Median resident age - Other Race
Median resident age - Males - White
Median resident age - Males - Black or African American
Median resident age - Males - Asian
Median resident age - Males - Hispanic or Latino
Median resident age - Males - American Indian and Alaska Native
Median resident age - Males - Multirace
Median resident age - Males - Other Race
Median resident age - Females - White
Median resident age - Females - Black or African American
Median resident age - Females - Asian
Median resident age - Females - Hispanic or Latino
Median resident age - Females - American Indian and Alaska Native
Median resident age - Females - Multirace
Median resident age - Females - Other Race
Commute - mean travel time to work (minutes)
Travel time to work - Less than 5 minutes (%)
Travel time to work - Less than 5 minutes (% change since 2000)
Travel time to work - 5 to 9 minutes (%)
Travel time to work - 5 to 9 minutes (% change since 2000)
Travel time to work - 10 to 19 minutes (%)
Travel time to work - 10 to 19 minutes (% change since 2000)
Travel time to work - 20 to 29 minutes (%)
Travel time to work - 20 to 29 minutes (% change since 2000)
Travel time to work - 30 to 39 minutes (%)
Travel time to work - 30 to 39 minutes (% change since 2000)
Travel time to work - 40 to 59 minutes (%)
Travel time to work - 40 to 59 minutes (% change since 2000)
Travel time to work - 60 to 89 minutes (%)
Travel time to work - 60 to 89 minutes (% change since 2000)
Travel time to work - 90 or more minutes (%)
Travel time to work - 90 or more minutes (% change since 2000)
Marital status - Never married (%)
Marital status - Now married (%)
Marital status - Separated (%)
Marital status - Widowed (%)
Marital status - Divorced (%)
Median family income ($)
Median family income (% change since 2000)
Median non-family income ($)
Median non-family income (% change since 2000)
Median per capita income ($)
Median per capita income (% change since 2000)
Median family income ($) - White
Median family income ($) - Black or African American
Median family income ($) - Asian
Median family income ($) - Hispanic or Latino
Median family income ($) - American Indian and Alaska Native
Median family income ($) - Multirace
Median family income ($) - Other Race
Median year house/condo built
Median year apartment built
Year house built - Built 2005 or later (%)
Year house built - Built 2000 to 2004 (%)
Year house built - Built 1990 to 1999 (%)
Year house built - Built 1980 to 1989 (%)
Year house built - Built 1970 to 1979 (%)
Year house built - Built 1960 to 1969 (%)
Year house built - Built 1950 to 1959 (%)
Year house built - Built 1940 to 1949 (%)
Year house built - Built 1939 or earlier (%)
Average household size
Household density (households per square mile)
Average household size - White
Average household size - Black or African American
Average household size - Asian
Average household size - Hispanic or Latino
Average household size - American Indian and Alaska Native
Average household size - Multirace
Average household size - Other Race
Occupied housing units (%)
Vacant housing units (%)
Owner occupied housing units (%)
Renter occupied housing units (%)
Vacancy status - For rent (%)
Vacancy status - For sale only (%)
Vacancy status - Rented or sold, not occupied (%)
Vacancy status - For seasonal, recreational, or occasional use (%)
Vacancy status - For migrant workers (%)
Vacancy status - Other vacant (%)
Residents with income below the poverty level (%)
Residents with income below 50% of the poverty level (%)
Children below poverty level (%)
Poor families by family type - Married-couple family (%)
Poor families by family type - Male, no wife present (%)
Poor families by family type - Female, no husband present (%)
Poverty status for native-born residents (%)
Poverty status for foreign-born residents (%)
Poverty among high school graduates not in families (%)
Poverty among people who did not graduate high school not in families (%)
Residents with income below the poverty level (%) - White
Residents with income below the poverty level (%) - Black or African American
Residents with income below the poverty level (%) - Asian
Residents with income below the poverty level (%) - Hispanic or Latino
Residents with income below the poverty level (%) - American Indian and Alaska Native
Residents with income below the poverty level (%) - Multirace
Residents with income below the poverty level (%) - Other Race
Air pollution - Air Quality Index (AQI)
Air pollution - CO
Air pollution - NO2
Air pollution - SO2
Air pollution - Ozone
Air pollution - PM10
Air pollution - PM25
Air pollution - Pb
Crime - Murders per 100,000 population
Crime - Rapes per 100,000 population
Crime - Robberies per 100,000 population
Crime - Assaults per 100,000 population
Crime - Burglaries per 100,000 population
Crime - Thefts per 100,000 population
Crime - Auto thefts per 100,000 population
Crime - Arson per 100,000 population
Crime - City-data.com crime index
Crime - Violent crime index
Crime - Property crime index
Crime - Murders per 100,000 population (5 year average)
Crime - Rapes per 100,000 population (5 year average)
Crime - Robberies per 100,000 population (5 year average)
Crime - Assaults per 100,000 population (5 year average)
Crime - Burglaries per 100,000 population (5 year average)
Crime - Thefts per 100,000 population (5 year average)
Crime - Auto thefts per 100,000 population (5 year average)
Crime - Arson per 100,000 population (5 year average)
Crime - City-data.com crime index (5 year average)
Crime - Violent crime index (5 year average)
Crime - Property crime index (5 year average)
1996 Presidential Elections Results (%) - Democratic Party (Clinton)
1996 Presidential Elections Results (%) - Republican Party (Dole)
1996 Presidential Elections Results (%) - Other
2000 Presidential Elections Results (%) - Democratic Party (Gore)
2000 Presidential Elections Results (%) - Republican Party (Bush)
2000 Presidential Elections Results (%) - Other
2004 Presidential Elections Results (%) - Democratic Party (Kerry)
2004 Presidential Elections Results (%) - Republican Party (Bush)
2004 Presidential Elections Results (%) - Other
2008 Presidential Elections Results (%) - Democratic Party (Obama)
2008 Presidential Elections Results (%) - Republican Party (McCain)
2008 Presidential Elections Results (%) - Other
2012 Presidential Elections Results (%) - Democratic Party (Obama)
2012 Presidential Elections Results (%) - Republican Party (Romney)
2012 Presidential Elections Results (%) - Other
2016 Presidential Elections Results (%) - Democratic Party (Clinton)
2016 Presidential Elections Results (%) - Republican Party (Trump)
2016 Presidential Elections Results (%) - Other
2020 Presidential Elections Results (%) - Democratic Party (Biden)
2020 Presidential Elections Results (%) - Republican Party (Trump)
2020 Presidential Elections Results (%) - Other
Ancestries Reported - Arab (%)
Ancestries Reported - Czech (%)
Ancestries Reported - Danish (%)
Ancestries Reported - Dutch (%)
Ancestries Reported - English (%)
Ancestries Reported - French (%)
Ancestries Reported - French Canadian (%)
Ancestries Reported - German (%)
Ancestries Reported - Greek (%)
Ancestries Reported - Hungarian (%)
Ancestries Reported - Irish (%)
Ancestries Reported - Italian (%)
Ancestries Reported - Lithuanian (%)
Ancestries Reported - Norwegian (%)
Ancestries Reported - Polish (%)
Ancestries Reported - Portuguese (%)
Ancestries Reported - Russian (%)
Ancestries Reported - Scotch-Irish (%)
Ancestries Reported - Scottish (%)
Ancestries Reported - Slovak (%)
Ancestries Reported - Subsaharan African (%)
Ancestries Reported - Swedish (%)
Ancestries Reported - Swiss (%)
Ancestries Reported - Ukrainian (%)
Ancestries Reported - United States (%)
Ancestries Reported - Welsh (%)
Ancestries Reported - West Indian (%)
Ancestries Reported - Other (%)
Educational Attainment - No schooling completed (%)
Educational Attainment - Less than high school (%)
Educational Attainment - High school or equivalent (%)
Educational Attainment - Less than 1 year of college (%)
Educational Attainment - 1 or more years of college (%)
Educational Attainment - Associate degree (%)
Educational Attainment - Bachelor's degree (%)
Educational Attainment - Master's degree (%)
Educational Attainment - Professional school degree (%)
Educational Attainment - Doctorate degree (%)
School Enrollment - Nursery, preschool (%)
School Enrollment - Kindergarten (%)
School Enrollment - Grade 1 to 4 (%)
School Enrollment - Grade 5 to 8 (%)
School Enrollment - Grade 9 to 12 (%)
School Enrollment - College undergrad (%)
School Enrollment - Graduate or professional (%)
School Enrollment - Not enrolled in school (%)
School enrollment - Public schools (%)
School enrollment - Private schools (%)
School enrollment - Not enrolled (%)
Median number of rooms in houses and condos
Median number of rooms in apartments
Housing units lacking complete plumbing facilities (%)
Housing units lacking complete kitchen facilities (%)
Density of houses
Urban houses (%)
Rural houses (%)
Households with people 60 years and over (%)
Households with people 65 years and over (%)
Households with people 75 years and over (%)
Households with one or more nonrelatives (%)
Households with no nonrelatives (%)
Population in households (%)
Family households (%)
Nonfamily households (%)
Population in families (%)
Family households with own children (%)
Median number of bedrooms in owner occupied houses
Mean number of bedrooms in owner occupied houses
Median number of bedrooms in renter occupied houses
Mean number of bedrooms in renter occupied houses
Median number of vehichles in owner occupied houses
Mean number of vehichles in owner occupied houses
Median number of vehichles in renter occupied houses
Mean number of vehichles in renter occupied houses
Mortgage status - with mortgage (%)
Mortgage status - with second mortgage (%)
Mortgage status - with home equity loan (%)
Mortgage status - with both second mortgage and home equity loan (%)
Mortgage status - without a mortgage (%)
Average family size
Average family size - White
Average family size - Black or African American
Average family size - Asian
Average family size - Hispanic or Latino
Average family size - American Indian and Alaska Native
Average family size - Multirace
Average family size - Other Race
Geographical mobility - Same house 1 year ago (%)
Geographical mobility - Moved within same county (%)
Geographical mobility - Moved from different county within same state (%)
Geographical mobility - Moved from different state (%)
Geographical mobility - Moved from abroad (%)
Place of birth - Born in state of residence (%)
Place of birth - Born in other state (%)
Place of birth - Native, outside of US (%)
Place of birth - Foreign born (%)
Housing units in structures - 1, detached (%)
Housing units in structures - 1, attached (%)
Housing units in structures - 2 (%)
Housing units in structures - 3 or 4 (%)
Housing units in structures - 5 to 9 (%)
Housing units in structures - 10 to 19 (%)
Housing units in structures - 20 to 49 (%)
Housing units in structures - 50 or more (%)
Housing units in structures - Mobile home (%)
Housing units in structures - Boat, RV, van, etc. (%)
House/condo owner moved in on average (years ago)
Renter moved in on average (years ago)
Year householder moved into unit - Moved in 1999 to March 2000 (%)
Year householder moved into unit - Moved in 1995 to 1998 (%)
Year householder moved into unit - Moved in 1990 to 1994 (%)
Year householder moved into unit - Moved in 1980 to 1989 (%)
Year householder moved into unit - Moved in 1970 to 1979 (%)
Year householder moved into unit - Moved in 1969 or earlier (%)
Means of transportation to work - Drove car alone (%)
Means of transportation to work - Carpooled (%)
Means of transportation to work - Public transportation (%)
Means of transportation to work - Bus or trolley bus (%)
Means of transportation to work - Streetcar or trolley car (%)
Means of transportation to work - Subway or elevated (%)
Means of transportation to work - Railroad (%)
Means of transportation to work - Ferryboat (%)
Means of transportation to work - Taxicab (%)
Means of transportation to work - Motorcycle (%)
Means of transportation to work - Bicycle (%)
Means of transportation to work - Walked (%)
Means of transportation to work - Other means (%)
Working at home (%)
Industry diversity
Most Common Industries - Agriculture, forestry, fishing and hunting, and mining (%)
Most Common Industries - Agriculture, forestry, fishing and hunting (%)
Most Common Industries - Mining, quarrying, and oil and gas extraction (%)
Most Common Industries - Construction (%)
Most Common Industries - Manufacturing (%)
Most Common Industries - Wholesale trade (%)
Most Common Industries - Retail trade (%)
Most Common Industries - Transportation and warehousing, and utilities (%)
Most Common Industries - Transportation and warehousing (%)
Most Common Industries - Utilities (%)
Most Common Industries - Information (%)
Most Common Industries - Finance and insurance, and real estate and rental and leasing (%)
Most Common Industries - Finance and insurance (%)
Most Common Industries - Real estate and rental and leasing (%)
Most Common Industries - Professional, scientific, and management, and administrative and waste management services (%)
Most Common Industries - Professional, scientific, and technical services (%)
Most Common Industries - Management of companies and enterprises (%)
Most Common Industries - Administrative and support and waste management services (%)
Most Common Industries - Educational services, and health care and social assistance (%)
Most Common Industries - Educational services (%)
Most Common Industries - Health care and social assistance (%)
Most Common Industries - Arts, entertainment, and recreation, and accommodation and food services (%)
Most Common Industries - Arts, entertainment, and recreation (%)
Most Common Industries - Accommodation and food services (%)
Most Common Industries - Other services, except public administration (%)
Most Common Industries - Public administration (%)
Occupation diversity
Most Common Occupations - Management, business, science, and arts occupations (%)
Most Common Occupations - Management, business, and financial occupations (%)
Most Common Occupations - Management occupations (%)
Most Common Occupations - Business and financial operations occupations (%)
Most Common Occupations - Computer, engineering, and science occupations (%)
Most Common Occupations - Computer and mathematical occupations (%)
Most Common Occupations - Architecture and engineering occupations (%)
Most Common Occupations - Life, physical, and social science occupations (%)
Most Common Occupations - Education, legal, community service, arts, and media occupations (%)
Most Common Occupations - Community and social service occupations (%)
Most Common Occupations - Legal occupations (%)
Most Common Occupations - Education, training, and library occupations (%)
Most Common Occupations - Arts, design, entertainment, sports, and media occupations (%)
Most Common Occupations - Healthcare practitioners and technical occupations (%)
Most Common Occupations - Health diagnosing and treating practitioners and other technical occupations (%)
Most Common Occupations - Health technologists and technicians (%)
Most Common Occupations - Service occupations (%)
Most Common Occupations - Healthcare support occupations (%)
Most Common Occupations - Protective service occupations (%)
Most Common Occupations - Fire fighting and prevention, and other protective service workers including supervisors (%)
Most Common Occupations - Law enforcement workers including supervisors (%)
Most Common Occupations - Food preparation and serving related occupations (%)
Most Common Occupations - Building and grounds cleaning and maintenance occupations (%)
Most Common Occupations - Personal care and service occupations (%)
Most Common Occupations - Sales and office occupations (%)
Most Common Occupations - Sales and related occupations (%)
Most Common Occupations - Office and administrative support occupations (%)
Most Common Occupations - Natural resources, construction, and maintenance occupations (%)
Most Common Occupations - Farming, fishing, and forestry occupations (%)
Most Common Occupations - Construction and extraction occupations (%)
Most Common Occupations - Installation, maintenance, and repair occupations (%)
Most Common Occupations - Production, transportation, and material moving occupations (%)
Most Common Occupations - Production occupations (%)
Most Common Occupations - Transportation occupations (%)
Most Common Occupations - Material moving occupations (%)
People in Group quarters - Institutionalized population (%)
People in Group quarters - Correctional institutions (%)
People in Group quarters - Federal prisons and detention centers (%)
People in Group quarters - Halfway houses (%)
People in Group quarters - Local jails and other confinement facilities (including police lockups) (%)
People in Group quarters - Military disciplinary barracks (%)
People in Group quarters - State prisons (%)
People in Group quarters - Other types of correctional institutions (%)
People in Group quarters - Nursing homes (%)
People in Group quarters - Hospitals/wards, hospices, and schools for the handicapped (%)
People in Group quarters - Hospitals/wards and hospices for chronically ill (%)
People in Group quarters - Hospices or homes for chronically ill (%)
People in Group quarters - Military hospitals or wards for chronically ill (%)
People in Group quarters - Other hospitals or wards for chronically ill (%)
People in Group quarters - Hospitals or wards for drug/alcohol abuse (%)
People in Group quarters - Mental (Psychiatric) hospitals or wards (%)
People in Group quarters - Schools, hospitals, or wards for the mentally retarded (%)
People in Group quarters - Schools, hospitals, or wards for the physically handicapped (%)
People in Group quarters - Institutions for the deaf (%)
People in Group quarters - Institutions for the blind (%)
People in Group quarters - Orthopedic wards and institutions for the physically handicapped (%)
People in Group quarters - Wards in general hospitals for patients who have no usual home elsewhere (%)
People in Group quarters - Wards in military hospitals for patients who have no usual home elsewhere (%)
People in Group quarters - Juvenile institutions (%)
People in Group quarters - Long-term care (%)
People in Group quarters - Homes for abused, dependent, and neglected children (%)
People in Group quarters - Residential treatment centers for emotionally disturbed children (%)
People in Group quarters - Training schools for juvenile delinquents (%)
People in Group quarters - Short-term care, detention or diagnostic centers for delinquent children (%)
People in Group quarters - Type of juvenile institution unknown (%)
People in Group quarters - Noninstitutionalized population (%)
People in Group quarters - College dormitories (includes college quarters off campus) (%)
People in Group quarters - Military quarters (%)
People in Group quarters - On base (%)
People in Group quarters - Barracks, unaccompanied personnel housing (UPH), (Enlisted/Officer), ;and similar group living quarters for military personnel (%)
People in Group quarters - Transient quarters for temporary residents (%)
People in Group quarters - Military ships (%)
People in Group quarters - Group homes (%)
People in Group quarters - Homes or halfway houses for drug/alcohol abuse (%)
People in Group quarters - Homes for the mentally ill (%)
People in Group quarters - Homes for the mentally retarded (%)
People in Group quarters - Homes for the physically handicapped (%)
People in Group quarters - Other group homes (%)
People in Group quarters - Religious group quarters (%)
People in Group quarters - Dormitories (%)
People in Group quarters - Agriculture workers' dormitories on farms (%)
People in Group quarters - Job Corps and vocational training facilities (%)
People in Group quarters - Other workers' dormitories (%)
People in Group quarters - Crews of maritime vessels (%)
People in Group quarters - Other nonhousehold living situations (%)
People in Group quarters - Other noninstitutional group quarters (%)
Residents speaking English at home (%)
Residents speaking English at home - Born in the United States (%)
Residents speaking English at home - Native, born elsewhere (%)
Residents speaking English at home - Foreign born (%)
Residents speaking Spanish at home (%)
Residents speaking Spanish at home - Born in the United States (%)
Residents speaking Spanish at home - Native, born elsewhere (%)
Residents speaking Spanish at home - Foreign born (%)
Residents speaking other language at home (%)
Residents speaking other language at home - Born in the United States (%)
Residents speaking other language at home - Native, born elsewhere (%)
Residents speaking other language at home - Foreign born (%)
Class of Workers - Employee of private company (%)
Class of Workers - Self-employed in own incorporated business (%)
Class of Workers - Private not-for-profit wage and salary workers (%)
Class of Workers - Local government workers (%)
Class of Workers - State government workers (%)
Class of Workers - Federal government workers (%)
Class of Workers - Self-employed workers in own not incorporated business and Unpaid family workers (%)
House heating fuel used in houses and condos - Utility gas (%)
House heating fuel used in houses and condos - Bottled, tank, or LP gas (%)
House heating fuel used in houses and condos - Electricity (%)
House heating fuel used in houses and condos - Fuel oil, kerosene, etc. (%)
House heating fuel used in houses and condos - Coal or coke (%)
House heating fuel used in houses and condos - Wood (%)
House heating fuel used in houses and condos - Solar energy (%)
House heating fuel used in houses and condos - Other fuel (%)
House heating fuel used in houses and condos - No fuel used (%)
House heating fuel used in apartments - Utility gas (%)
House heating fuel used in apartments - Bottled, tank, or LP gas (%)
House heating fuel used in apartments - Electricity (%)
House heating fuel used in apartments - Fuel oil, kerosene, etc. (%)
House heating fuel used in apartments - Coal or coke (%)
House heating fuel used in apartments - Wood (%)
House heating fuel used in apartments - Solar energy (%)
House heating fuel used in apartments - Other fuel (%)
House heating fuel used in apartments - No fuel used (%)
Armed forces status - In Armed Forces (%)
Armed forces status - Civilian (%)
Armed forces status - Civilian - Veteran (%)
Armed forces status - Civilian - Nonveteran (%)
Fatal accidents locations in years 2005-2021
Fatal accidents locations in 2005
Fatal accidents locations in 2006
Fatal accidents locations in 2007
Fatal accidents locations in 2008
Fatal accidents locations in 2009
Fatal accidents locations in 2010
Fatal accidents locations in 2011
Fatal accidents locations in 2012
Fatal accidents locations in 2013
Fatal accidents locations in 2014
Fatal accidents locations in 2015
Fatal accidents locations in 2016
Fatal accidents locations in 2017
Fatal accidents locations in 2018
Fatal accidents locations in 2019
Fatal accidents locations in 2020
Fatal accidents locations in 2021
Alcohol use - People drinking some alcohol every month (%)
Alcohol use - People not drinking at all (%)
Alcohol use - Average days/month drinking alcohol
Alcohol use - Average drinks/week
Alcohol use - Average days/year people drink much
Audiometry - Average condition of hearing (%)
Audiometry - People that can hear a whisper from across a quiet room (%)
Audiometry - People that can hear normal voice from across a quiet room (%)
Audiometry - Ears ringing, roaring, buzzing (%)
Audiometry - Had a job exposure to loud noise (%)
Audiometry - Had off-work exposure to loud noise (%)
Blood Pressure & Cholesterol - Has high blood pressure (%)
Blood Pressure & Cholesterol - Checking blood pressure at home (%)
Blood Pressure & Cholesterol - Frequently checking blood cholesterol (%)
Blood Pressure & Cholesterol - Has high cholesterol level (%)
Consumer Behavior - Money monthly spent on food at supermarket/grocery store
Consumer Behavior - Money monthly spent on food at other stores
Consumer Behavior - Money monthly spent on eating out
Consumer Behavior - Money monthly spent on carryout/delivered foods
Consumer Behavior - Income spent on food at supermarket/grocery store (%)
Consumer Behavior - Income spent on food at other stores (%)
Consumer Behavior - Income spent on eating out (%)
Consumer Behavior - Income spent on carryout/delivered foods (%)
Current Health Status - General health condition (%)
Current Health Status - Blood donors (%)
Current Health Status - Has blood ever tested for HIV virus (%)
Current Health Status - Left-handed people (%)
Dermatology - People using sunscreen (%)
Diabetes - Diabetics (%)
Diabetes - Had a blood test for high blood sugar (%)
Diabetes - People taking insulin (%)
Diet Behavior & Nutrition - Diet health (%)
Diet Behavior & Nutrition - Milk product consumption (# of products/month)
Diet Behavior & Nutrition - Meals not home prepared (#/week)
Diet Behavior & Nutrition - Meals from fast food or pizza place (#/week)
Diet Behavior & Nutrition - Ready-to-eat foods (#/month)
Diet Behavior & Nutrition - Frozen meals/pizza (#/month)
Drug Use - People that ever used marijuana or hashish (%)
Drug Use - Ever used hard drugs (%)
Drug Use - Ever used any form of cocaine (%)
Drug Use - Ever used heroin (%)
Drug Use - Ever used methamphetamine (%)
Health Insurance - People covered by health insurance (%)
Kidney Conditions-Urology - Avg. # of times urinating at night
Medical Conditions - People with asthma (%)
Medical Conditions - People with anemia (%)
Medical Conditions - People with psoriasis (%)
Medical Conditions - People with overweight (%)
Medical Conditions - Elderly people having difficulties in thinking or remembering (%)
Medical Conditions - People who ever received blood transfusion (%)
Medical Conditions - People having trouble seeing even with glass/contacts (%)
Medical Conditions - People with arthritis (%)
Medical Conditions - People with gout (%)
Medical Conditions - People with congestive heart failure (%)
Medical Conditions - People with coronary heart disease (%)
Medical Conditions - People with angina pectoris (%)
Medical Conditions - People who ever had heart attack (%)
Medical Conditions - People who ever had stroke (%)
Medical Conditions - People with emphysema (%)
Medical Conditions - People with thyroid problem (%)
Medical Conditions - People with chronic bronchitis (%)
Medical Conditions - People with any liver condition (%)
Medical Conditions - People who ever had cancer or malignancy (%)
Mental Health - People who have little interest in doing things (%)
Mental Health - People feeling down, depressed, or hopeless (%)
Mental Health - People who have trouble sleeping or sleeping too much (%)
Mental Health - People feeling tired or having little energy (%)
Mental Health - People with poor appetite or overeating (%)
Mental Health - People feeling bad about themself (%)
Mental Health - People who have trouble concentrating on things (%)
Mental Health - People moving or speaking slowly or too fast (%)
Mental Health - People having thoughts they would be better off dead (%)
Oral Health - Average years since last visit a dentist
Oral Health - People embarrassed because of mouth (%)
Oral Health - People with gum disease (%)
Oral Health - General health of teeth and gums (%)
Oral Health - Average days a week using dental floss/device
Oral Health - Average days a week using mouthwash for dental problem
Oral Health - Average number of teeth
Pesticide Use - Households using pesticides to control insects (%)
Pesticide Use - Households using pesticides to kill weeds (%)
Physical Activity - People doing vigorous-intensity work activities (%)
Physical Activity - People doing moderate-intensity work activities (%)
Physical Activity - People walking or bicycling (%)
Physical Activity - People doing vigorous-intensity recreational activities (%)
Physical Activity - People doing moderate-intensity recreational activities (%)
Physical Activity - Average hours a day doing sedentary activities
Physical Activity - Average hours a day watching TV or videos
Physical Activity - Average hours a day using computer
Physical Functioning - People having limitations keeping them from working (%)
Physical Functioning - People limited in amount of work they can do (%)
Physical Functioning - People that need special equipment to walk (%)
Physical Functioning - People experiencing confusion/memory problems (%)
Physical Functioning - People requiring special healthcare equipment (%)
Prescription Medications - Average number of prescription medicines taking
Preventive Aspirin Use - Adults 40+ taking low-dose aspirin (%)
Reproductive Health - Vaginal deliveries (%)
Reproductive Health - Cesarean deliveries (%)
Reproductive Health - Deliveries resulted in a live birth (%)
Reproductive Health - Pregnancies resulted in a delivery (%)
Reproductive Health - Women breastfeeding newborns (%)
Reproductive Health - Women that had a hysterectomy (%)
Reproductive Health - Women that had both ovaries removed (%)
Reproductive Health - Women that have ever taken birth control pills (%)
Reproductive Health - Women taking birth control pills (%)
Reproductive Health - Women that have ever used Depo-Provera or injectables (%)
Reproductive Health - Women that have ever used female hormones (%)
Sexual Behavior - People 18+ that ever had sex (vaginal, anal, or oral) (%)
Sexual Behavior - Males 18+ that ever had vaginal sex with a woman (%)
Sexual Behavior - Males 18+ that ever performed oral sex on a woman (%)
Sexual Behavior - Males 18+ that ever had anal sex with a woman (%)
Sexual Behavior - Males 18+ that ever had any sex with a man (%)
Sexual Behavior - Females 18+ that ever had vaginal sex with a man (%)
Sexual Behavior - Females 18+ that ever performed oral sex on a man (%)
Sexual Behavior - Females 18+ that ever had anal sex with a man (%)
Sexual Behavior - Females 18+ that ever had any kind of sex with a woman (%)
Sexual Behavior - Average age people first had sex
Sexual Behavior - Average number of female sex partners in lifetime (males 18+)
Sexual Behavior - Average number of female vaginal sex partners in lifetime (males 18+)
Sexual Behavior - Average age people first performed oral sex on a woman (18+)
Sexual Behavior - Average number of woman performed oral sex on in lifetime (18+)
Sexual Behavior - Average number of male sex partners in lifetime (males 18+)
Sexual Behavior - Average number of male anal sex partners in lifetime (males 18+)
Sexual Behavior - Average age people first performed oral sex on a man (18+)
Sexual Behavior - Average number of male oral sex partners in lifetime (18+)
Sexual Behavior - People using protection when performing oral sex (%)
Sexual Behavior - Average number of times people have vaginal or anal sex a year
Sexual Behavior - People having sex without condom (%)
Sexual Behavior - Average number of male sex partners in lifetime (females 18+)
Sexual Behavior - Average number of male vaginal sex partners in lifetime (females 18+)
Sexual Behavior - Average number of female sex partners in lifetime (females 18+)
Sexual Behavior - Circumcised males 18+ (%)
Sleep Disorders - Average hours sleeping at night
Sleep Disorders - People that has trouble sleeping (%)
Smoking-Cigarette Use - People smoking cigarettes (%)
Taste & Smell - People 40+ having problems with smell (%)
Taste & Smell - People 40+ having problems with taste (%)
Taste & Smell - People 40+ that ever had wisdom teeth removed (%)
Taste & Smell - People 40+ that ever had tonsils teeth removed (%)
Taste & Smell - People 40+ that ever had a loss of consciousness because of a head injury (%)
Taste & Smell - People 40+ that ever had a broken nose or other serious injury to face or skull (%)
Taste & Smell - People 40+ that ever had two or more sinus infections (%)
Weight - Average height (inches)
Weight - Average weight (pounds)
Weight - Average BMI
Weight - People that are obese (%)
Weight - People that ever were obese (%)
Weight - People trying to lose weight (%)
Urban population: 38,171
Rural population: 31,928
Estimated median house/condo value in 2022: $300,741
78640:
$300,741Texas:
$275,400
According to our research of Texas and other state lists, there were 119 registered sex offenders living in 78640 zip code as of April 24, 2024 . The ratio of all residents to sex offenders in zip code 78640 is 416 to 1.The ratio of registered sex offenders to all residents in this zip code is near the state average.
Median resident age: This zip code:
33.4 yearsTexas median age:
35.6 years
Average household size: This zip code:
2.9 peopleTexas:
2.6 people
Averages for the 2020 tax year for zip code 78640, filed in 2021:
Average Adjusted Gross Income (AGI) in 2020: $55,354 (Individual Income Tax Returns) Here:
$55,354State:
$77,054
Salary/wage: $51,352 (reported on 87.1% of returns )Here:
$51,352State:
$62,766
(% of AGI for various income ranges: 1204.8% for AGIs below $25k , 3735.1% for AGIs $25k-50k , 6772.5% for AGIs $50k-75k , 10003.2% for AGIs $75k-100k , 17759.0% for AGIs $100k-200k , 55871.8% for AGIs over 200k ) Taxable interest for individuals: $668 (reported on 17.1% of returns )This zip code:
$668Texas:
$2,665
(% of AGI for various income ranges: 6.7% for AGIs below $25k , 5.8% for AGIs $25k-50k , 11.9% for AGIs $50k-75k , 20.1% for AGIs $75k-100k , 29.2% for AGIs $100k-200k , 600.0% for AGIs over 200k ) Ordinary dividends: $2,386 (reported on 8.1% of returns )(% of AGI for various income ranges: 7.1% for AGIs below $25k , 8.7% for AGIs $25k-50k , 16.2% for AGIs $50k-75k , 27.5% for AGIs $75k-100k , 80.5% for AGIs $100k-200k , 991.8% for AGIs over 200k ) Net capital gain/loss in AGI: +$13,803 (reported on 8.1% of returns )Here:
+$13,803State:
+$39,590
(% of AGI for various income ranges: 4.1% for AGIs below $25k , 6.0% for AGIs $25k-50k , 28.7% for AGIs $50k-75k , 59.4% for AGIs $75k-100k , 234.0% for AGIs $100k-200k , 15755.3% for AGIs over 200k ) Profit/loss from business: +$12,013 (reported on 18.5% of returns )Here:
+$12,013State:
+$10,888
(% of AGI for various income ranges: 217.8% for AGIs below $25k , 233.3% for AGIs $25k-50k , 270.3% for AGIs $50k-75k , 334.3% for AGIs $75k-100k , 543.7% for AGIs $100k-200k , 2672.9% for AGIs over 200k ) Taxable individual retirement arrangement distribution: $17,261 (reported on 3.8% of returns )78640:
$17,261Texas:
$24,740
(% of AGI for various income ranges: 20.3% for AGIs below $25k , 33.7% for AGIs $25k-50k , 55.9% for AGIs $50k-75k , 154.0% for AGIs $75k-100k , 290.5% for AGIs $100k-200k , 2244.1% for AGIs over 200k ) Total itemized deductions: $24,245 (reported on 5.5% of returns )Here:
$24,245State:
$40,428
(% of AGI for various income ranges: 27.5% for AGIs below $25k , 89.5% for AGIs $25k-50k , 241.5% for AGIs $50k-75k , 307.8% for AGIs $75k-100k , 446.3% for AGIs $100k-200k , 2846.5% for AGIs over 200k ) Charity contributions: $6,852 (reported on 3.5% of returns )(% of AGI for various income ranges: 1.5% for AGIs below $25k , 7.3% for AGIs $25k-50k , 29.2% for AGIs $50k-75k , 45.6% for AGIs $75k-100k , 114.9% for AGIs $100k-200k , 1095.9% for AGIs over 200k ) Taxes paid: $6,986 (reported on 5.3% of returns )(% of AGI for various income ranges: 5.9% for AGIs below $25k , 24.2% for AGIs $25k-50k , 72.9% for AGIs $50k-75k , 93.3% for AGIs $75k-100k , 123.1% for AGIs $100k-200k , 655.3% for AGIs over 200k ) Earned income credit: $2,434 (reported on 16.9% of returns )(% of AGI for various income ranges: 104.5% for AGIs below $25k , 72.3% for AGIs $25k-50k , 1.6% for AGIs $50k-75k ) Percentage of individuals using paid preparers for their 2020 taxes: 91.8%(% for various income ranges: 89.1% for AGIs below $25k , 93.0% for AGIs $25k-50k , 92.4% for AGIs $50k-75k , 92.6% for AGIs $75k-100k , 93.1% for AGIs $100k-200k , 94.3% for AGIs over 200k )
Averages for the 2012 tax year for zip code 78640, filed in 2013:
Average Adjusted Gross Income (AGI) in 2012: $46,468 (Individual Income Tax Returns) Here:
$46,468State:
$65,384
Salary/wage: $43,902 (reported on 90.2% of returns )Here:
$43,902State:
$52,524
(% of AGI for various income ranges: 81.4% for AGIs below $25k , 87.9% for AGIs $25k-50k , 88.3% for AGIs $50k-75k , 87.2% for AGIs $75k-100k , 84.4% for AGIs $100k-200k , 57.2% for AGIs over 200k ) Taxable interest for individuals: $704 (reported on 18.0% of returns )This zip code:
$704Texas:
$2,372
(% of AGI for various income ranges: 0.3% for AGIs below $25k , 0.2% for AGIs $25k-50k , 0.2% for AGIs $50k-75k , 0.2% for AGIs $75k-100k , 0.2% for AGIs $100k-200k , 1.8% for AGIs over 200k ) Ordinary dividends: $2,394 (reported on 7.3% of returns )(% of AGI for various income ranges: 0.5% for AGIs below $25k , 0.2% for AGIs $25k-50k , 0.3% for AGIs $50k-75k , 0.2% for AGIs $75k-100k , 0.5% for AGIs $100k-200k , 1.5% for AGIs over 200k ) Net capital gain/loss in AGI: +$4,756 (reported on 5.8% of returns )Here:
+$4,756State:
+$35,319
(% of AGI for various income ranges: 0.2% for AGIs $50k-75k , 0.4% for AGIs $75k-100k , 1.1% for AGIs $100k-200k , 6.1% for AGIs over 200k ) Profit/loss from business: +$10,561 (reported on 16.8% of returns )Here:
+$10,561State:
+$13,732
(% of AGI for various income ranges: 11.3% for AGIs below $25k , 3.9% for AGIs $25k-50k , 2.0% for AGIs $50k-75k , 2.2% for AGIs $75k-100k , 2.7% for AGIs $100k-200k , 9.2% for AGIs over 200k ) Taxable individual retirement arrangement distribution: $12,784 (reported on 4.3% of returns )78640:
$12,784Texas:
$19,511
(% of AGI for various income ranges: 0.9% for AGIs below $25k , 0.7% for AGIs $25k-50k , 1.2% for AGIs $50k-75k , 1.1% for AGIs $75k-100k , 2.0% for AGIs $100k-200k ) Self-employment retirement plans: $13,300 (reported on 0.1% of returns )78640:
$13,300Texas:
$23,938
Total itemized deductions: $16,286 (21% of AGI, reported on 27.1% of returns )Here:
$16,286State:
$24,724
Here:
21.4% of AGIState:
15.9% of AGI
(% of AGI for various income ranges: 5.0% for AGIs below $25k , 8.5% for AGIs $25k-50k , 10.8% for AGIs $50k-75k , 10.6% for AGIs $75k-100k , 10.5% for AGIs $100k-200k , 7.7% for AGIs over 200k ) Charity contributions: $2,737 (reported on 17.7% of returns )(% of AGI for various income ranges: 0.3% for AGIs below $25k , 0.6% for AGIs $25k-50k , 1.1% for AGIs $50k-75k , 1.2% for AGIs $75k-100k , 1.5% for AGIs $100k-200k , 1.6% for AGIs over 200k ) Taxes paid: $4,844 (reported on 26.6% of returns )(% of AGI for various income ranges: 1.3% for AGIs below $25k , 2.4% for AGIs $25k-50k , 3.0% for AGIs $50k-75k , 3.1% for AGIs $75k-100k , 3.3% for AGIs $100k-200k , 2.8% for AGIs over 200k ) Earned income credit: $2,469 (reported on 22.3% of returns )(% of AGI for various income ranges: 8.5% for AGIs below $25k , 1.5% for AGIs $25k-50k ) Percentage of individuals using paid preparers for their 2012 taxes: 34.9%(% for various income ranges: 34.7% for AGIs below $25k , 34.2% for AGIs $25k-50k , 34.1% for AGIs $50k-75k , 35.0% for AGIs $75k-100k , 37.8% for AGIs $100k-200k , 66.7% for AGIs over 200k )
Averages for the 2004 tax year for zip code 78640, filed in 2005:
Average Adjusted Gross Income (AGI) in 2004: $40,948 (Individual Income Tax Returns) Here:
$40,948State:
$47,881
Salary/wage: $39,257 (reported on 92.8% of returns )Here:
$39,257State:
$41,947
(% of AGI for various income ranges: 131.2% for AGIs below $10k , 87.3% for AGIs $10k-25k , 92.4% for AGIs $25k-50k , 91.9% for AGIs $50k-75k , 91.6% for AGIs $75k-100k , 72.9% for AGIs over 100k ) Taxable interest for individuals: $691 (reported on 23.9% of returns )This zip code:
$691Texas:
$2,255
(% of AGI for various income ranges: 1.4% for AGIs below $10k , 0.4% for AGIs $10k-25k , 0.3% for AGIs $25k-50k , 0.3% for AGIs $50k-75k , 0.4% for AGIs $75k-100k , 0.8% for AGIs over 100k ) Taxable dividends: $1,056 (reported on 8.8% of returns )(% of AGI for various income ranges: 0.7% for AGIs below $10k , 0.2% for AGIs $10k-25k , 0.1% for AGIs $25k-50k , 0.1% for AGIs $50k-75k , 0.2% for AGIs $75k-100k , 0.6% for AGIs over 100k ) Net capital gain/loss: +$9,653 (reported on 8.3% of returns )Here:
+$9,653State:
+$16,110
(% of AGI for various income ranges: -0.5% for AGIs below $10k , 0.1% for AGIs $10k-25k , 0.1% for AGIs $25k-50k , 0.4% for AGIs $50k-75k , 0.7% for AGIs $75k-100k , 10.8% for AGIs over 100k ) Profit/loss from business: +$8,240 (reported on 15.8% of returns )Here:
+$8,240State:
+$11,013
(% of AGI for various income ranges: 14.2% for AGIs below $10k , 7.1% for AGIs $10k-25k , 2.8% for AGIs $25k-50k , 2.0% for AGIs $50k-75k , 2.2% for AGIs $75k-100k , 3.6% for AGIs over 100k ) IRA payment deduction: $2,436 (reported on 1.4% of returns )(% of AGI for various income ranges: 0.0% for AGIs $10k-25k , 0.1% for AGIs $25k-50k , 0.1% for AGIs $50k-75k , 0.1% for AGIs $75k-100k , 0.1% for AGIs over 100k ) Self-employed pension: $11,500 (reported on 0.2% of returns )Here:
$11,500Texas:
$16,401
Total itemized deductions: $15,490 (24% of AGI, reported on 34.9% of returns )Here:
$15,490State:
$19,631
Here:
24.2% of AGIState:
18.9% of AGI
(% of AGI for various income ranges: 9.5% for AGIs below $10k , 6.5% for AGIs $10k-25k , 15.2% for AGIs $25k-50k , 13.9% for AGIs $50k-75k , 14.5% for AGIs $75k-100k , 11.7% for AGIs over 100k ) Charity contributions deductions: $2,002 (3% of AGI, reported on 24.7% of returns )Here:
2.9% of AGIState:
4.2% of AGI
(% of AGI for various income ranges: 0.3% for AGIs below $10k , 0.5% for AGIs $10k-25k , 0.8% for AGIs $25k-50k , 1.2% for AGIs $50k-75k , 1.5% for AGIs $75k-100k , 2.2% for AGIs over 100k ) Total tax: $4,680 (reported on 74.8% of returns )(% of AGI for various income ranges: 4.0% for AGIs below $10k , 3.9% for AGIs $10k-25k , 6.0% for AGIs $25k-50k , 8.0% for AGIs $50k-75k , 9.9% for AGIs $75k-100k , 15.6% for AGIs over 100k ) Earned income credit: $1,906 (reported on 19.9% of returns )Percentage of individuals using paid preparers for their 2004 taxes: 45.4%(% for various income ranges: 43.4% for AGIs below $10k , 52.4% for AGIs $10k-25k , 46.8% for AGIs $25k-50k , 39.8% for AGIs $50k-75k , 36.8% for AGIs $75k-100k , 43.9% for AGIs over 100k )
Estimated median household income in 2022: This zip code:
$82,874Texas:
$72,284
Nearest zip codes: 78610 ,
78656 ,
78652 ,
78747 ,
78748 ,
78666 .
Niederwald Zip Code Map
Percentage of family households: This zip code:
59.1%Texas:
50.5%
Percentage of households with unmarried partners: This zip code:
4.7%Texas:
48.7%
Likely homosexual households (counted as self-reported same-sex unmarried-partner households)
Lesbian couples: 0.2% of all households Gay men: 0.0% of all households
Household received Food Stamps/SNAP in the past 12 months: 2,111Household did not receive Food Stamps/SNAP in the past 12 months: 21,945
Women who had a birth in the past 12 months: 1,160 (1,128 now married , 50 unmarried) Women who did not have a birth in the past 12 months: 17,040 (7,226 now married , 9,822 unmarried)
Housing units in zip code 78640 with a mortgage: 11,911 (172
second mortgage , 98
both second mortgage and home equity loan )
Houses without a mortgage: 132
Median monthly owner costs for units with a mortgage: $1,815
Median monthly owner costs for units without a mortgage: $711
Residents with income below the poverty level in 2022:
This zip code:
9.7%Whole state:
14.0%
Residents with income below 50% of the poverty level in 2022:
This zip code:
5.4%Whole state:
7.4%
Median number of rooms in houses and condos: Median number of rooms in apartments: Notable locations in this zip code not listed on our city pages
Click to draw/clear zip code borders Notable locations in zip code 78640: (A) , Gregg Ranch (B) , Kuykendall Ranch (C) , Michaelis Ranch (D) , Claiborne Kyle Log House (E) , Chisholm Trail Fire and Rescue Station 1 (F) , Kyle Volunteer Fire Department Station 1 (G) , Kyle Volunteer Fire Department Station 2 (H) , Uhland Volunteer Fire Department (I) , Kyle Volunteer Fire Department Station 3 (J) , Chisholm Trail Fire and Rescue Station 4 (K) , Claiborne Kyle Log House (L) . Display/hide their locations on the map
Churches in zip code 78640 include: (A) , First Baptist Church (B) , Martin Church (C) . Display/hide their locations on the map
Cemeteries: (1) , Kyle Cemetery (2) , Martin Church Cemetery (3) , San Vincente Cemetery (4) , Live Oak Cemetery (5) . Display/hide their locations on the map
Reservoirs: (A) , Lutranger Lake (B) , M D Heatly Reservoir (C) , Soil Conservation Service Site 4 Reservoir (D) , Soil Conservation Service Site 3 Reservoir (E) , Soil Conservation Service Site 2 Reservoir (F) , Soil Conservation Service Site 1 Reservoir (G) , Barron Lake (H) . Display/hide their locations on the map
Streams, rivers, and creeks: (A) , Richmond Branch (B) , Porter Creek (C) , Halifax Creek (D) , Bunton Branch (E) , Andrews Branch (F) . Display/hide their locations on the map
Park in zip code 78640: (1) . Display/hide its location on the map
Year house built (houses)
711 2020 or later9,721 2010 to 20199,759 2000 to 20092,924 1990 to 19991,101 1980 to 1989511 1970 to 1979487 1960 to 196954 1950 to 19597 1940 to 1949224 1939 or earlier
Zip code 78640 household income distribution in 2022 848 Less than $10,000338 $10,000 to $14,999466 $15,000 to $19,999467 $20,000 to $24,999720 $25,000 to $29,9991,447 $30,000 to $34,999532 $35,000 to $39,999733 $40,000 to $44,9991,256 $45,000 to $49,9991,122 $50,000 to $59,9992,806 $60,000 to $74,9994,506 $75,000 to $99,9993,574 $100,000 to $124,9991,890 $125,000 to $149,9991,953 $150,000 to $199,9991,406 $200,000 or moreEstimate of home value of owner-occupied houses/condos in 2022 in zip code 78640 304 Less than $10,000127 $10,000 to $14,99983 $15,000 to $19,9992 $20,000 to $24,99946 $25,000 to $29,99940 $30,000 to $34,99972 $40,000 to $49,999120 $50,000 to $59,99952 $60,000 to $69,999117 $70,000 to $79,999380 $80,000 to $89,999182 $90,000 to $99,999668 $100,000 to $124,999295 $125,000 to $149,999428 $150,000 to $174,999537 $175,000 to $199,9993,117 $200,000 to $249,9994,204 $250,000 to $299,9993,898 $300,000 to $399,9991,413 $400,000 to $499,999593 $500,000 to $749,999149 $750,000 to $999,999131 $1,000,000 to $1,499,9992 $1,500,000 to $1,999,9994 $2,000,000 or moreRent paid by renters in 2022 in zip code 78640 114 $300 to $3493 $350 to $39926 $400 to $4495 $450 to $499171 $550 to $599244 $650 to $699132 $700 to $749341 $800 to $899173 $900 to $9991,216 $1,000 to $1,2491,614 $1,250 to $1,4992,938 $1,500 to $1,99994 $2,000 to $2,49926 $2,500 to $2,999138 No cash rent
Median gross rent in 2022: $1,545.
Median price asked for vacant for-sale houses and condos in 2022: $435,360.
Estimated median house (or condo) value in 2022 for: White Non-Hispanic householders: $405,617Black or African American householders: $424,253American Indian or Alaska Native householders: $344,226Asian householders: $593,809Some other race householders: $326,686Two or more races householders: $322,301Hispanic or Latino householders: $313,165Estimated median house or condo value in 2022: $300,741
78640:
$300,741Texas:
$275,400
Lower value quartile - upper value quartile: $236,485 - $375,080
Mean price in 2022: Detached houses: $334,449Here:
$334,449State:
$369,058
Townhouses or other attached units: $198,543Here:
$198,543State:
$327,631
Mobile homes: $137,334Here:
$137,334State:
$124,413
Housing units in structures:
One, detached: 16,695One, attached: 413Two: 1023 or 4: 785 to 9: 24510 to 19: 1,15420 to 49: 94850 or more: 939Mobile homes: 3,809Unemployment : 3.1%
Means of transportation to work in zip code 78640 75.6% 27,396 Drove a car alone11.4% 4,115 Carpooled0.1% 28 Bus or trolley bus0.2% 55 Taxi0.2% 58 Motorcycle0.1% 31 Bicycle0.4% 163 Walked1.0% 349 Other means9.9% 3,591 Worked at homeTravel time to work (commute) in zip code 78640 643 Less than 5 minutes1,694 5 to 9 minutes1,982 10 to 14 minutes2,967 15 to 19 minutes4,181 20 to 24 minutes1,274 25 to 29 minutes3,910 30 to 34 minutes1,065 35 to 39 minutes2,071 40 to 44 minutes5,791 45 to 59 minutes4,121 60 to 89 minutes2,479 90 or more minutes
Percentage of zip code residents living and working in this county: 42.5%
Household type by relationship:
Households: 70,100
Male householders: 11,898 (2,468 living alone ), Female householders: 12,200 (2,350 living alone )12,577 spouses (12,494 opposite-sex spouses ), 2,770 unmarried partners , (2,676 opposite-sex unmarried partners ), 23,930 children (21,894 natural , 382 adopted , 1,656 stepchildren ), 2,248 grandchildren , 844 brothers or sisters , 814 parents , 255 foster children , 729 other relatives , 1,374 non-relatives In group quarters: 528 (-1 institutionalized population )
Size of family households: 5,818 2-persons , 3,737 3-persons , 3,760 4-persons , 1,554 5-persons , 978 6-persons , 1,299 7-or-more-persons
Size of nonfamily households: 4,818 1-person , 1,810 2-persons , 284 3-persons
12,462 married couples with children. single-parent households (1,372 men , 2,616 women ).
59.9% of residents of 78640 zip code speak English at home. of residents speak Spanish at home (60% very well, 26% well, 12% not well, 2% not at all ).of residents speak other Indo-European language at home (98% very well, 2% well ).of residents speak Asian or Pacific Island language at home (73% very well, 21% well, 6% not well ).of residents speak other language at home (90% very well, 5% well, 5% not well ).
Foreign born population: 8,861 (12.6%)
(40.7%
of them are naturalized citizens )
This zip code:
12.6%Whole state:
17.2%
71% Honduras 5% Dominica 3% El Salvador 3% Guatemala 2% Malaysia 2% Chile 1% Sweden 4% German 4% English 3% Irish 3% American 2% European 1% African 1% Italian
Year of entry for the foreign-born population
1,415 2010 or later 3,678 2000 to 2009 2,602 1990 to 1999 2,499 Before 1990
Housing units lacking complete plumbing facilities: 0.6%
Housing units lacking complete kitchen facilities: 0.9%
59.0% Electricity 37.0% Utility gas 3.1% Bottled, tank, or LP gas 0.5% Other fuel
Population in 1990: 8,770. Population change in the 1990s: +7,231 (+82.5%).
Place of birth for U.S.-born residents:
This state: 44,279Northeast: 1,957Midwest: 4,261South: 3,883West: 4,971
44% of the 78640 zip code residents lived in the same house 5 years ago.
Out of people who lived in different houses, 25% lived in this county.
Out of people who lived in different counties, 50% lived in Texas.
90% of the 78640 zip code residents lived in the same house 1 year ago.
Out of people who lived in different houses, 28% moved from this county.
Out of people who lived in different houses, 59% moved from different county within same state.
Out of people who lived in different houses, 14% moved from different state.
Out of people who lived in different houses, 3% moved from abroad.
Private vs. public school enrollment:
Students in private schools in grades 1 to 8 (elementary and middle school): 1,283
Students in private schools in grades 9 to 12 (high school): 251
Students in private undergraduate colleges: 428
Occupation by median earnings in the past 12 months ($)
86,647 Architecture and engineering occupations 69,225 Computer and mathematical occupations 69,021 Legal occupations 65,262 Law enforcement workers including supervisors 65,091 Management occupations 57,353 Installation, maintenance, and repair occupations
Companies with federal contracts located in this zip code:
ROBERT E STASULLI (521 EMERALD FIELDS LN in KYLE, TX) in 2 contracts in 2005
$27,319 with Air Force for Other Housekeeping Services. Signed on 2005-10-01. Completion date: 2006-09-30.
, same as above. Signed on 2005-11-09. Completion date: 2006-09-30.
JEAN WINN (704 BLANCO ST in KYLE, TX; small business) in 2 contracts in 2004
$11,658 with Army for Guard Services. Signed on 2004-03-16. Completion date: 2003-04-01.
, same as above. Signed on 2004-03-16. Completion date: 2003-04-01.
Top industries in this zip code by the number of employees in 2005:
Administrative and Support and Waste Management and Remediation Services: Armored Car Services (100-249 employees: 1 establishment)Health Care and Social Assistance: Child Day Care Services (50-99: 1, 10-19: 3, 5-9: 1, 1-4: 2)Accommodation and Food Services: Limited-Service Restaurants (20-49: 2, 10-19: 1, 5-9: 1, 1-4: 2)Accommodation and Food Services: Full-Service Restaurants (20-49: 2, 5-9: 1, 1-4: 2)Construction: Structural Steel and Precast Concrete Contractors (50-99: 1)Utilities: Electric Power Distribution (50-99: 1)Other Services (except Public Administration): Religious Organizations (20-49: 1, 10-19: 1, 5-9: 2, 1-4: 3)
People in group quarters in 2010:
388 people in state prisons
3 people in group homes intended for adults
People in group quarters in 2000:
515 people in halfway houses
Fatal accident statistics in 2014:
Fatal accident count: 4Vehicles involved in fatal accidents: 5Fatal accidents caused by drunken drivers: 1Fatalities: 4Persons involved in fatal accidents: 13Pedestrians involved in fatal accidents: 0
Fatal accident statistics in 2013:
Fatal accident count: 3Vehicles involved in fatal accidents: 6Fatal accidents caused by drunken drivers: 0Fatalities: 3Persons involved in fatal accidents: 6Pedestrians involved in fatal accidents: 1
Home Mortgage Disclosure Act Aggregated Statistics For Year 2009(Based on 6 partial tracts) A) FHA, FSA/RHS & VA B) Conventional C) Refinancings D) Home Improvement Loans F) Non-occupant Loans on G) Loans On Manufactured Number Average Value Number Average Value Number Average Value Number Average Value Number Average Value Number Average Value
LOANS ORIGINATED 1,074 $150,403 371 $129,818 966 $145,328 32 $41,644 92 $111,033 64 $67,415 APPLICATIONS APPROVED, NOT ACCEPTED 47 $140,354 38 $119,545 160 $138,484 8 $45,256 13 $133,869 16 $63,830 APPLICATIONS DENIED 236 $148,122 86 $99,307 463 $135,085 122 $25,326 69 $117,779 70 $46,142 APPLICATIONS WITHDRAWN 122 $153,224 71 $129,319 387 $141,936 26 $50,848 25 $96,894 8 $60,280 FILES CLOSED FOR INCOMPLETENESS 13 $143,424 8 $151,718 65 $138,348 5 $36,516 3 $90,780 7 $58,509
Aggregated Statistics For Year 2008(Based on 6 partial tracts) A) FHA, FSA/RHS & VA B) Conventional C) Refinancings D) Home Improvement Loans F) Non-occupant Loans on G) Loans On Manufactured Number Average Value Number Average Value Number Average Value Number Average Value Number Average Value Number Average Value
LOANS ORIGINATED 966 $154,928 676 $131,466 444 $140,799 89 $27,086 146 $131,535 73 $77,104 APPLICATIONS APPROVED, NOT ACCEPTED 44 $143,387 81 $127,764 102 $128,800 16 $29,768 13 $167,155 30 $66,820 APPLICATIONS DENIED 186 $156,057 186 $117,417 501 $137,462 244 $30,209 54 $133,507 91 $45,280 APPLICATIONS WITHDRAWN 171 $156,605 137 $140,645 219 $152,300 34 $59,553 48 $120,829 12 $63,941 FILES CLOSED FOR INCOMPLETENESS 22 $141,985 29 $166,633 49 $157,356 13 $59,665 14 $115,892 11 $45,897
Aggregated Statistics For Year 2007(Based on 6 partial tracts) A) FHA, FSA/RHS & VA B) Conventional C) Refinancings D) Home Improvement Loans E) Loans on Dwellings For 5+ Families F) Non-occupant Loans on G) Loans On Manufactured Number Average Value Number Average Value Number Average Value Number Average Value Number Average Value Number Average Value Number Average Value
LOANS ORIGINATED 565 $146,713 1,663 $117,049 377 $127,814 87 $38,888 0 $0 273 $101,401 86 $60,171 APPLICATIONS APPROVED, NOT ACCEPTED 33 $139,886 208 $94,245 105 $113,311 32 $33,892 0 $0 34 $84,884 39 $52,976 APPLICATIONS DENIED 100 $144,979 377 $111,334 594 $120,298 219 $39,697 0 $0 88 $109,099 106 $64,954 APPLICATIONS WITHDRAWN 103 $147,603 258 $133,881 287 $124,818 32 $129,623 1 $8,881,240 36 $123,156 19 $64,274 FILES CLOSED FOR INCOMPLETENESS 11 $141,059 54 $129,098 72 $136,848 5 $66,228 0 $0 13 $138,515 2 $57,795
Aggregated Statistics For Year 2006(Based on 6 partial tracts) A) FHA, FSA/RHS & VA B) Conventional C) Refinancings D) Home Improvement Loans F) Non-occupant Loans on G) Loans On Manufactured Number Average Value Number Average Value Number Average Value Number Average Value Number Average Value Number Average Value
LOANS ORIGINATED 586 $137,079 2,285 $96,423 315 $122,896 83 $37,547 573 $92,410 110 $70,276 APPLICATIONS APPROVED, NOT ACCEPTED 24 $126,315 296 $91,343 92 $112,466 30 $30,847 43 $74,640 44 $51,915 APPLICATIONS DENIED 61 $116,107 434 $88,739 485 $114,601 236 $32,519 108 $74,674 146 $48,704 APPLICATIONS WITHDRAWN 116 $138,053 444 $105,757 333 $117,667 30 $52,331 93 $91,092 16 $68,130 FILES CLOSED FOR INCOMPLETENESS 4 $143,120 50 $113,048 85 $125,314 8 $81,910 14 $93,705 1 $90,820
Aggregated Statistics For Year 2005(Based on 6 partial tracts) A) FHA, FSA/RHS & VA B) Conventional C) Refinancings D) Home Improvement Loans F) Non-occupant Loans on G) Loans On Manufactured Number Average Value Number Average Value Number Average Value Number Average Value Number Average Value Number Average Value
LOANS ORIGINATED 717 $133,434 1,871 $89,222 517 $121,150 74 $52,740 572 $85,359 118 $76,866 APPLICATIONS APPROVED, NOT ACCEPTED 42 $129,385 178 $84,450 93 $105,236 36 $43,211 27 $89,701 71 $52,561 APPLICATIONS DENIED 104 $121,666 498 $72,106 746 $109,327 211 $32,157 146 $65,810 187 $53,024 APPLICATIONS WITHDRAWN 120 $134,964 321 $99,512 361 $132,503 41 $148,276 90 $98,453 21 $69,007 FILES CLOSED FOR INCOMPLETENESS 4 $81,820 43 $81,431 189 $138,678 1 $143,400 8 $77,355 4 $53,425
Aggregated Statistics For Year 2004(Based on 6 partial tracts) A) FHA, FSA/RHS & VA B) Conventional C) Refinancings D) Home Improvement Loans F) Non-occupant Loans on G) Loans On Manufactured Number Average Value Number Average Value Number Average Value Number Average Value Number Average Value Number Average Value
LOANS ORIGINATED 852 $129,713 1,354 $93,966 779 $120,927 68 $36,617 369 $98,998 161 $70,635 APPLICATIONS APPROVED, NOT ACCEPTED 48 $126,630 208 $79,299 161 $118,654 17 $23,466 33 $83,944 80 $47,602 APPLICATIONS DENIED 175 $127,099 427 $73,038 794 $105,396 175 $30,423 56 $85,136 242 $47,155 APPLICATIONS WITHDRAWN 159 $127,697 239 $99,578 471 $115,228 23 $51,288 49 $97,327 38 $77,503 FILES CLOSED FOR INCOMPLETENESS 16 $115,828 32 $157,954 180 $124,819 1 $57,110 7 $137,683 4 $37,288
Aggregated Statistics For Year 2003(Based on 6 partial tracts) A) FHA, FSA/RHS & VA B) Conventional C) Refinancings D) Home Improvement Loans F) Non-occupant Loans on Number Average Value Number Average Value Number Average Value Number Average Value Number Average Value
LOANS ORIGINATED 896 $130,663 829 $104,036 1,361 $117,952 65 $26,059 114 $101,341 APPLICATIONS APPROVED, NOT ACCEPTED 36 $115,113 97 $90,350 196 $110,710 6 $33,753 18 $116,709 APPLICATIONS DENIED 207 $130,793 358 $75,104 770 $103,682 146 $21,371 32 $74,171 APPLICATIONS WITHDRAWN 155 $132,192 184 $109,057 528 $107,069 21 $34,631 19 $63,764 FILES CLOSED FOR INCOMPLETENESS 32 $137,326 41 $158,957 69 $128,611 4 $69,340 4 $230,962
Aggregated Statistics For Year 2002(Based on 6 partial tracts) A) FHA, FSA/RHS & VA B) Conventional C) Refinancings D) Home Improvement Loans F) Non-occupant Loans on Number Average Value Number Average Value Number Average Value Number Average Value Number Average Value
LOANS ORIGINATED 799 $130,524 696 $108,570 786 $117,044 128 $16,679 75 $97,547 APPLICATIONS APPROVED, NOT ACCEPTED 37 $119,313 137 $81,914 108 $102,353 32 $22,212 4 $158,040 APPLICATIONS DENIED 96 $129,409 381 $64,925 373 $90,074 225 $17,475 24 $91,372 APPLICATIONS WITHDRAWN 135 $135,571 134 $137,687 322 $110,101 25 $26,407 15 $147,034 FILES CLOSED FOR INCOMPLETENESS 43 $145,507 62 $140,098 63 $99,949 2 $10,775 4 $84,660
Aggregated Statistics For Year 2001(Based on 6 partial tracts) A) FHA, FSA/RHS & VA B) Conventional C) Refinancings D) Home Improvement Loans F) Non-occupant Loans on Number Average Value Number Average Value Number Average Value Number Average Value Number Average Value
LOANS ORIGINATED 785 $120,339 757 $83,386 462 $111,179 117 $16,242 76 $89,892 APPLICATIONS APPROVED, NOT ACCEPTED 37 $112,092 214 $60,640 89 $102,597 27 $31,911 16 $52,741 APPLICATIONS DENIED 66 $116,841 606 $51,542 242 $77,368 152 $19,855 25 $50,028 APPLICATIONS WITHDRAWN 280 $132,717 119 $96,948 205 $99,969 23 $20,597 8 $92,592 FILES CLOSED FOR INCOMPLETENESS 12 $121,422 25 $93,480 33 $111,436 1 $76,480 6 $67,353
Aggregated Statistics For Year 2000(Based on 6 partial tracts) A) FHA, FSA/RHS & VA B) Conventional C) Refinancings D) Home Improvement Loans F) Non-occupant Loans on Number Average Value Number Average Value Number Average Value Number Average Value Number Average Value
LOANS ORIGINATED 598 $112,562 697 $75,285 109 $84,592 47 $25,177 53 $54,155 APPLICATIONS APPROVED, NOT ACCEPTED 40 $86,170 199 $56,802 55 $59,821 24 $40,104 6 $51,492 APPLICATIONS DENIED 78 $87,479 837 $47,509 130 $65,525 80 $19,263 42 $41,485 APPLICATIONS WITHDRAWN 210 $122,208 104 $101,203 41 $84,272 6 $14,957 8 $78,640 FILES CLOSED FOR INCOMPLETENESS 18 $114,080 13 $149,258 35 $73,061 0 $0 0 $0
Aggregated Statistics For Year 1999(Based on 3 partial tracts) A) FHA, FSA/RHS & VA B) Conventional C) Refinancings D) Home Improvement Loans F) Non-occupant Loans on Number Average Value Number Average Value Number Average Value Number Average Value Number Average Value
LOANS ORIGINATED 132 $101,583 227 $66,696 84 $83,783 28 $23,062 13 $59,101 APPLICATIONS APPROVED, NOT ACCEPTED 10 $99,211 87 $50,441 46 $55,816 8 $19,022 6 $54,853 APPLICATIONS DENIED 23 $97,469 389 $50,859 58 $62,152 29 $13,619 30 $77,505 APPLICATIONS WITHDRAWN 23 $110,410 38 $74,480 24 $63,170 4 $28,202 2 $57,595 FILES CLOSED FOR INCOMPLETENESS 2 $119,605 6 $104,077 20 $70,924 1 $29,170 4 $41,168
Detailed HMDA statistics for the following Tracts:
0109.02
,
0109.03 ,
0109.04
Private Mortgage Insurance Companies Aggregated Statistics For Year 2009(Based on 6 partial tracts) A) Conventional B) Refinancings C) Non-occupant Loans on Number Average Value Number Average Value Number Average Value
LOANS ORIGINATED 69 $161,518 60 $147,450 1 $208,770 APPLICATIONS APPROVED, NOT ACCEPTED 35 $142,019 13 $203,556 3 $114,823 APPLICATIONS DENIED 5 $168,104 14 $143,575 3 $141,663 APPLICATIONS WITHDRAWN 4 $149,590 7 $204,103 0 $0 FILES CLOSED FOR INCOMPLETENESS 5 $150,678 1 $175,960 3 $127,250
Aggregated Statistics For Year 2008(Based on 6 partial tracts) A) Conventional B) Refinancings C) Non-occupant Loans on D) Loans On Manufactured Number Average Value Number Average Value Number Average Value Number Average Value
LOANS ORIGINATED 342 $155,600 72 $146,690 44 $125,808 3 $52,630 APPLICATIONS APPROVED, NOT ACCEPTED 99 $160,300 31 $160,447 22 $158,650 1 $43,290 APPLICATIONS DENIED 14 $156,875 6 $153,453 9 $143,813 0 $0 APPLICATIONS WITHDRAWN 25 $144,028 3 $153,517 13 $137,157 0 $0 FILES CLOSED FOR INCOMPLETENESS 4 $166,745 0 $0 2 $162,450 0 $0
Aggregated Statistics For Year 2007(Based on 6 partial tracts) A) Conventional B) Refinancings C) Non-occupant Loans on D) Loans On Manufactured Number Average Value Number Average Value Number Average Value Number Average Value
LOANS ORIGINATED 508 $150,397 57 $134,664 62 $126,209 2 $67,520 APPLICATIONS APPROVED, NOT ACCEPTED 42 $146,428 7 $232,566 3 $120,290 1 $96,800 APPLICATIONS DENIED 7 $161,226 0 $0 4 $124,862 1 $172,980 APPLICATIONS WITHDRAWN 13 $143,526 3 $85,957 4 $180,435 0 $0 FILES CLOSED FOR INCOMPLETENESS 0 $0 0 $0 0 $0 0 $0
Aggregated Statistics For Year 2006(Based on 6 partial tracts) A) Conventional B) Refinancings C) Non-occupant Loans on D) Loans On Manufactured Number Average Value Number Average Value Number Average Value Number Average Value
LOANS ORIGINATED 202 $141,328 23 $141,321 38 $122,694 7 $52,656 APPLICATIONS APPROVED, NOT ACCEPTED 26 $157,044 3 $117,803 7 $118,174 0 $0 APPLICATIONS DENIED 3 $122,280 0 $0 1 $170,000 0 $0 APPLICATIONS WITHDRAWN 12 $168,535 2 $129,525 5 $202,916 0 $0 FILES CLOSED FOR INCOMPLETENESS 1 $170,000 0 $0 0 $0 0 $0
Aggregated Statistics For Year 2005(Based on 6 partial tracts) A) Conventional B) Refinancings C) Non-occupant Loans on D) Loans On Manufactured Number Average Value Number Average Value Number Average Value Number Average Value
LOANS ORIGINATED 187 $127,752 38 $142,688 56 $124,666 8 $92,074 APPLICATIONS APPROVED, NOT ACCEPTED 37 $150,879 14 $126,806 6 $179,650 0 $0 APPLICATIONS DENIED 1 $191,180 2 $130,415 1 $95,590 0 $0 APPLICATIONS WITHDRAWN 7 $90,934 3 $108,830 2 $112,280 0 $0 FILES CLOSED FOR INCOMPLETENESS 1 $78,160 0 $0 0 $0 0 $0
Aggregated Statistics For Year 2004(Based on 6 partial tracts) A) Conventional B) Refinancings C) Non-occupant Loans on D) Loans On Manufactured Number Average Value Number Average Value Number Average Value Number Average Value
LOANS ORIGINATED 201 $134,802 78 $125,501 52 $115,347 9 $93,998 APPLICATIONS APPROVED, NOT ACCEPTED 21 $129,521 34 $155,361 4 $212,958 1 $77,670 APPLICATIONS DENIED 0 $0 1 $210,260 0 $0 0 $0 APPLICATIONS WITHDRAWN 13 $132,197 9 $164,910 4 $113,870 1 $144,600 FILES CLOSED FOR INCOMPLETENESS 6 $242,072 3 $132,220 0 $0 0 $0
Aggregated Statistics For Year 2003(Based on 6 partial tracts) A) Conventional B) Refinancings C) Non-occupant Loans on Number Average Value Number Average Value Number Average Value
LOANS ORIGINATED 174 $135,878 188 $125,701 22 $104,795 APPLICATIONS APPROVED, NOT ACCEPTED 43 $162,549 45 $136,038 2 $124,905 APPLICATIONS DENIED 7 $184,020 6 $109,008 1 $54,110 APPLICATIONS WITHDRAWN 11 $134,680 19 $122,357 1 $210,260 FILES CLOSED FOR INCOMPLETENESS 0 $0 1 $90,180 0 $0
Aggregated Statistics For Year 2002(Based on 6 partial tracts) A) Conventional B) Refinancings C) Non-occupant Loans on Number Average Value Number Average Value Number Average Value
LOANS ORIGINATED 218 $138,131 98 $126,381 15 $95,011 APPLICATIONS APPROVED, NOT ACCEPTED 21 $153,185 28 $132,665 1 $30,060 APPLICATIONS DENIED 3 $82,513 7 $124,196 0 $0 APPLICATIONS WITHDRAWN 10 $164,087 9 $112,810 0 $0 FILES CLOSED FOR INCOMPLETENESS 2 $104,860 1 $242,880 0 $0
Aggregated Statistics For Year 2001(Based on 6 partial tracts) A) Conventional B) Refinancings C) Non-occupant Loans on Number Average Value Number Average Value Number Average Value
LOANS ORIGINATED 162 $129,204 62 $131,081 10 $113,995 APPLICATIONS APPROVED, NOT ACCEPTED 35 $125,019 13 $124,478 0 $0 APPLICATIONS DENIED 5 $105,824 1 $235,610 0 $0 APPLICATIONS WITHDRAWN 11 $133,205 2 $134,680 0 $0 FILES CLOSED FOR INCOMPLETENESS 3 $131,913 2 $124,450 0 $0
Aggregated Statistics For Year 2000(Based on 6 partial tracts) A) Conventional B) Refinancings C) Non-occupant Loans on Number Average Value Number Average Value Number Average Value
LOANS ORIGINATED 117 $111,584 18 $105,362 7 $80,924 APPLICATIONS APPROVED, NOT ACCEPTED 16 $146,228 11 $112,644 0 $0 APPLICATIONS DENIED 1 $76,950 5 $128,862 0 $0 APPLICATIONS WITHDRAWN 5 $96,228 1 $65,730 0 $0 FILES CLOSED FOR INCOMPLETENESS 0 $0 0 $0 0 $0
Aggregated Statistics For Year 1999(Based on 3 partial tracts) A) Conventional B) Refinancings C) Non-occupant Loans on Number Average Value Number Average Value Number Average Value
LOANS ORIGINATED 26 $103,883 11 $100,100 1 $108,290 APPLICATIONS APPROVED, NOT ACCEPTED 2 $131,570 2 $95,880 0 $0 APPLICATIONS DENIED 2 $82,605 3 $137,043 0 $0 APPLICATIONS WITHDRAWN 0 $0 1 $122,750 0 $0 FILES CLOSED FOR INCOMPLETENESS 0 $0 1 $89,240 0 $0
Detailed PMIC statistics for the following Tracts:
0109.02
,
0109.03 ,
0109.04
2002 - 2018 National Fire Incident Reporting System (NFIRS) incidents See full 2006 National Fire Incident Reporting System statistics for zip code 78640, Texas
Most common first names in zip code 78640 among deceased individuals Name Count Lived (average)
John 25 74.9 years Mary 22 74.4 years Robert 21 72.6 years Maria 21 76.2 years William 17 68.7 years James 15 71.7 years Joe 14 66.8 years Jose 14 70.8 years Charles 13 71.0 years Edward 12 75.0 years
Most common last names in zip code 78640 among deceased individuals Last name Count Lived (average)
Martinez 17 70.3 years Gonzales 14 67.4 years Rodriguez 13 69.6 years Garcia 12 74.9 years Miller 12 77.2 years Deleon 10 68.1 years Saucedo 10 76.7 years Johnson 10 80.6 years Cisneros 10 74.4 years Torres 9 65.3 years
Businesses in zip code 78640
Name Count Name Count
AT&T 1 La Quinta 1 AutoZone 1 Little Caesars Pizza 1 CVS 1 Long John Silver's 1 Chick-Fil-A 1 Lowe's 1 Cricket Wireless 1 McDonald's 1 Dairy Queen 1 Nike 1 Discount Tire 1 RadioShack 1 Domino's Pizza 1 Starbucks 2 GNC 1 Subway 1 Home Depot 1 Target 1 Jack In The Box 1 U-Haul 3 Jones New York 1 UPS 1 KFC 1 Walgreens 1 Kohl's 1

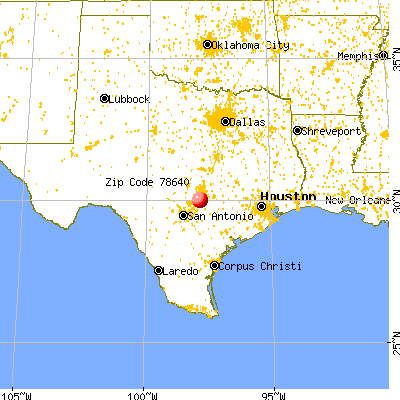


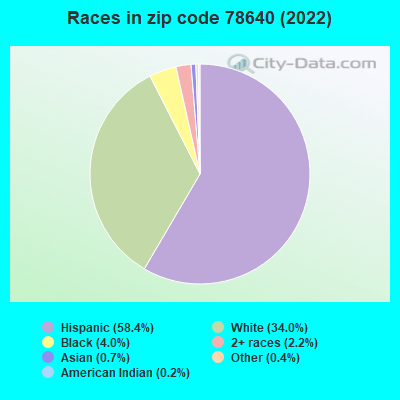


 Nearest zip codes: 78610, 78656, 78652, 78747, 78748, 78666.
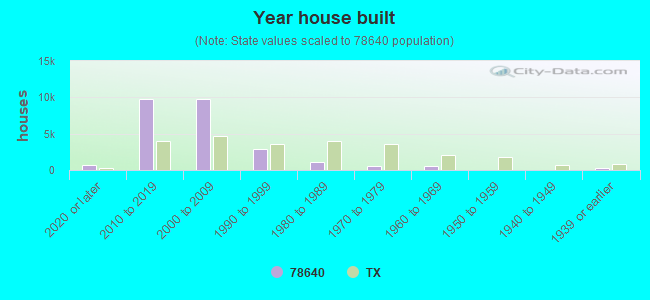

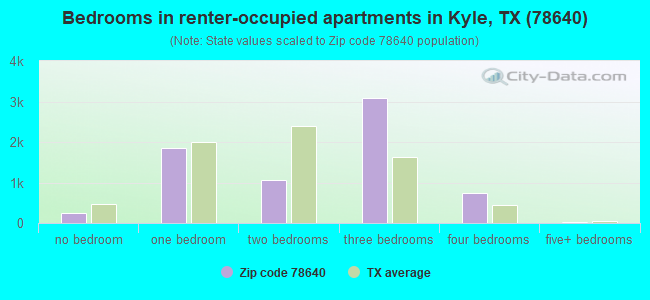
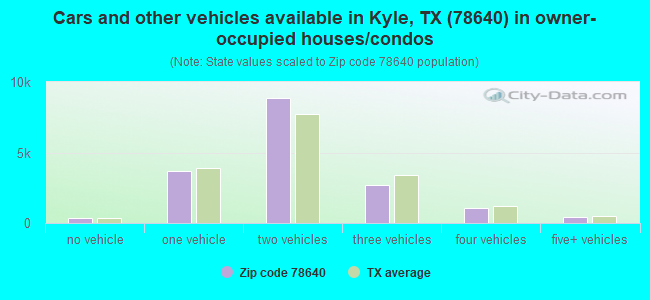
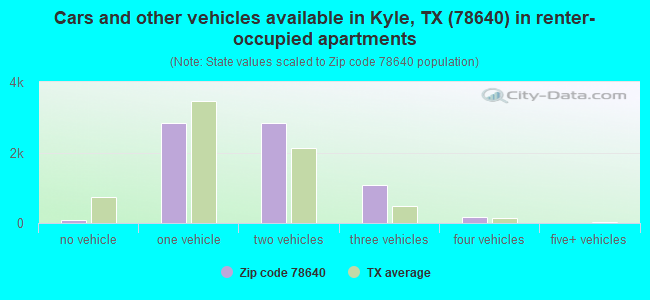


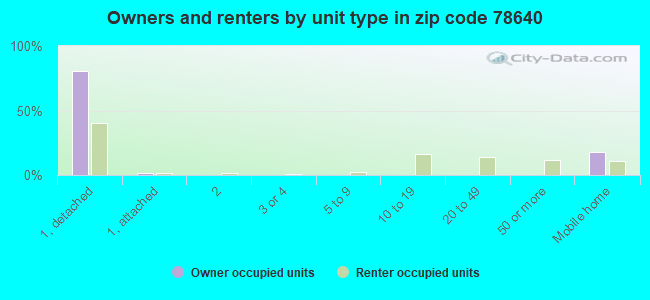
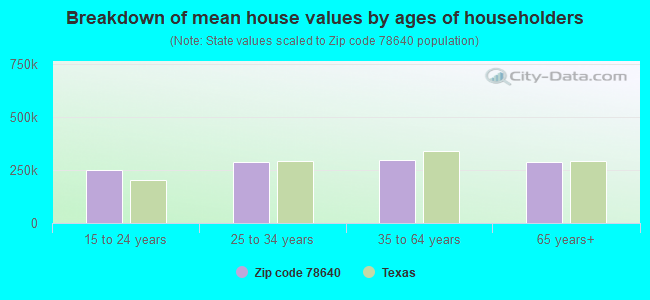


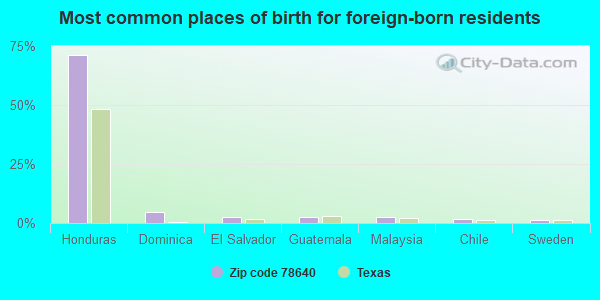
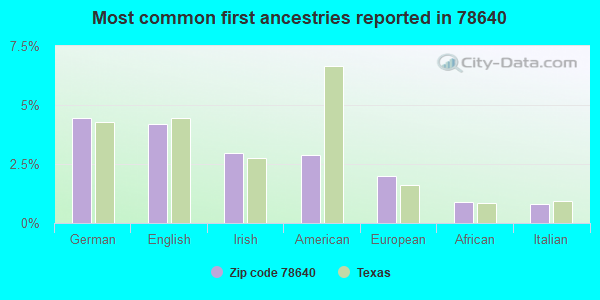
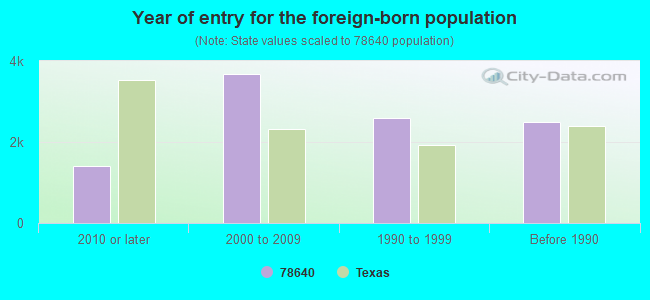

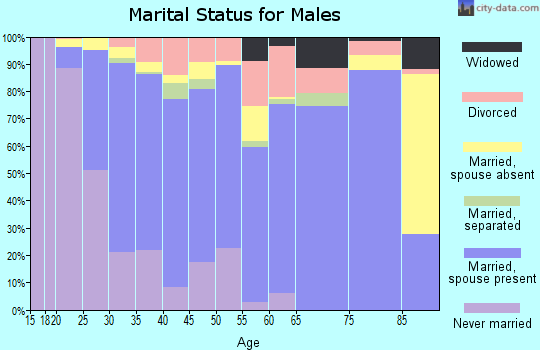
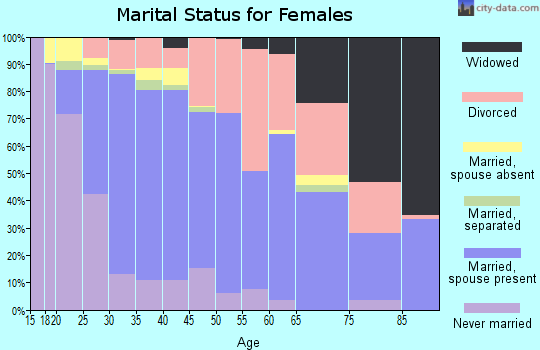
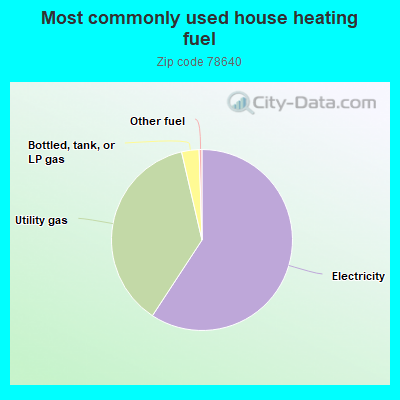
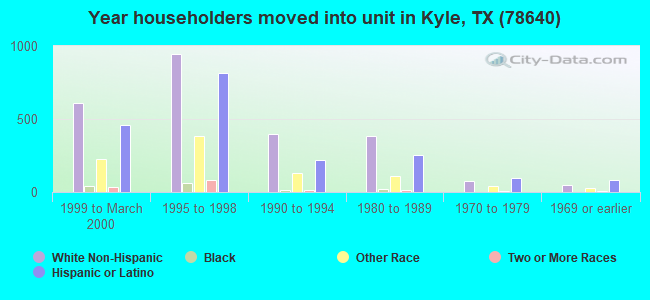
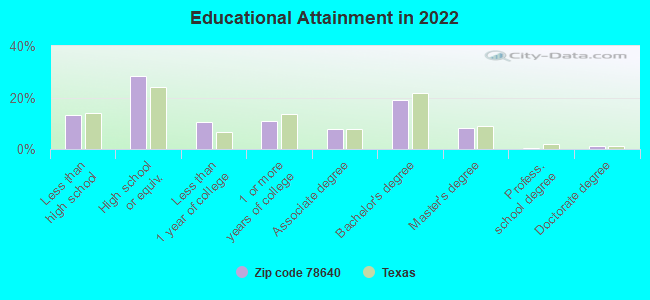
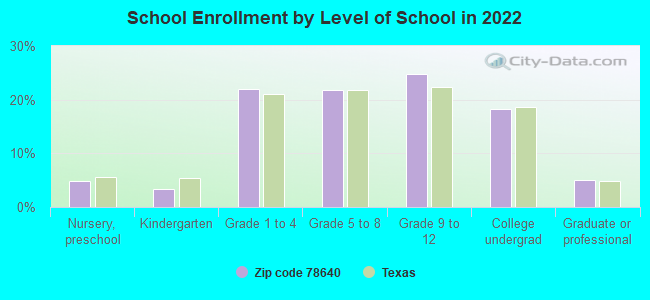
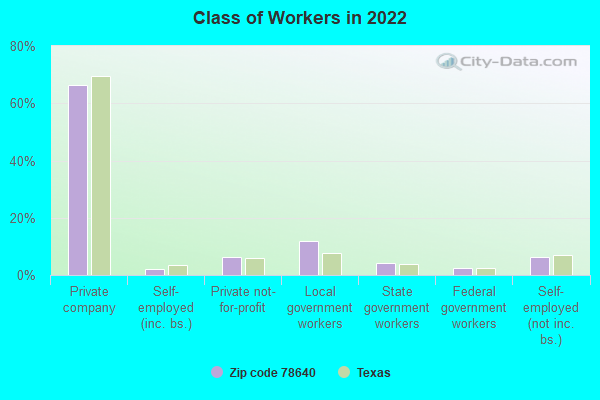
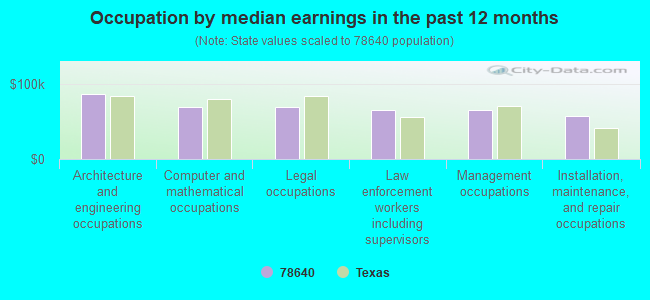
 : $27,923 in 2 contracts in 2005
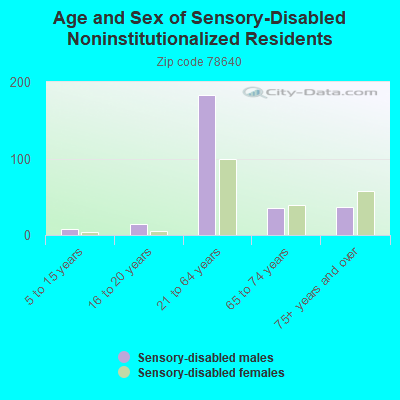
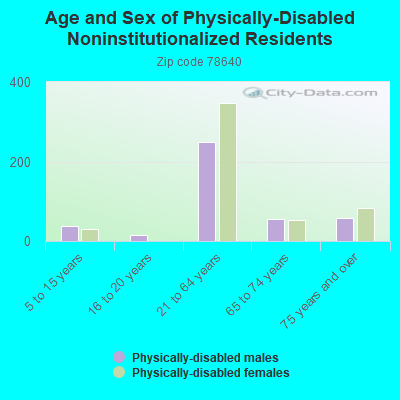
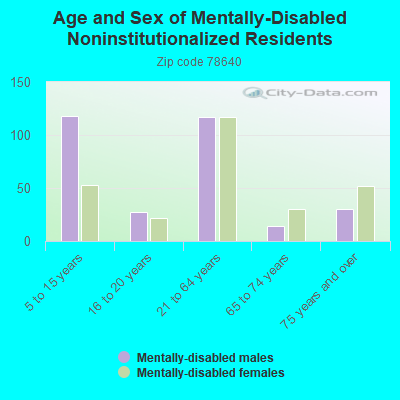
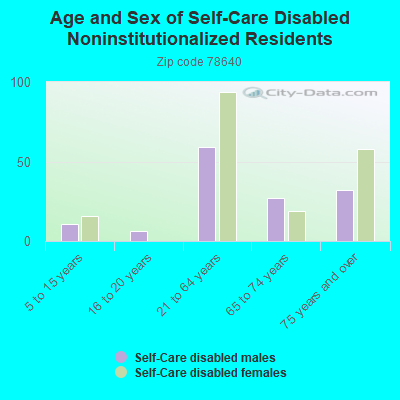
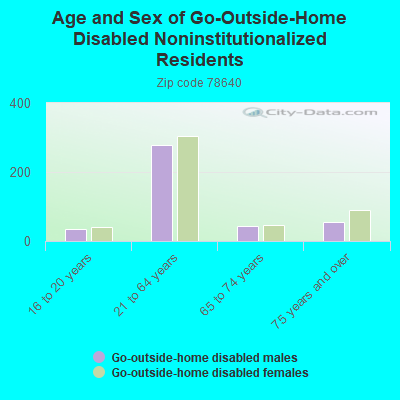
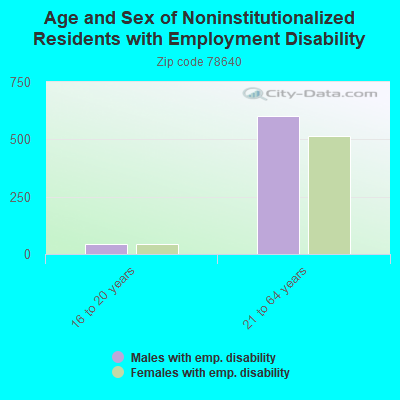
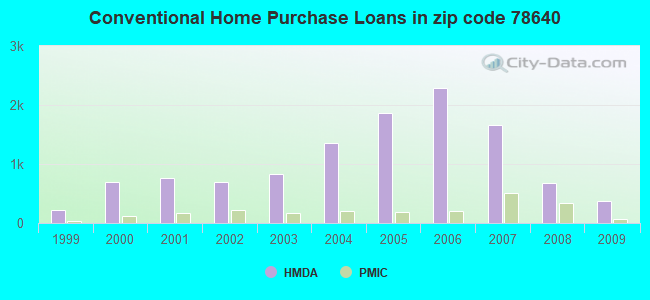
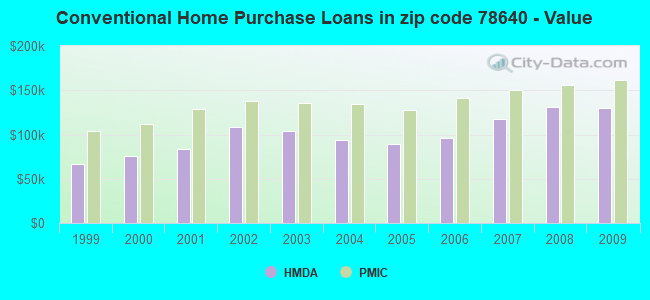
 According to the data from the years 2002 - 2018 the average number of fires per year is 122. The highest number of reported fire incidents - 198 took place in 2008, and the least - 9 in 2004. The data has an increasing trend.
 When looking into fire subcategories, the most incidents belonged to: Outside Fires (56.7%), and Structure Fires (23.0%).