Estimated zip code population in 2022: 11,006 Zip code population in 2010: 10,494 Zip code population in 2000: 10,041
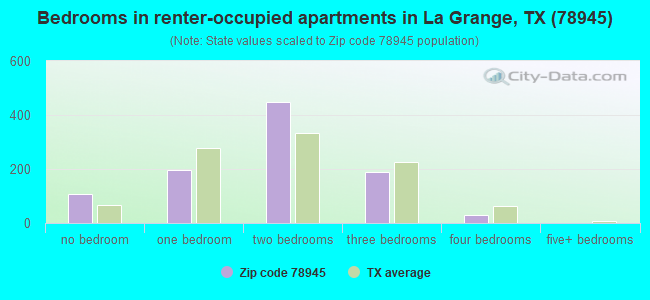
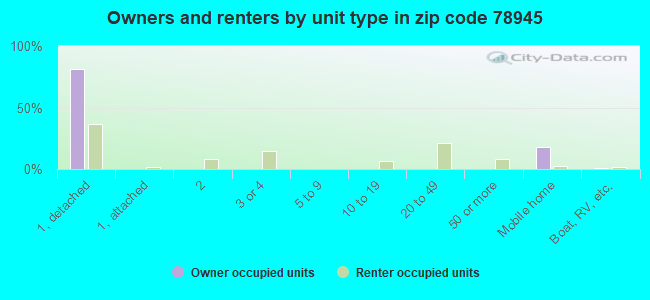
Houses and condos: 5,725 Renter-occupied apartments: 966
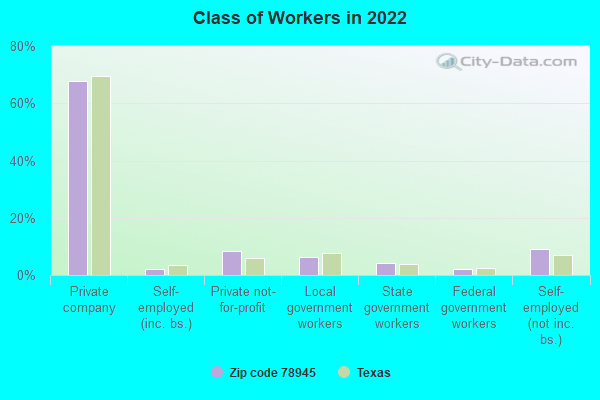
% of renters here:
22%
State:
38%
March 2022 cost of living index in zip code 78945: 80.9 (low, U.S. average is 100)
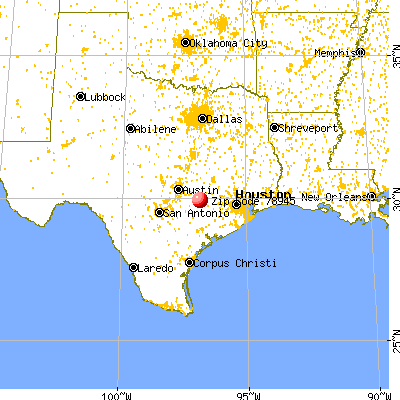
Land area: 252.1 sq. mi. Water area: 3.0 sq. mi.
Population density: 44 people per square mile
(very low).
OSM Map
General Map
Google Map
MSN Map
OSM Map
General Map
Google Map
MSN Map
OSM Map
General Map
Google Map
MSN Map
OSM Map
General Map
Google Map
MSN Map
Please wait while loading the map...
Real estate property taxes paid for housing units in 2022:
This zip code:
0.9% ($2,827)
Texas:
1.5% ($4,050)
Median real estate property taxes paid for housing units with mortgages in 2022: $2,920 (1.0%) Median real estate property taxes paid for housing units with no mortgage in 2022: $2,812 (0.9%)
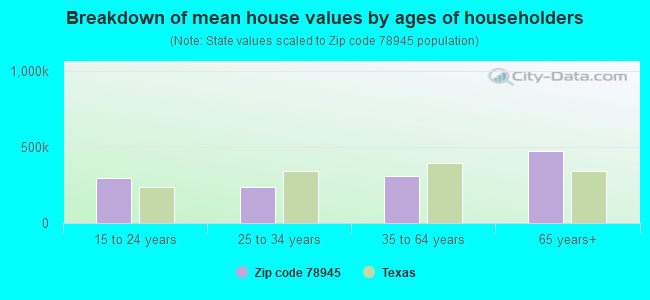
Estimated median house/condo value in 2022: $311,271
78945:
$311,271
Texas:
$275,400
According to our research of Texas and other state lists, there were 28 registered sex offenders living in 78945 zip code as of April 23, 2024. The ratio of all residents to sex offenders in zip code 78945 is 371 to 1. The ratio of registered sex offenders to all residents in this zip code is near the state average.
Median resident age:
This zip code:
48.5 years
Texas median age:
35.6 years
Average household size:
This zip code:
2.4 people
Texas:
2.6 people
Averages for the 2020 tax year for zip code 78945, filed in 2021:
Average Adjusted Gross Income (AGI) in 2020: $75,896 (Individual Income Tax Returns)
Here:
$75,896
State:
$77,054
Salary/wage: $57,003 (reported on 75.6% of returns)
Here:
$57,003
State:
$62,766
(% of AGI for various income ranges: 1283.1% for AGIs below $25k, 3501.0% for AGIs $25k-50k, 6211.2% for AGIs $50k-75k, 8960.3% for AGIs $75k-100k, 17704.4% for AGIs $100k-200k, 74873.3% for AGIs over 200k)
Taxable interest for individuals: $2,621 (reported on 41.7% of returns)
This zip code:
$2,621
Texas:
$2,665
(% of AGI for various income ranges: 38.5% for AGIs below $25k, 52.0% for AGIs $25k-50k, 96.7% for AGIs $50k-75k, 190.0% for AGIs $75k-100k, 258.7% for AGIs $100k-200k, 4255.0% for AGIs over 200k)
Ordinary dividends: $6,016 (reported on 34.7% of returns)
Here:
$6,016
State:
$10,044
(% of AGI for various income ranges: 59.5% for AGIs below $25k, 78.1% for AGIs $25k-50k, 204.6% for AGIs $50k-75k, 261.0% for AGIs $75k-100k, 744.4% for AGIs $100k-200k, 7358.3% for AGIs over 200k)
Net capital gain/loss in AGI: +$25,974 (reported on 22.8% of returns)
Here:
+$25,974
State:
+$39,590
(% of AGI for various income ranges: 35.4% for AGIs below $25k, 54.6% for AGIs $25k-50k, 123.5% for AGIs $50k-75k, 360.0% for AGIs $75k-100k, 951.8% for AGIs $100k-200k, 38603.3% for AGIs over 200k)
Profit/loss from business: +$13,958 (reported on 20.6% of returns)
Here:
+$13,958
State:
+$10,888
(% of AGI for various income ranges: 117.5% for AGIs below $25k, 117.9% for AGIs $25k-50k, 458.5% for AGIs $50k-75k, 390.7% for AGIs $75k-100k, 862.1% for AGIs $100k-200k, 8861.7% for AGIs over 200k)
Taxable individual retirement arrangement distribution: $22,440 (reported on 12.5% of returns)
78945:
$22,440
Texas:
$24,740
(% of AGI for various income ranges: 81.5% for AGIs below $25k, 135.8% for AGIs $25k-50k, 362.7% for AGIs $50k-75k, 621.7% for AGIs $75k-100k, 1202.6% for AGIs $100k-200k, 6091.7% for AGIs over 200k)
Total itemized deductions: $38,638 (reported on 6.5% of returns)
Here:
$38,638
State:
$40,428
(% of AGI for various income ranges: 54.4% for AGIs below $25k, 127.1% for AGIs $25k-50k, 313.1% for AGIs $50k-75k, 408.6% for AGIs $75k-100k, 786.7% for AGIs $100k-200k, 8221.7% for AGIs over 200k)
Charity contributions: $11,950 (reported on 5.2% of returns)
Here:
$11,950
State:
$18,201
(% of AGI for various income ranges: 20.0% for AGIs $25k-50k, 45.4% for AGIs $50k-75k, 93.8% for AGIs $75k-100k, 217.7% for AGIs $100k-200k, 2650.0% for AGIs over 200k)
Taxes paid: $6,671 (reported on 6.2% of returns)
78945:
$6,671
State:
$7,821
(% of AGI for various income ranges: 29.1% for AGIs $25k-50k, 46.5% for AGIs $50k-75k, 77.6% for AGIs $75k-100k, 147.2% for AGIs $100k-200k, 1311.7% for AGIs over 200k)
Earned income credit: $2,592 (reported on 14.5% of returns)
Here:
$2,592
State:
$2,584
(% of AGI for various income ranges: 115.3% for AGIs below $25k, 80.1% for AGIs $25k-50k)
Percentage of individuals using paid preparers for their 2020 taxes: 91.1%
Here:
91%
State:
92%
(% for various income ranges: 90.0% for AGIs below $25k, 91.5% for AGIs $25k-50k, 90.7% for AGIs $50k-75k, 89.6% for AGIs $75k-100k, 92.4% for AGIs $100k-200k, 96.3% for AGIs over 200k)
Averages for the 2012 tax year for zip code 78945, filed in 2013:
Average Adjusted Gross Income (AGI) in 2012: $65,343 (Individual Income Tax Returns)
Here:
$65,343
State:
$65,384
Salary/wage: $51,995 (reported on 78.1% of returns)
Here:
$51,995
State:
$52,524
(% of AGI for various income ranges: 70.5% for AGIs below $25k, 69.9% for AGIs $25k-50k, 68.1% for AGIs $50k-75k, 69.0% for AGIs $75k-100k, 66.7% for AGIs $100k-200k, 46.1% for AGIs over 200k)
Taxable interest for individuals: $2,297 (reported on 44.3% of returns)
This zip code:
$2,297
Texas:
$2,372
(% of AGI for various income ranges: 2.3% for AGIs below $25k, 1.2% for AGIs $25k-50k, 1.4% for AGIs $50k-75k, 1.2% for AGIs $75k-100k, 1.0% for AGIs $100k-200k, 2.2% for AGIs over 200k)
Ordinary dividends: $4,548 (reported on 38.6% of returns)
Here:
$4,548
State:
$9,721
(% of AGI for various income ranges: 2.7% for AGIs below $25k, 1.5% for AGIs $25k-50k, 1.2% for AGIs $50k-75k, 1.4% for AGIs $75k-100k, 2.4% for AGIs $100k-200k, 5.0% for AGIs over 200k)
Net capital gain/loss in AGI: +$15,145 (reported on 20.2% of returns)
Here:
+$15,145
State:
+$35,319
(% of AGI for various income ranges: 0.5% for AGIs $25k-50k, 0.8% for AGIs $50k-75k, 1.8% for AGIs $75k-100k, 2.6% for AGIs $100k-200k, 12.9% for AGIs over 200k)
Profit/loss from business: +$17,685 (reported on 19.7% of returns)
Here:
+$17,685
State:
+$13,732
(% of AGI for various income ranges: 8.5% for AGIs below $25k, 6.0% for AGIs $25k-50k, 3.8% for AGIs $50k-75k, 4.3% for AGIs $75k-100k, 5.4% for AGIs $100k-200k, 5.6% for AGIs over 200k)
Taxable individual retirement arrangement distribution: $15,831 (reported on 13.4% of returns)
78945:
$15,831
Texas:
$19,511
(% of AGI for various income ranges: 3.6% for AGIs below $25k, 3.1% for AGIs $25k-50k, 4.2% for AGIs $50k-75k, 4.9% for AGIs $75k-100k, 3.8% for AGIs $100k-200k, 1.4% for AGIs over 200k)
Total itemized deductions: $24,704 (18% of AGI, reported on 21.0% of returns)
Here:
$24,704
State:
$24,724
Here:
17.8% of AGI
State:
15.9% of AGI
(% of AGI for various income ranges: 8.0% for AGIs below $25k, 6.3% for AGIs $25k-50k, 9.3% for AGIs $50k-75k, 7.4% for AGIs $75k-100k, 7.7% for AGIs $100k-200k, 8.4% for AGIs over 200k)
Charity contributions: $5,232 (reported on 16.5% of returns)
Here:
$5,232
State:
$6,808
(% of AGI for various income ranges: 0.8% for AGIs below $25k, 0.7% for AGIs $25k-50k, 1.0% for AGIs $50k-75k, 1.6% for AGIs $75k-100k, 1.6% for AGIs $100k-200k, 1.4% for AGIs over 200k)
Taxes paid: $5,594 (reported on 20.6% of returns)
78945:
$5,594
State:
$6,921
(% of AGI for various income ranges: 1.1% for AGIs below $25k, 1.1% for AGIs $25k-50k, 2.5% for AGIs $50k-75k, 1.8% for AGIs $75k-100k, 2.0% for AGIs $100k-200k, 1.6% for AGIs over 200k)
Earned income credit: $2,321 (reported on 15.4% of returns)
Here:
$2,321
State:
$2,570
(% of AGI for various income ranges: 6.5% for AGIs below $25k, 0.9% for AGIs $25k-50k)
Percentage of individuals using paid preparers for their 2012 taxes: 65.1%
Here:
65%
State:
51%
(% for various income ranges: 60.2% for AGIs below $25k, 64.0% for AGIs $25k-50k, 64.9% for AGIs $50k-75k, 70.6% for AGIs $75k-100k, 69.8% for AGIs $100k-200k, 88.2% for AGIs over 200k)
Averages for the 2004 tax year for zip code 78945, filed in 2005:
Average Adjusted Gross Income (AGI) in 2004: $42,626 (Individual Income Tax Returns)
Here:
$42,626
State:
$47,881
Salary/wage: $36,921 (reported on 78.4% of returns)
Here:
$36,921
State:
$41,947
(% of AGI for various income ranges: 177.6% for AGIs below $10k, 73.1% for AGIs $10k-25k, 71.4% for AGIs $25k-50k, 72.2% for AGIs $50k-75k, 72.7% for AGIs $75k-100k, 54.6% for AGIs over 100k)
Taxable interest for individuals: $2,379 (reported on 49.5% of returns)
This zip code:
$2,379
Texas:
$2,255
(% of AGI for various income ranges: 15.7% for AGIs below $10k, 2.9% for AGIs $10k-25k, 2.8% for AGIs $25k-50k, 1.9% for AGIs $50k-75k, 2.6% for AGIs $75k-100k, 2.9% for AGIs over 100k)
Taxable dividends: $2,679 (reported on 30.1% of returns)
Here:
$2,679
State:
$4,261
(% of AGI for various income ranges: 8.2% for AGIs below $10k, 1.2% for AGIs $10k-25k, 1.4% for AGIs $25k-50k, 1.0% for AGIs $50k-75k, 1.7% for AGIs $75k-100k, 2.8% for AGIs over 100k)
Net capital gain/loss: +$6,484 (reported on 26.1% of returns)
Here:
+$6,484
State:
+$16,110
(% of AGI for various income ranges: -1.8% for AGIs below $10k, 1.7% for AGIs $10k-25k, 1.5% for AGIs $25k-50k, 1.4% for AGIs $50k-75k, 2.2% for AGIs $75k-100k, 9.1% for AGIs over 100k)
Profit/loss from business: +$9,574 (reported on 20.5% of returns)
Here:
+$9,574
State:
+$11,013
(% of AGI for various income ranges: 7.5% for AGIs below $10k, 6.7% for AGIs $10k-25k, 3.3% for AGIs $25k-50k, 3.4% for AGIs $50k-75k, 3.3% for AGIs $75k-100k, 6.2% for AGIs over 100k)
IRA payment deduction: $3,468 (reported on 3.3% of returns)
78945:
$3,468
Texas:
$3,120
(% of AGI for various income ranges: 0.2% for AGIs $10k-25k, 0.4% for AGIs $25k-50k, 0.3% for AGIs $50k-75k, 0.3% for AGIs $75k-100k, 0.2% for AGIs over 100k)
Self-employed pension: $12,154 (reported on 0.6% of returns)
Here:
$12,154
Texas:
$16,401
Total itemized deductions: $17,484 (21% of AGI, reported on 18.7% of returns)
Here:
$17,484
State:
$19,631
Here:
20.8% of AGI
State:
18.9% of AGI
(% of AGI for various income ranges: 16.4% for AGIs below $10k, 8.0% for AGIs $10k-25k, 6.6% for AGIs $25k-50k, 7.2% for AGIs $50k-75k, 8.1% for AGIs $75k-100k, 8.1% for AGIs over 100k)
Charity contributions deductions: $3,971 (5% of AGI, reported on 16.0% of returns)
Here:
$3,971
State:
$4,753
Here:
4.5% of AGI
State:
4.2% of AGI
(% of AGI for various income ranges: 0.9% for AGIs below $10k, 0.8% for AGIs $10k-25k, 1.1% for AGIs $25k-50k, 1.3% for AGIs $50k-75k, 1.9% for AGIs $75k-100k, 1.9% for AGIs over 100k)
Total tax: $6,642 (reported on 74.9% of returns)
78945:
$6,642
State:
$9,058
(% of AGI for various income ranges: 7.3% for AGIs below $10k, 4.3% for AGIs $10k-25k, 6.7% for AGIs $25k-50k, 9.3% for AGIs $50k-75k, 10.8% for AGIs $75k-100k, 19.4% for AGIs over 100k)
Earned income credit: $1,941 (reported on 14.6% of returns)
Here:
$1,941
State:
$2,024
Percentage of individuals using paid preparers for their 2004 taxes: 68.3%
Here:
68%
State:
57%
(% for various income ranges: 60.2% for AGIs below $10k, 69.4% for AGIs $10k-25k, 68.4% for AGIs $25k-50k, 70.3% for AGIs $50k-75k, 72.4% for AGIs $75k-100k, 78.5% for AGIs over 100k)
Likely homosexual households (counted as self-reported same-sex unmarried-partner households)
Lesbian couples: 0.0% of all households
Gay men: 0.5% of all households
Household received Food Stamps/SNAP in the past 12 months: 336 Household did not receive Food Stamps/SNAP in the past 12 months: 4,131
Women who had a birth in the past 12 months: 100 (48 now married, 50 unmarried) Women who did not have a birth in the past 12 months: 2,033 (881 now married, 1,152 unmarried)
Housing units in zip code 78945 with a mortgage: 1,253 (7 second mortgage, 8 both second mortgage and home equity loan) Median monthly owner costs for units with a mortgage: $1,553 Median monthly owner costs for units without a mortgage: $580
Residents with income below the poverty level in 2022:
This zip code:
12.1%
Whole state:
14.0%
Residents with income below 50% of the poverty level in 2022:
This zip code:
7.5%
Whole state:
7.4%
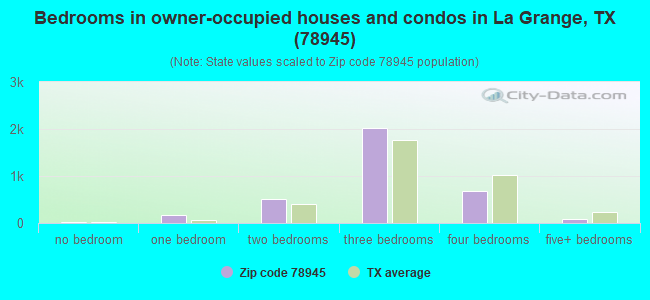
Median number of rooms in houses and condos:
Here:
6.2
State:
6.3
Median number of rooms in apartments:
Here:
4.5
State:
4.0
Notable locations in this zip code not listed on our city pages
Notable locations in zip code 78945: Lone Star Camp (A), Lutherhill Camp (B), La Grange Magnetic Station (C), Mullins Prairie (D), Henry L Kreische Brewery and House (E), Duncanville Public Library (F), DeSoto Public Library (G), Dallas West Branch Library (H), Hampton - Illinois Branch Library (I), Fretz Park Branch Library (J), Farmers Branch Manske Public Library (K), Highland Park Library (L), Lakewood Branch Library (M), Kiest Branch Library (N), Martin Luther King, Junior Library (O), Park Forest Branch Library (P), Oak Lawn Branch Library (Q), North Oak Cliff Branch Library (R), Mountain Creek Branch Library (S), Polk - Wisdom Branch Library (T). Display/hide their locations on the map
Churches in zip code 78945 include: Saint Wenceslaus Church (A), Trinity Church (B), Post Oak Church (C), Cedar Grove Church (D), Saint James Episcopal Church (E), Bethlehem Church (F), Saint Johns Church (G), Saint Matthews Church (H), Mount Zion Church (I). Display/hide their locations on the map
Cemeteries: Brandt Cemetery (1), Mantan Cemetery (2), Taylor Cemetery (3), Cedar Cemetery (4), Moore Cemetery (5), Shaw Cemetery (6), Plum Grove Cemetery (7). Display/hide their locations on the map
Reservoirs: Rocky Creek Ranch Lake (A), El-Leo Lake (B), Clear Lake Pines 1 (C), Clear Lake Pines 2 (D), Clear Lake Pines 3 (E), Clear Lake Pines 4 (F), Farmers Industries Lake (G), Lake Chapparal (H). Display/hide their locations on the map
Streams, rivers, and creeks: Blue Branch (A), Blair Branch (B), Williams Creek (C), White Creek (D), Sock Branch (E), Saint Paul Creek (F), Roper Creek (G), Piney Creek (H), Owl Creek (I). Display/hide their locations on the map
Parks in zip code 78945 include: Lester Park (1), Kruschel Park (2), Jaycee Park (3), Monument Hill State Park (4), Kruschel Memorial Park (5). Display/hide their locations on the map
In group quarters: 204 (-1 institutionalized population)
Size of family households: 1,704 2-persons, 433 3-persons, 388 4-persons, 210 5-persons, 128 6-persons, 52 7-or-more-persons
Size of nonfamily households: 1,399 1-person, 177 2-persons, 4 3-persons
1,419 married couples with children.
334 single-parent households (47 men, 287 women).
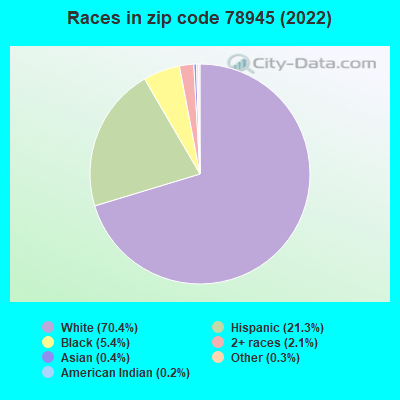
81.8% of residents of 78945 zip code speak English at home.
16.2% of residents speak Spanish at home (82% very well, 14% well, 5% not well).
2.2% of residents speak other Indo-European language at home (100% very well).
0.3% of residents speak Asian or Pacific Island language at home (100% very well).
Foreign born population: 1,022 (9.3%) (53.1% of them are naturalized citizens)
This zip code:
9.3%
Whole state:
17.2%
72%Honduras
5%Sweden
5%Costa Rica
3%Burma (Myanmar)
2%Venezuela
2%Kuwait
2%St. Vincent and the Grenadines
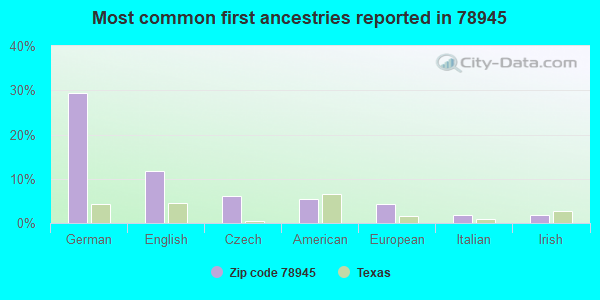
29%German
12%English
6%Czech
5%American
4%European
2%Italian
2%Irish
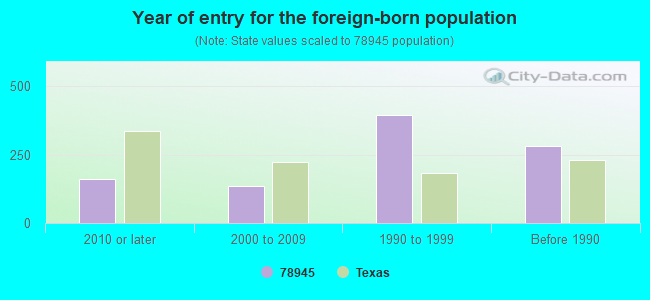
Year of entry for the foreign-born population
1612010 or later
1342000 to 2009
3951990 to 1999
283Before 1990
Facilities with environmental interests located in this zip code:
AQUILA SOUTHWEST (HWY 77 AND CR 153 in LA GRANGE, TX)
AIR MINOR (AIRS/AFS) Business SIC classification: NATURAL GAS TRANSMISSION AND DISTRIBUTION
AQUILA SOUTHWEST (APP. 7 MI. N. OF LAGRANGE ON H in LA GRANGE, TX)
AIR MAJOR (AIRS/AFS) CRITERIA AND HAZARDOUS AIR POLLUTANT INVENTORY (Inventory of air pollution sources) Business SIC classification: NATURAL GAS LIQUIDS
Housing units lacking complete plumbing facilities: 3.0% Housing units lacking complete kitchen facilities: 4.9%
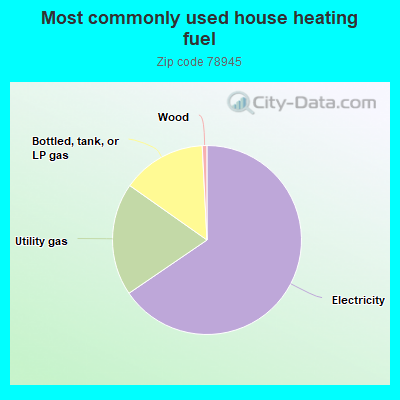
65.4%Electricity
19.3%Utility gas
14.4%Bottled, tank, or LP gas
0.8%Wood
Population in 1990: 10,019. Population change in the 1990s: +22 (+0.2%).
Place of birth for U.S.-born residents:
This state: 8,450
Northeast: 158
Midwest: 320
South: 621
West: 364
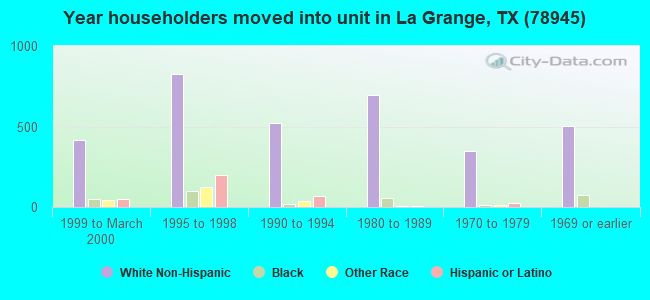
61% of the 78945 zip code residents lived in the same house 5 years ago. Out of people who lived in different houses, 58% lived in this county. Out of people who lived in different counties, 50% lived in Texas.
96% of the 78945 zip code residents lived in the same house 1 year ago. Out of people who lived in different houses, 60% moved from this county. Out of people who lived in different houses, 43% moved from different county within same state.
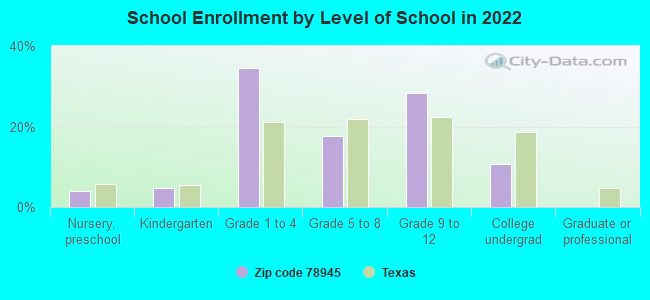
Private vs. public school enrollment:
Students in private schools in grades 1 to 8 (elementary and middle school): 142
Here:
13.8%
Texas:
8.8%
Students in private schools in grades 9 to 12 (high school):
Here:
0.0%
Texas:
8.0%
Students in private undergraduate colleges: 14
Here:
7.1%
Texas:
16.2%
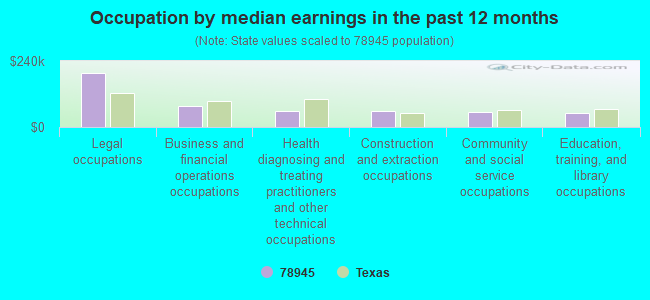
Occupation by median earnings in the past 12 months ($)
196,810Legal occupations
75,355Business and financial operations occupations
59,181Health diagnosing and treating practitioners and other technical occupations
58,813Construction and extraction occupations
52,880Community and social service occupations
51,323Education, training, and library occupations
Companies with federal contracts located in this zip code:
RAY'S CRANE SERVICE, INC (3848 N US HIGHWAY 77 in LA GRANGE, TX; small business)
$7,390 with Army for Earth Moving and Excavating Equipment. Signed on 2004-01-30. Completion date: 2004-02-01.
Top industries in this zip code by the number of employees in 2005:
Health Care and Social Assistance: Nursing Care Facilities (50-99: 1)
Wholesale Trade: Beer and Ale Merchant Wholesalers (20-49: 2)
People in group quarters in 2010:
151 people in nursing facilities/skilled-nursing facilities
20 people in local jails and other municipal confinement facilities
17 people in group homes intended for adults
6 people in residential treatment centers for adults
People in group quarters in 2000:
185 people in nursing homes
24 people in local jails and other confinement facilities (including police lockups)
16 people in homes for the mentally retarded
Fatal accident statistics in 2014:
Fatal accident count: 2
Vehicles involved in fatal accidents: 3
Fatal accidents caused by drunken drivers: 0
Fatalities: 2
Persons involved in fatal accidents: 3
Pedestrians involved in fatal accidents: 0
Fatal accident statistics in 2013:
Fatal accident count: 4
Vehicles involved in fatal accidents: 6
Fatal accidents caused by drunken drivers: 2
Fatalities: 4
Persons involved in fatal accidents: 12
Pedestrians involved in fatal accidents: 0
2002 - 2018 National Fire Incident Reporting System (NFIRS) incidents
Based on the data from the years 2002 - 2018 the average number of fire incidents per year is 64. The highest number of fire incidents - 128 took place in 2011, and the least - 9 in 2012. The data has a rising trend.
When looking into fire subcategories, the most incidents belonged to: Outside Fires (65.8%), and Structure Fires (17.9%).
Fire incident types reported to NFIRS in Zip Code 78945


 Nearest zip codes: 78963, 78949, 78940, 78938, 78956, 78954.
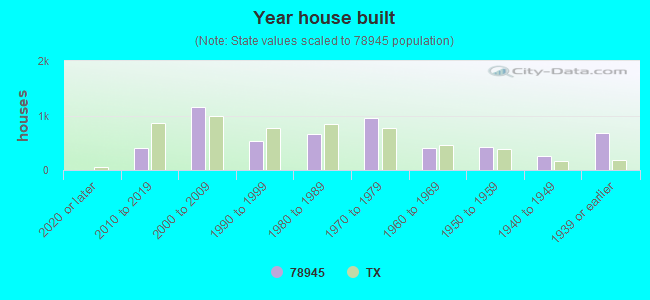


 Based on the data from the years 2002 - 2018 the average number of fire incidents per year is 64. The highest number of fire incidents - 128 took place in 2011, and the least - 9 in 2012. The data has a rising trend.
 When looking into fire subcategories, the most incidents belonged to: Outside Fires (65.8%), and Structure Fires (17.9%).