Estimated zip code population in 2022: 6,981 Zip code population in 2010: 7,040 Zip code population in 2000: 7,682
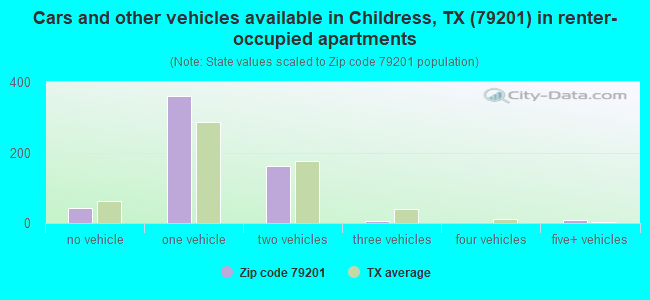
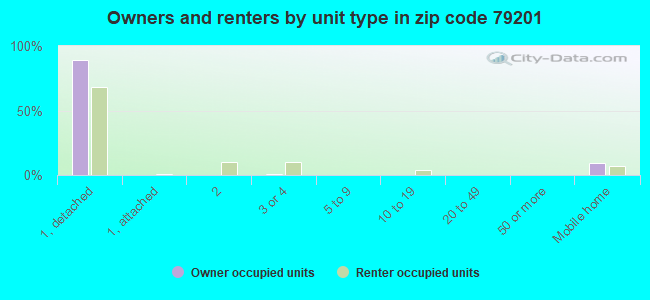
Houses and condos: 2,910 Renter-occupied apartments: 575
% of renters here:
29%
State:
38%
March 2022 cost of living index in zip code 79201: 76.9 (low, U.S. average is 100)
Land area: 860.4 sq. mi. Water area: 17.1 sq. mi.
Population density: 8 people per square mile
(very low).
OSM Map
General Map
Google Map
MSN Map
OSM Map
General Map
Google Map
MSN Map
OSM Map
General Map
Google Map
MSN Map
OSM Map
General Map
Google Map
MSN Map
Please wait while loading the map...
Real estate property taxes paid for housing units in 2022:
This zip code:
1.6% ($1,992)
Texas:
1.5% ($4,050)
Median real estate property taxes paid for housing units with mortgages in 2022: $2,688 (1.6%) Median real estate property taxes paid for housing units with no mortgage in 2022: $1,522 (1.5%)
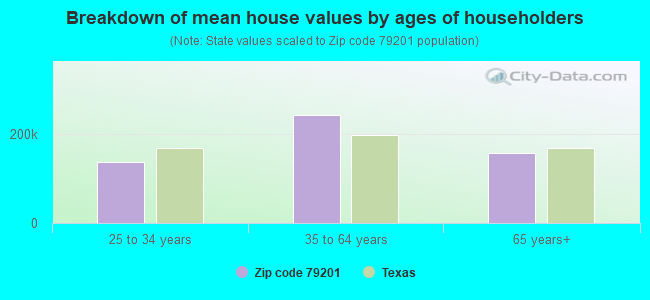
Estimated median house/condo value in 2022: $126,360
79201:
$126,360
Texas:
$275,400
According to our research of Texas and other state lists, there were 17 registered sex offenders living in 79201 zip code as of April 25, 2024. The ratio of all residents to sex offenders in zip code 79201 is 421 to 1. The ratio of registered sex offenders to all residents in this zip code is near the state average.
Median resident age:
This zip code:
33.0 years
Texas median age:
35.6 years
Average household size:
This zip code:
2.7 people
Texas:
2.6 people
Averages for the 2020 tax year for zip code 79201, filed in 2021:
Average Adjusted Gross Income (AGI) in 2020: $51,893 (Individual Income Tax Returns)
Here:
$51,893
State:
$77,054
Salary/wage: $44,434 (reported on 82.0% of returns)
Here:
$44,434
State:
$62,766
(% of AGI for various income ranges: 1278.7% for AGIs below $25k, 3573.2% for AGIs $25k-50k, 6238.4% for AGIs $50k-75k, 10547.1% for AGIs $75k-100k, 14105.0% for AGIs $100k-200k)
Taxable interest for individuals: $1,328 (reported on 25.0% of returns)
This zip code:
$1,328
Texas:
$2,665
(% of AGI for various income ranges: 12.6% for AGIs below $25k, 16.8% for AGIs $25k-50k, 38.4% for AGIs $50k-75k, 153.6% for AGIs $75k-100k, 86.2% for AGIs $100k-200k)
Ordinary dividends: $4,455 (reported on 12.7% of returns)
Here:
$4,455
State:
$10,044
(% of AGI for various income ranges: 10.6% for AGIs below $25k, 24.2% for AGIs $25k-50k, 99.6% for AGIs $50k-75k, 67.1% for AGIs $75k-100k, 302.5% for AGIs $100k-200k)
Net capital gain/loss in AGI: +$8,562 (reported on 11.9% of returns)
Here:
+$8,562
State:
+$39,590
(% of AGI for various income ranges: 13.0% for AGIs below $25k, 26.8% for AGIs $25k-50k, 30.8% for AGIs $50k-75k, 131.4% for AGIs $75k-100k, 707.5% for AGIs $100k-200k)
Profit/loss from business: +$9,739 (reported on 15.6% of returns)
Here:
+$9,739
State:
+$10,888
(% of AGI for various income ranges: 78.7% for AGIs below $25k, 80.6% for AGIs $25k-50k, 216.0% for AGIs $50k-75k, 141.4% for AGIs $75k-100k, 375.0% for AGIs $100k-200k)
Taxable individual retirement arrangement distribution: $14,300 (reported on 5.3% of returns)
79201:
$14,300
Texas:
$24,740
(% of AGI for various income ranges: 15.7% for AGIs below $25k, 124.6% for AGIs $25k-50k, 248.6% for AGIs $75k-100k, 487.5% for AGIs $100k-200k)
Total itemized deductions: $40,233 (reported on 2.5% of returns)
Here:
$40,233
State:
$40,428
(% of AGI for various income ranges: 158.4% for AGIs $25k-50k, 1013.7% for AGIs $100k-200k)
Charity contributions: $16,960 (reported on 2.0% of returns)
Here:
$16,960
State:
$18,201
(% of AGI for various income ranges: 530.0% for AGIs $100k-200k)
Taxes paid: $5,167 (reported on 2.5% of returns)
79201:
$5,167
State:
$7,821
(% of AGI for various income ranges: 8.6% for AGIs below $25k, 156.9% for AGIs $100k-200k)
Earned income credit: $2,369 (reported on 21.3% of returns)
Here:
$2,369
State:
$2,584
(% of AGI for various income ranges: 122.9% for AGIs below $25k, 76.8% for AGIs $25k-50k)
Percentage of individuals using paid preparers for their 2020 taxes: 91.8%
Here:
92%
State:
92%
(% for various income ranges: 91.2% for AGIs below $25k, 93.8% for AGIs $25k-50k, 91.4% for AGIs $50k-75k, 87.0% for AGIs $75k-100k, 92.3% for AGIs $100k-200k, 100.0% for AGIs over 200k)
Averages for the 2012 tax year for zip code 79201, filed in 2013:
Average Adjusted Gross Income (AGI) in 2012: $41,533 (Individual Income Tax Returns)
Here:
$41,533
State:
$65,384
Salary/wage: $35,046 (reported on 82.2% of returns)
Here:
$35,046
State:
$52,524
(% of AGI for various income ranges: 78.9% for AGIs below $25k, 77.7% for AGIs $25k-50k, 75.9% for AGIs $50k-75k, 74.8% for AGIs $75k-100k, 60.4% for AGIs $100k-200k, 37.2% for AGIs over 200k)
Taxable interest for individuals: $1,398 (reported on 25.2% of returns)
This zip code:
$1,398
Texas:
$2,372
(% of AGI for various income ranges: 0.7% for AGIs below $25k, 1.0% for AGIs $25k-50k, 0.5% for AGIs $50k-75k, 0.8% for AGIs $75k-100k, 1.3% for AGIs $100k-200k, 0.8% for AGIs over 200k)
Ordinary dividends: $3,511 (reported on 11.6% of returns)
Here:
$3,511
State:
$9,721
(% of AGI for various income ranges: 0.9% for AGIs below $25k, 0.6% for AGIs $25k-50k, 0.7% for AGIs $50k-75k, 0.4% for AGIs $75k-100k, 1.5% for AGIs $100k-200k, 2.4% for AGIs over 200k)
Net capital gain/loss in AGI: +$8,004 (reported on 9.5% of returns)
Here:
+$8,004
State:
+$35,319
(% of AGI for various income ranges: 0.1% for AGIs $25k-50k, 0.1% for AGIs $50k-75k, 0.8% for AGIs $75k-100k, 5.2% for AGIs $100k-200k, 6.6% for AGIs over 200k)
Profit/loss from business: +$14,432 (reported on 16.5% of returns)
Here:
+$14,432
State:
+$13,732
(% of AGI for various income ranges: 6.3% for AGIs below $25k, 4.0% for AGIs $25k-50k, 3.8% for AGIs $50k-75k, 3.4% for AGIs $75k-100k, 15.3% for AGIs $100k-200k)
Taxable individual retirement arrangement distribution: $7,318 (reported on 7.0% of returns)
79201:
$7,318
Texas:
$19,511
(% of AGI for various income ranges: 1.9% for AGIs below $25k, 1.5% for AGIs $25k-50k, 0.9% for AGIs $50k-75k, 2.9% for AGIs $75k-100k)
Total itemized deductions: $20,937 (22% of AGI, reported on 11.2% of returns)
Here:
$20,937
State:
$24,724
Here:
22.5% of AGI
State:
15.9% of AGI
(% of AGI for various income ranges: 4.5% for AGIs below $25k, 4.1% for AGIs $25k-50k, 4.8% for AGIs $50k-75k, 5.1% for AGIs $75k-100k, 7.6% for AGIs $100k-200k, 9.1% for AGIs over 200k)
Charity contributions: $8,724 (reported on 8.7% of returns)
Here:
$8,724
State:
$6,808
(% of AGI for various income ranges: 0.7% for AGIs below $25k, 0.7% for AGIs $25k-50k, 1.0% for AGIs $50k-75k, 1.5% for AGIs $75k-100k, 3.1% for AGIs $100k-200k, 5.4% for AGIs over 200k)
Taxes paid: $3,278 (reported on 11.2% of returns)
79201:
$3,278
State:
$6,921
(% of AGI for various income ranges: 0.5% for AGIs below $25k, 0.5% for AGIs $25k-50k, 0.6% for AGIs $50k-75k, 0.9% for AGIs $75k-100k, 1.3% for AGIs $100k-200k, 1.9% for AGIs over 200k)
Earned income credit: $2,525 (reported on 26.0% of returns)
Here:
$2,525
State:
$2,570
(% of AGI for various income ranges: 9.0% for AGIs below $25k, 1.6% for AGIs $25k-50k)
Percentage of individuals using paid preparers for their 2012 taxes: 50.4%
Here:
50%
State:
51%
(% for various income ranges: 41.1% for AGIs below $25k, 52.5% for AGIs $25k-50k, 59.4% for AGIs $50k-75k, 63.2% for AGIs $75k-100k, 71.4% for AGIs $100k-200k, 75.0% for AGIs over 200k)
Averages for the 2004 tax year for zip code 79201, filed in 2005:
Average Adjusted Gross Income (AGI) in 2004: $31,265 (Individual Income Tax Returns)
Here:
$31,265
State:
$47,881
Salary/wage: $27,200 (reported on 81.9% of returns)
Here:
$27,200
State:
$41,947
(% of AGI for various income ranges: 163.8% for AGIs below $10k, 73.9% for AGIs $10k-25k, 79.2% for AGIs $25k-50k, 75.5% for AGIs $50k-75k, 74.2% for AGIs $75k-100k, 37.1% for AGIs over 100k)
Taxable interest for individuals: $2,224 (reported on 36.6% of returns)
This zip code:
$2,224
Texas:
$2,255
(% of AGI for various income ranges: 15.2% for AGIs below $10k, 2.5% for AGIs $10k-25k, 1.9% for AGIs $25k-50k, 1.6% for AGIs $50k-75k, 1.1% for AGIs $75k-100k, 4.7% for AGIs over 100k)
Taxable dividends: $1,544 (reported on 13.1% of returns)
Here:
$1,544
State:
$4,261
(% of AGI for various income ranges: 1.3% for AGIs below $10k, 0.6% for AGIs $10k-25k, 0.3% for AGIs $25k-50k, 0.5% for AGIs $50k-75k, 0.3% for AGIs $75k-100k, 1.6% for AGIs over 100k)
Net capital gain/loss: +$7,117 (reported on 14.4% of returns)
Here:
+$7,117
State:
+$16,110
(% of AGI for various income ranges: -1.1% for AGIs below $10k, 1.1% for AGIs $10k-25k, 0.6% for AGIs $25k-50k, 2.6% for AGIs $50k-75k, 1.6% for AGIs $75k-100k, 12.1% for AGIs over 100k)
Profit/loss from business: +$8,995 (reported on 16.9% of returns)
Here:
+$8,995
State:
+$11,013
(% of AGI for various income ranges: 13.1% for AGIs below $10k, 6.7% for AGIs $10k-25k, 3.1% for AGIs $25k-50k, 3.9% for AGIs $50k-75k, 1.8% for AGIs $75k-100k, 8.5% for AGIs over 100k)
IRA payment deduction: $2,720 (reported on 2.1% of returns)
79201:
$2,720
Texas:
$3,120
Total itemized deductions: $17,866 (24% of AGI, reported on 9.8% of returns)
Here:
$17,866
State:
$19,631
Here:
23.8% of AGI
State:
18.9% of AGI
(% of AGI for various income ranges: 5.0% for AGIs $10k-25k, 4.3% for AGIs $25k-50k, 4.2% for AGIs $50k-75k, 6.9% for AGIs $75k-100k, 10.2% for AGIs over 100k)
Charity contributions deductions: $8,213 (10% of AGI, reported on 7.7% of returns)
Here:
$8,213
State:
$4,753
Here:
10.0% of AGI
State:
4.2% of AGI
(% of AGI for various income ranges: 0.8% for AGIs $10k-25k, 1.1% for AGIs $25k-50k, 1.4% for AGIs $50k-75k, 2.4% for AGIs $75k-100k, 5.6% for AGIs over 100k)
Total tax: $4,476 (reported on 65.2% of returns)
79201:
$4,476
State:
$9,058
(% of AGI for various income ranges: 3.9% for AGIs below $10k, 3.7% for AGIs $10k-25k, 6.0% for AGIs $25k-50k, 8.9% for AGIs $50k-75k, 11.3% for AGIs $75k-100k, 19.6% for AGIs over 100k)
Earned income credit: $1,940 (reported on 24.5% of returns)
Here:
$1,940
State:
$2,024
Percentage of individuals using paid preparers for their 2004 taxes: 66.3%
Here:
66%
State:
57%
(% for various income ranges: 62.9% for AGIs below $10k, 70.4% for AGIs $10k-25k, 66.1% for AGIs $25k-50k, 60.6% for AGIs $50k-75k, 72.3% for AGIs $75k-100k, 77.6% for AGIs over 100k)
Household received Food Stamps/SNAP in the past 12 months: 173 Household did not receive Food Stamps/SNAP in the past 12 months: 1,842
Women who had a birth in the past 12 months: 68 (54 now married, 13 unmarried) Women who did not have a birth in the past 12 months: 986 (329 now married, 660 unmarried)
Housing units in zip code 79201 with a mortgage: 489 (31 second mortgage, 10 home equity loan) Median monthly owner costs for units with a mortgage: $1,490 Median monthly owner costs for units without a mortgage: $522
Residents with income below the poverty level in 2022:
This zip code:
14.7%
Whole state:
14.0%
Residents with income below 50% of the poverty level in 2022:
This zip code:
12.7%
Whole state:
7.4%
Median number of rooms in houses and condos:
Here:
6.0
State:
6.3
Median number of rooms in apartments:
Here:
4.7
State:
4.0
Notable locations in this zip code not listed on our city pages
Notable locations in zip code 79201: Cid Gitus Windmill (A), Cutting Flat Windmill (B), Dogtown Windmill (C), Green Windmill (D), High Point (E), Johnson Windmill (F), Lucky Knob Camp (G), Lucky Knob Windmill (H), New Windmill (I), Richland Windmill (J), Turkey Creek Ranch (K), Turtle Hole Camp (L), White Windmill (M), Childress Country Club (N), Childress County Heritage Museum (O), Childress City Fire Department (P). Display/hide their locations on the map
Churches in zip code 79201 include: Fairview United Pentecostal Church (A), Church of Christ Childress (B), Holy Angels Catholic Church (C), Saint John Baptist Church (D), Parkview Baptist Church (E), New Hope Baptist Church (F), Bible Baptist Church (G), Harrell Chapel (H), Lonnie Church (I). Display/hide their locations on the map
Cemeteries: Carey Cemetery (1), Tennessee Valley Cemetery (2), Olympus Cemetery (3), Kirkland Cemetery (4), Haven of Rest Cemetery (5), Arlie Cemetery (6), Loco Cemetery (7). Display/hide their locations on the map
Reservoirs: Nippert Lake (A), Lake Scott (B), Park Lake (C), White Tank (D), Willow Hole Tank (E), Crows Nest Tank (F), Gyp Tank (G), Groclose Lake (H). Display/hide their locations on the map
Streams, rivers, and creeks: Bluff Creek (A), Bitter Lake Creek (B), Turkey Creek (C), Baylor Creek (D), Twin Mill Branch (E), Wind River (F), Sweetwater Creek (G), Rustlers Creek (H), Richland Creek (I). Display/hide their locations on the map
In group quarters: 1,450 (-1 institutionalized population)
Size of family households: 796 2-persons, 386 3-persons, 169 4-persons, 110 5-persons, 28 6-persons, 7 7-or-more-persons
Size of nonfamily households: 505 1-person, 17 2-persons
589 married couples with children.
661 single-parent households (329 men, 332 women).
77.7% of residents of 79201 zip code speak English at home.
22.1% of residents speak Spanish at home (81% very well, 10% well, 9% not well).
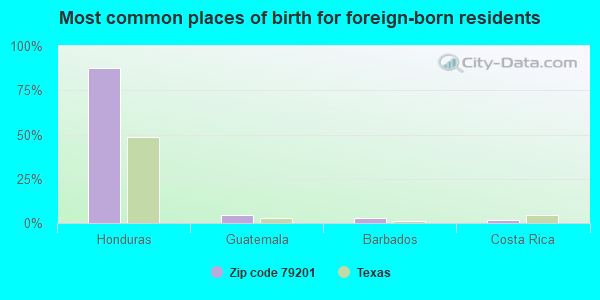
Foreign born population: 593 (8.5%) (19.5% of them are naturalized citizens)
This zip code:
8.5%
Whole state:
17.2%
87%Honduras
4%Guatemala
3%Barbados
1%Costa Rica
0%France
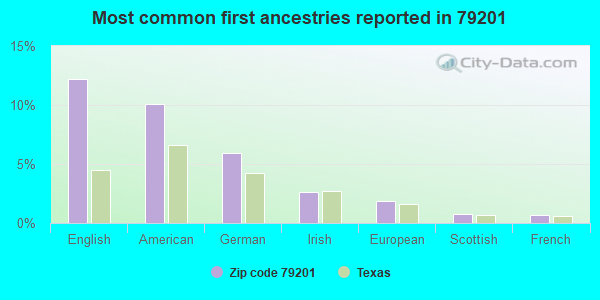
12%English
10%American
6%German
3%Irish
2%European
1%Scottish
1%French
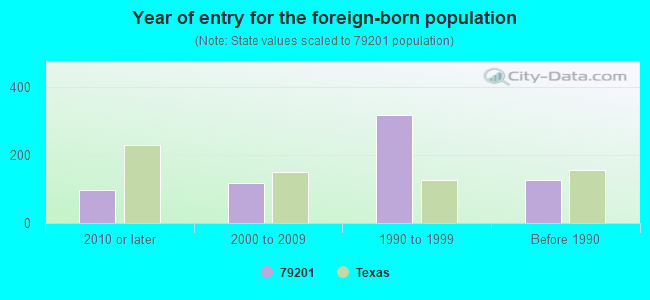
Year of entry for the foreign-born population
982010 or later
1172000 to 2009
3171990 to 1999
126Before 1990
Housing units lacking complete plumbing facilities: 10.7% Housing units lacking complete kitchen facilities: 1.8%
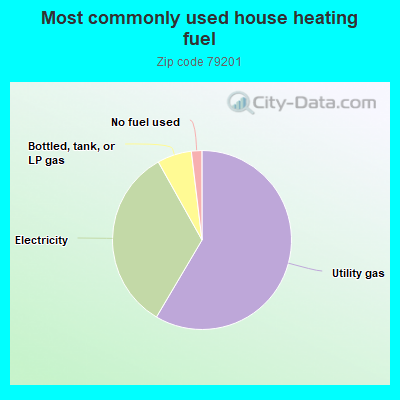
58.5%Utility gas
33.4%Electricity
6.2%Bottled, tank, or LP gas
1.9%No fuel used
Population in 1990: 5,862. Population change in the 1990s: +1,820 (+31.0%).
Place of birth for U.S.-born residents:
This state: 5,051
Northeast: 33
Midwest: 223
South: 706
West: 240
65% of the 79201 zip code residents lived in the same house 5 years ago. Out of people who lived in different houses, 58% lived in this county. Out of people who lived in different counties, 50% lived in Texas.
80% of the 79201 zip code residents lived in the same house 1 year ago. Out of people who lived in different houses, 42% moved from this county. Out of people who lived in different houses, 42% moved from different county within same state. Out of people who lived in different houses, 15% moved from different state.
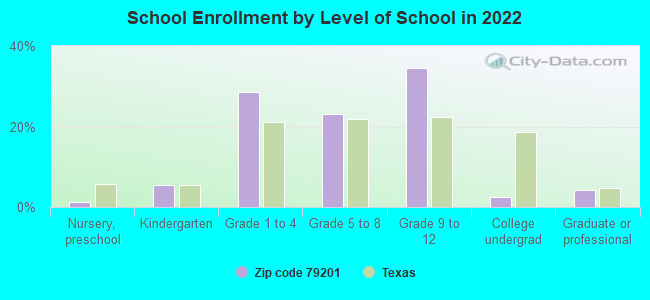
Private vs. public school enrollment:
Students in private schools in grades 1 to 8 (elementary and middle school):
Here:
0.0%
Texas:
8.8%
Students in private schools in grades 9 to 12 (high school):
Here:
0.0%
Texas:
8.0%
Students in private undergraduate colleges:
Here:
0.0%
Texas:
16.2%
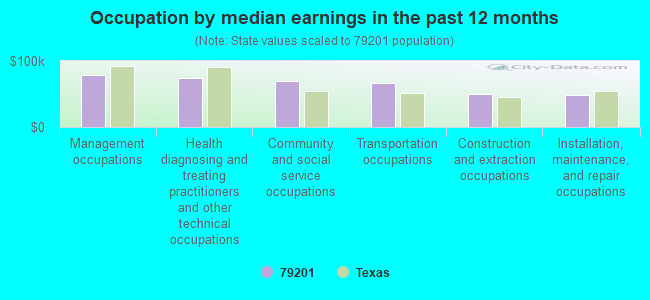
Occupation by median earnings in the past 12 months ($)
79,402Management occupations
73,614Health diagnosing and treating practitioners and other technical occupations
69,638Community and social service occupations
67,098Transportation occupations
50,550Construction and extraction occupations
49,070Installation, maintenance, and repair occupations
Top industries in this zip code by the number of employees in 2005:


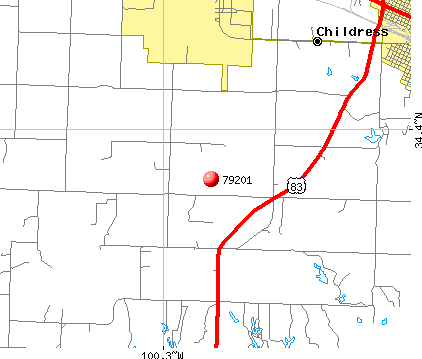 Nearest zip codes: 79259, 79233, 79230, 79248, 73550, 79095.