Estimated zip code population in 2022: 255
Zip code population in 2010: 60
Zip code population in 2000: 101
Houses and condos: 46
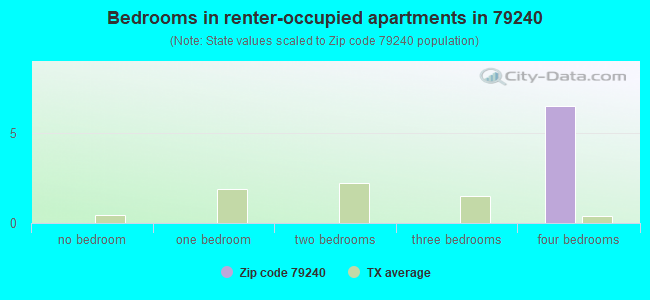
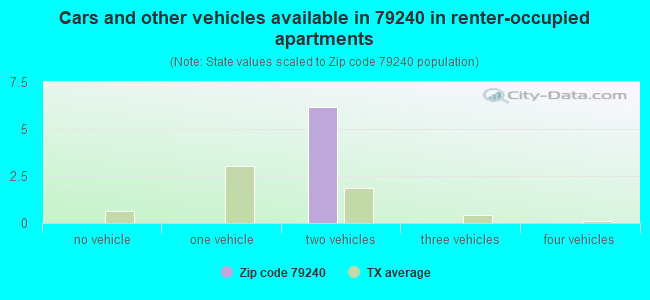
Renter-occupied apartments: 6
| % of renters here: | 23% |
| State: | 38% |
78.7
(low, U.S. average is 100)
Land area: 7.3
sq. mi.
Water area: 0.1
sq. mi.
| Population density: 35 people per square mile | | (very low). |
![Age and Sex of Residents in zip code 79240]()
- OSM Map
- General Map
- Google Map
- MSN Map
- OSM Map
- General Map
- Google Map
- MSN Map
- OSM Map
- General Map
- Google Map
- MSN Map
- OSM Map
- General Map
- Google Map
- MSN Map
Please wait while loading the map...
Business Search - 14 Million verified businesses
| Males: 137 |  (53.8%) (53.8%) |
| Females: 118 |  (46.2%) (46.2%) |
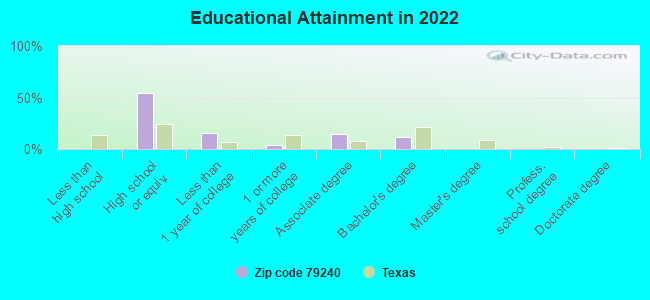
For population 25 years and over in 79240:
- High school or higher: 99.8%
- Bachelor's degree or higher: 12.3%
- Graduate or professional degree: 0.0%
- Mean travel time to work (commute): 24.5 minutes
For population 15 years and over in 79240:
- Never married: 39.3%
- Now married: 40.4%
- Separated: 0.0%
- Widowed: 20.3%
- Divorced: 0.0%
Zip code 79240 compared to state average:
- Median household income above state average.
- Median house value significantly below state average.
- Unemployed percentage significantly below state average.
- Black race population percentage significantly below state average.
- Hispanic race population percentage above state average.
- Median age significantly below state average.
- Foreign-born population percentage significantly below state average.
- Renting percentage below state average.
- Length of stay since moving in significantly above state average.
- Number of rooms per house below state average.
- House age above state average.
- Number of college students significantly below state average.
- Percentage of population with a bachelor's degree or higher significantly below state average.

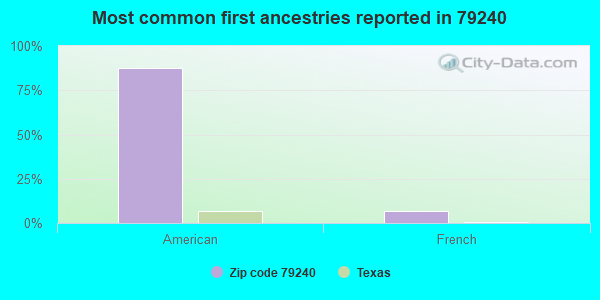
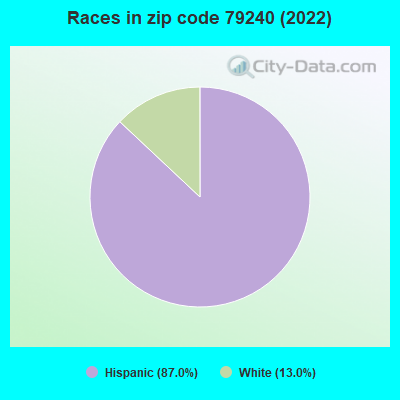
- 22187.0%Hispanic or Latino
- 3313.0%White
Data:
100%
rural population.
Median resident age:| This zip code: | 22.0 years |
| Texas median age: | 35.6 years |
Average household size:| This zip code: | 9.3 people |
| Texas: | 2.6 people |
Averages for the 2004 tax year for zip code 79240, filed in 2005:
Average Adjusted Gross Income (AGI) in 2004: $24,321 (Individual Income Tax Returns)
| Here: | $24,321 |
| State: | $47,881 |
Salary/wage: $20,632 (reported on 67.9% of returns)
| Here: | $20,632 |
| State: | $41,947 |
Total tax: $1,867 (reported on 53.6% of returns)
Percentage of individuals using paid preparers for their 2004 taxes: 82.1%
Estimated median household income in 2022: | This zip code: | $124,333 |
| Texas: | $72,284 |
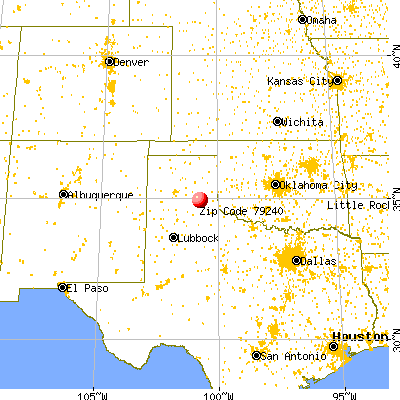
![79240 map]() Nearest zip codes: 79237
Nearest zip codes: 79237,
79226,
79239,
79245,
79251,
79057.
Percentage of family households:| This zip code: | 59.8% |
| Texas: | 50.5% |
Percentage of households with unmarried partners:| This zip code: | 0.0% |
| Texas: | 48.7% |
No gay or lesbian households reported
Household received Food Stamps/SNAP in the past 12 months: 0
Household did not receive Food Stamps/SNAP in the past 12 months: 27
Women who did not have a birth in the past 12 months: 80 (21 now married, 59 unmarried)
Housing units in zip code 79240 with a mortgage: 6
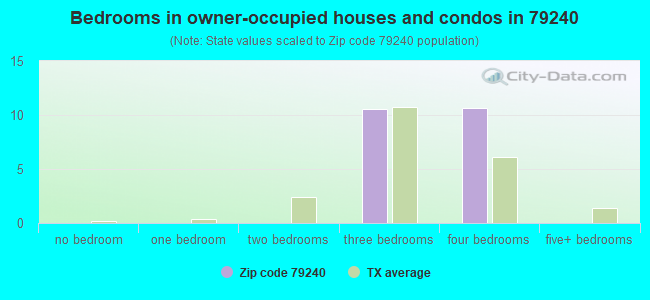
Median number of rooms in houses and condos:

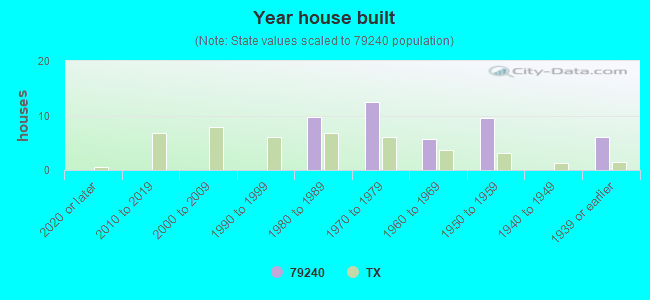
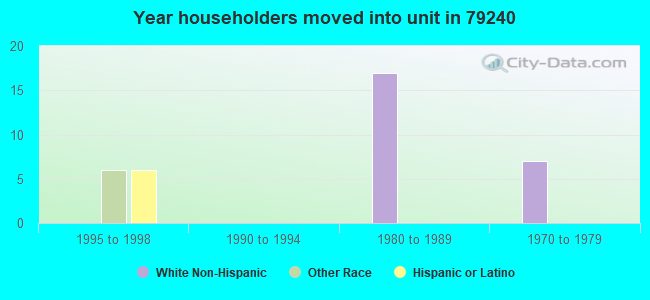
- Year house built (houses)
- 02020 or later
- 02010 to 2019
- 02000 to 2009
- 01990 to 1999
- 101980 to 1989
- 121970 to 1979
- 61960 to 1969
- 101950 to 1959
- 01940 to 1949
- 61939 or earlier
![Zip code 79240 satellite photo by USGS]()
Zip code 79240 household income distribution in 2022
![Zip code 79240 household income distribution in 2022]()
- 6$60,000 to $74,999
- 6$100,000 to $124,999
- 13$125,000 to $149,999
Estimate of home value of owner-occupied houses/condos in 2022 in zip code 79240
![Estimate of home value of owner-occupied houses/condos in 2022 in zip code 79240]()
- 12Less than $10,000
- 2$90,000 to $99,999
- 5$100,000 to $124,999
Estimated median house (or condo) value in 2022 for:
- White Non-Hispanic householders: $268,246
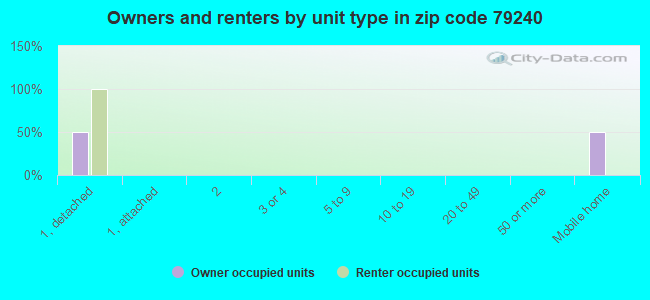
Housing units in structures:
- One, detached: 36
- Mobile homes: 9
Means of transportation to work in zip code 79240
![Means of transportation to work in zip code 79240]()
- 82.9%74Drove a car alone
- 10.1%9Bicycle
Travel time to work (commute) in zip code 79240
![Travel time to work (commute) in zip code 79240]()
- 13Less than 5 minutes
- 85 to 9 minutes
- 710 to 14 minutes
- 1015 to 19 minutes
- 3120 to 24 minutes
- 1060 to 89 minutes
- 690 or more minutes
Percentage of zip code residents living and working in this county: 44.9%
Household type by relationship:
Households: 255
- Male householders: 6 (0 living alone), Female householders: 21 (0 living alone)
35 spouses (35 opposite-sex spouses), 0 unmarried partners, (0 opposite-sex unmarried partners), 109 children (109 natural, 0 adopted, 0 stepchildren), 0 grandchildren, 0 brothers or sisters, 29 parents, 0 foster children, 48 other relatives, 0 non-relatives
Size of family households: 12 2-persons, 4 5-persons, 10 7-or-more-persons
81 married couples with children.
0 single-parent households ().
74.6% of residents of 79240 zip code speak English at home.
24.2% of residents speak Spanish at home (84% very well, 16% well).
Foreign born population: 0 (0.0%)
![Zip code 79240 topographic map]()
Housing units lacking complete plumbing facilities: 11.7%
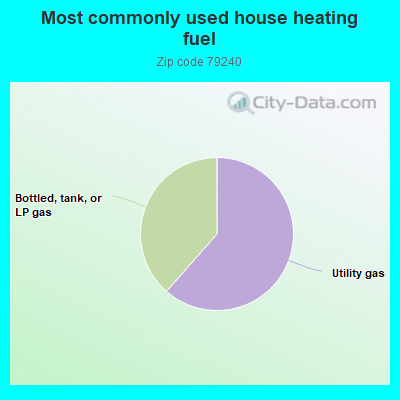
- 65.0%Utility gas
- 40.7%Bottled, tank, or LP gas
Place of birth for U.S.-born residents:
- This state: 235
- Northeast: 6
- West: 10
61% of the 79240 zip code residents lived in the same house 5 years ago.
Out of people who lived in different houses, 52% lived in this county.
87% of the 79240 zip code residents lived in the same house 1 year ago.
Out of people who lived in different houses, 112% moved from different state.
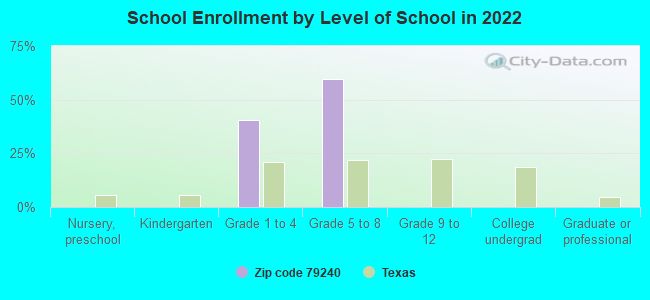
Private vs. public school enrollment:
Students in private schools in grades 1 to 8 (elementary and middle school):
Top industries in this zip code by the number of employees in 2005:
- Professional, Scientific, and Technical Services: Engineering Services (1-4 employees: 1 establishment)
Fatal accident statistics in 2011:
- Fatal accident count: 1
- Vehicles involved in fatal accidents: 1
- Fatal accidents caused by drunken drivers: 0
- Fatalities: 1
- Persons involved in fatal accidents: 1
- Pedestrians involved in fatal accidents: 0
| Most common first names in zip code 79240 among deceased individuals |
| Name | Count | Lived (average) |
|---|
| James | 4 | 76.7 years |
| Albert | 3 | 80.6 years |
| William | 3 | 80.3 years |
| Willard | 2 | 78.5 years |
| Most common last names in zip code 79240 among deceased individuals |
| Last name | Count | Lived (average) |
|---|
| Shields | 3 | 74.0 years |
| Bowling | 2 | 83.0 years |
| Jaramillo | 2 | 74.0 years |
| Denton | 2 | 78.5 years |
| Lauderdale | 2 | 77.5 years |
| Cook | 2 | 85.5 years |
| Leathers | 2 | 76.0 years |
| Moore | 2 | 76.0 years |
| Nelson | 2 | 78.5 years |
| Poole | 2 | 79.0 years |


 Nearest zip codes: 79237, 79226, 79239, 79245, 79251, 79057.