Estimated zip code population in 2022: 4,268 Zip code population in 2010: 3,669 Zip code population in 2000: 2,448
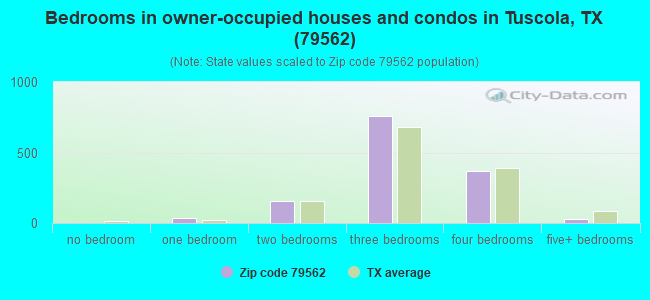
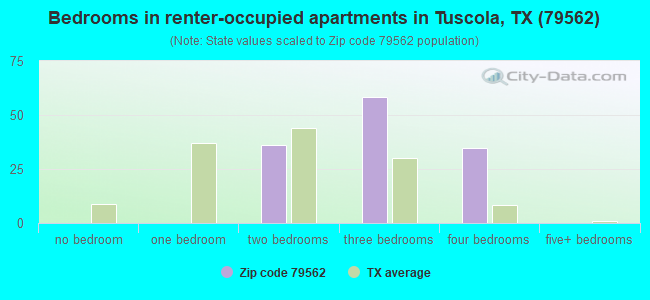
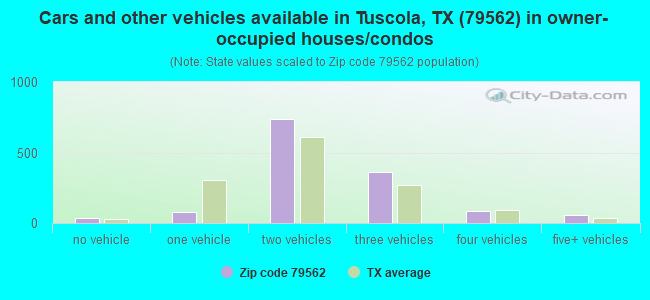
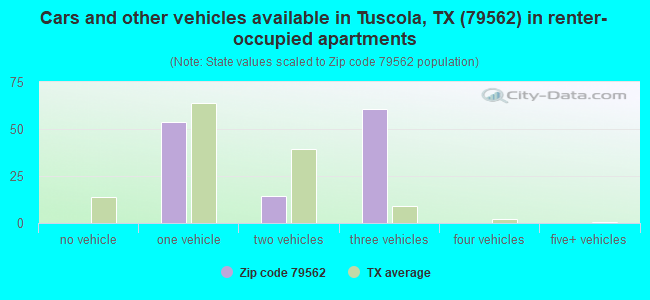
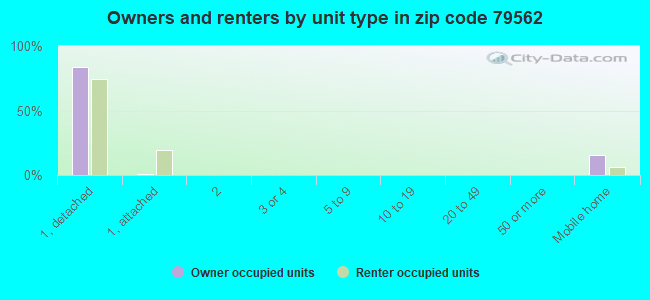
Houses and condos: 1,495 Renter-occupied apartments: 130
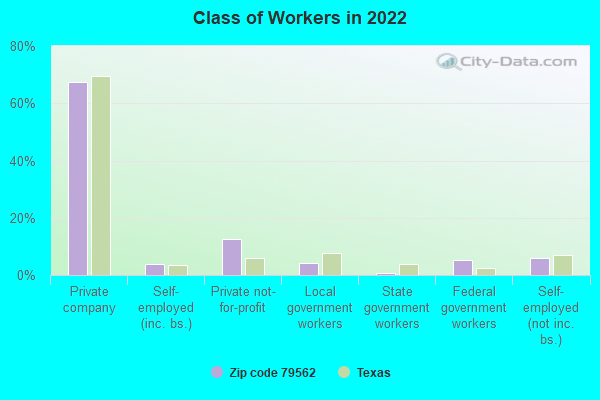
% of renters here:
9%
State:
38%
March 2022 cost of living index in zip code 79562: 81.2 (low, U.S. average is 100)
Land area: 116.1 sq. mi. Water area: 0.9 sq. mi.
Population density: 37 people per square mile
(very low).
OSM Map
General Map
Google Map
MSN Map
OSM Map
General Map
Google Map
MSN Map
OSM Map
General Map
Google Map
MSN Map
OSM Map
General Map
Google Map
MSN Map
Please wait while loading the map...
Real estate property taxes paid for housing units in 2022:
This zip code:
1.0% ($3,223)
Texas:
1.5% ($4,050)
Median real estate property taxes paid for housing units with mortgages in 2022: $4,000 (1.2%) Median real estate property taxes paid for housing units with no mortgage in 2022: $1,838 (0.8%)
Business Search- 14 Million verified businesses
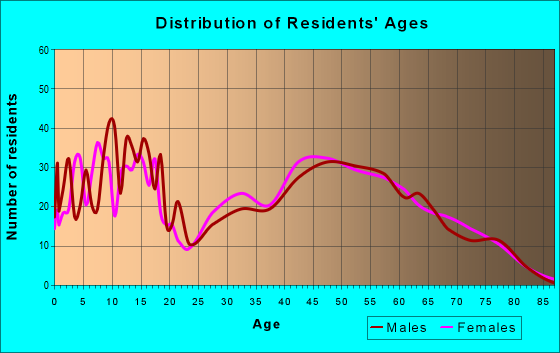
Males: 2,209
(51.8%)
Females: 2,059
(48.2%)
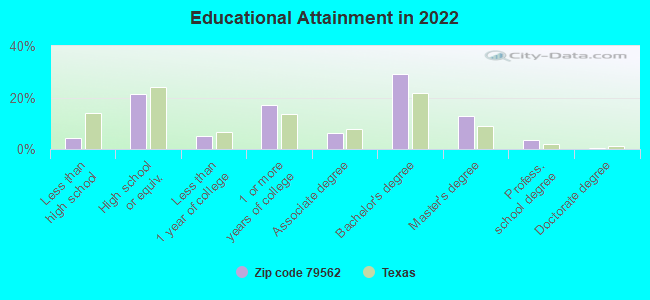
For population 25 years and over in 79562:
High school or higher: 96.8%
Bachelor's degree or higher: 46.7%
Graduate or professional degree: 17.2%
Unemployed: 0.8%
Mean travel time to work (commute): 23.1 minutes
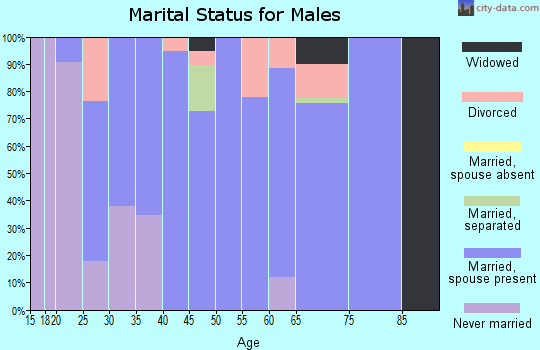
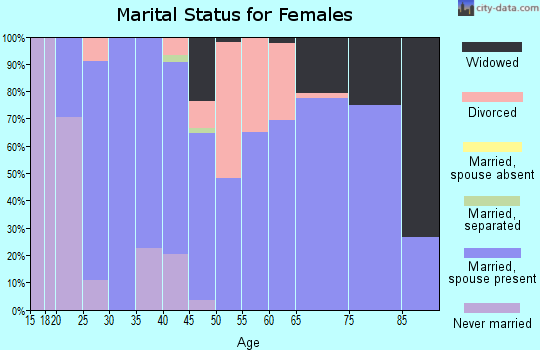
For population 15 years and over in 79562:
Never married: 15.0%
Now married: 73.9%
Separated: 0.8%
Widowed: 7.6%
Divorced: 2.7%
Zip code 79562 compared to state average:
Median household income above state average.
Unemployed percentage significantly below state average.
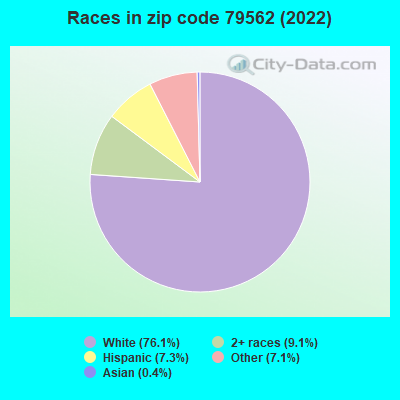
Black race population percentage significantly below state average.
Hispanic race population percentage significantly below state average.
Foreign-born population percentage significantly below state average.
Renting percentage significantly below state average.
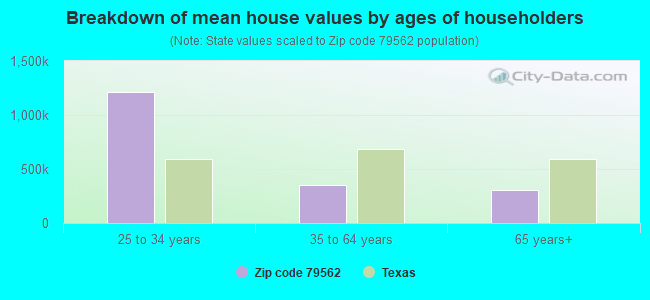
Estimated median house/condo value in 2022: $308,610
79562:
$308,610
Texas:
$275,400
According to our research of Texas and other state lists, there were 5 registered sex offenders living in 79562 zip code as of April 25, 2024. The ratio of all residents to sex offenders in zip code 79562 is 827 to 1. The ratio of registered sex offenders to all residents in this zip code is lower than the state average.
Median resident age:
This zip code:
38.3 years
Texas median age:
35.6 years
Average household size:
This zip code:
2.9 people
Texas:
2.6 people
Averages for the 2020 tax year for zip code 79562, filed in 2021:
Average Adjusted Gross Income (AGI) in 2020: $93,073 (Individual Income Tax Returns)
Here:
$93,073
State:
$77,054
Salary/wage: $80,777 (reported on 83.5% of returns)
Here:
$80,777
State:
$62,766
(% of AGI for various income ranges: 1159.0% for AGIs below $25k, 3435.7% for AGIs $25k-50k, 5649.2% for AGIs $50k-75k, 8888.4% for AGIs $75k-100k, 18560.5% for AGIs $100k-200k, 60381.4% for AGIs over 200k)
Taxable interest for individuals: $1,396 (reported on 34.3% of returns)
This zip code:
$1,396
Texas:
$2,665
(% of AGI for various income ranges: 14.6% for AGIs below $25k, 19.4% for AGIs $25k-50k, 29.2% for AGIs $50k-75k, 66.4% for AGIs $75k-100k, 67.2% for AGIs $100k-200k, 801.4% for AGIs over 200k)
Ordinary dividends: $3,890 (reported on 21.0% of returns)
Here:
$3,890
State:
$10,044
(% of AGI for various income ranges: 29.8% for AGIs below $25k, 22.6% for AGIs $25k-50k, 80.0% for AGIs $50k-75k, 76.0% for AGIs $75k-100k, 147.4% for AGIs $100k-200k, 1235.7% for AGIs over 200k)
Net capital gain/loss in AGI: +$15,984 (reported on 19.8% of returns)
Here:
+$15,984
State:
+$39,590
(% of AGI for various income ranges: 8.8% for AGIs below $25k, 39.1% for AGIs $25k-50k, 100.4% for AGIs $50k-75k, 155.6% for AGIs $75k-100k, 526.4% for AGIs $100k-200k, 7108.6% for AGIs over 200k)
Profit/loss from business: +$19,336 (reported on 22.2% of returns)
Here:
+$19,336
State:
+$10,888
(% of AGI for various income ranges: 123.9% for AGIs below $25k, 209.1% for AGIs $25k-50k, 262.5% for AGIs $50k-75k, 408.0% for AGIs $75k-100k, 317.7% for AGIs $100k-200k, 9294.3% for AGIs over 200k)
Taxable individual retirement arrangement distribution: $20,055 (reported on 8.1% of returns)
79562:
$20,055
Texas:
$24,740
(% of AGI for various income ranges: 68.8% for AGIs below $25k, 99.7% for AGIs $25k-50k, 212.1% for AGIs $50k-75k, 195.2% for AGIs $75k-100k, 611.0% for AGIs $100k-200k)
Total itemized deductions: $40,739 (reported on 9.3% of returns)
Here:
$40,739
State:
$40,428
(% of AGI for various income ranges: 275.7% for AGIs $25k-50k, 303.6% for AGIs $75k-100k, 767.4% for AGIs $100k-200k, 6647.1% for AGIs over 200k)
Charity contributions: $19,132 (reported on 7.7% of returns)
Here:
$19,132
State:
$18,201
(% of AGI for various income ranges: 31.7% for AGIs $25k-50k, 105.6% for AGIs $75k-100k, 245.6% for AGIs $100k-200k, 3288.6% for AGIs over 200k)
Taxes paid: $7,332 (reported on 8.9% of returns)
79562:
$7,332
State:
$7,821
(% of AGI for various income ranges: 39.7% for AGIs $25k-50k, 66.0% for AGIs $75k-100k, 152.1% for AGIs $100k-200k, 1022.9% for AGIs over 200k)
Earned income credit: $2,121 (reported on 9.7% of returns)
Here:
$2,121
State:
$2,584
(% of AGI for various income ranges: 65.9% for AGIs below $25k, 68.3% for AGIs $25k-50k)
Percentage of individuals using paid preparers for their 2020 taxes: 94.4%
Here:
94%
State:
92%
(% for various income ranges: 93.1% for AGIs below $25k, 92.9% for AGIs $25k-50k, 93.3% for AGIs $50k-75k, 93.9% for AGIs $75k-100k, 96.9% for AGIs $100k-200k, 95.0% for AGIs over 200k)
Averages for the 2012 tax year for zip code 79562, filed in 2013:
Average Adjusted Gross Income (AGI) in 2012: $72,115 (Individual Income Tax Returns)
Here:
$72,115
State:
$65,384
Salary/wage: $58,968 (reported on 86.0% of returns)
Here:
$58,968
State:
$52,524
(% of AGI for various income ranges: 74.2% for AGIs below $25k, 81.8% for AGIs $25k-50k, 81.2% for AGIs $50k-75k, 80.8% for AGIs $75k-100k, 76.1% for AGIs $100k-200k, 43.3% for AGIs over 200k)
Taxable interest for individuals: $1,050 (reported on 40.4% of returns)
This zip code:
$1,050
Texas:
$2,372
(% of AGI for various income ranges: 1.2% for AGIs below $25k, 0.4% for AGIs $25k-50k, 0.8% for AGIs $50k-75k, 0.5% for AGIs $75k-100k, 0.5% for AGIs $100k-200k, 0.7% for AGIs over 200k)
Ordinary dividends: $3,556 (reported on 20.2% of returns)
Here:
$3,556
State:
$9,721
(% of AGI for various income ranges: 1.6% for AGIs below $25k, 0.9% for AGIs $25k-50k, 0.9% for AGIs $50k-75k, 0.6% for AGIs $75k-100k, 1.1% for AGIs $100k-200k, 1.0% for AGIs over 200k)
Net capital gain/loss in AGI: +$13,207 (reported on 16.3% of returns)
Here:
+$13,207
State:
+$35,319
(% of AGI for various income ranges: 0.4% for AGIs $25k-50k, 0.5% for AGIs $50k-75k, 0.5% for AGIs $75k-100k, 0.6% for AGIs $100k-200k, 11.2% for AGIs over 200k)
Profit/loss from business: +$17,951 (reported on 23.0% of returns)
Here:
+$17,951
State:
+$13,732
(% of AGI for various income ranges: 7.6% for AGIs below $25k, 6.8% for AGIs $25k-50k, 4.0% for AGIs $50k-75k, 3.3% for AGIs $75k-100k, 5.9% for AGIs $100k-200k, 7.2% for AGIs over 200k)
Taxable individual retirement arrangement distribution: $13,687 (reported on 8.4% of returns)
79562:
$13,687
Texas:
$19,511
(% of AGI for various income ranges: 4.1% for AGIs below $25k, 1.8% for AGIs $25k-50k, 2.1% for AGIs $50k-75k, 0.6% for AGIs $75k-100k, 2.6% for AGIs $100k-200k)
Total itemized deductions: $21,481 (16% of AGI, reported on 29.2% of returns)
Here:
$21,481
State:
$24,724
Here:
16.3% of AGI
State:
15.9% of AGI
(% of AGI for various income ranges: 9.2% for AGIs below $25k, 10.0% for AGIs $25k-50k, 7.9% for AGIs $50k-75k, 8.7% for AGIs $75k-100k, 9.0% for AGIs $100k-200k, 8.2% for AGIs over 200k)
Charity contributions: $6,481 (reported on 23.6% of returns)
Here:
$6,481
State:
$6,808
(% of AGI for various income ranges: 1.2% for AGIs $25k-50k, 1.3% for AGIs $50k-75k, 1.9% for AGIs $75k-100k, 2.0% for AGIs $100k-200k, 3.7% for AGIs over 200k)
Taxes paid: $4,606 (reported on 29.2% of returns)
79562:
$4,606
State:
$6,921
(% of AGI for various income ranges: 1.3% for AGIs below $25k, 1.9% for AGIs $25k-50k, 1.7% for AGIs $50k-75k, 1.9% for AGIs $75k-100k, 2.2% for AGIs $100k-200k, 1.6% for AGIs over 200k)
Earned income credit: $2,095 (reported on 12.4% of returns)
Here:
$2,095
State:
$2,570
(% of AGI for various income ranges: 5.0% for AGIs below $25k, 1.2% for AGIs $25k-50k)
Percentage of individuals using paid preparers for their 2012 taxes: 56.2%
Here:
56%
State:
51%
(% for various income ranges: 49.1% for AGIs below $25k, 52.8% for AGIs $25k-50k, 59.3% for AGIs $50k-75k, 59.1% for AGIs $75k-100k, 60.6% for AGIs $100k-200k, 85.7% for AGIs over 200k)
Averages for the 2004 tax year for zip code 79562, filed in 2005:
Average Adjusted Gross Income (AGI) in 2004: $47,541 (Individual Income Tax Returns)
Here:
$47,541
State:
$47,881
Salary/wage: $43,187 (reported on 85.4% of returns)
Here:
$43,187
State:
$41,947
(% of AGI for various income ranges: 130.1% for AGIs below $10k, 78.7% for AGIs $10k-25k, 85.4% for AGIs $25k-50k, 85.6% for AGIs $50k-75k, 83.1% for AGIs $75k-100k, 61.6% for AGIs over 100k)
Taxable interest for individuals: $1,164 (reported on 46.8% of returns)
This zip code:
$1,164
Texas:
$2,255
(% of AGI for various income ranges: 7.2% for AGIs below $10k, 2.2% for AGIs $10k-25k, 0.6% for AGIs $25k-50k, 0.7% for AGIs $50k-75k, 0.8% for AGIs $75k-100k, 1.4% for AGIs over 100k)
Taxable dividends: $2,558 (reported on 20.8% of returns)
Here:
$2,558
State:
$4,261
(% of AGI for various income ranges: 5.3% for AGIs below $10k, 0.4% for AGIs $10k-25k, 0.7% for AGIs $25k-50k, 0.7% for AGIs $50k-75k, 0.3% for AGIs $75k-100k, 2.2% for AGIs over 100k)
Net capital gain/loss: +$10,062 (reported on 17.9% of returns)
Here:
+$10,062
State:
+$16,110
(% of AGI for various income ranges: 4.7% for AGIs below $10k, -0.4% for AGIs $10k-25k, 0.3% for AGIs $25k-50k, 0.2% for AGIs $50k-75k, 1.7% for AGIs $75k-100k, 10.6% for AGIs over 100k)
Profit/loss from business: +$9,331 (reported on 25.6% of returns)
Here:
+$9,331
State:
+$11,013
(% of AGI for various income ranges: 16.9% for AGIs below $10k, 7.9% for AGIs $10k-25k, 8.0% for AGIs $25k-50k, 4.1% for AGIs $50k-75k, 2.7% for AGIs $75k-100k, 4.5% for AGIs over 100k)
IRA payment deduction: $3,114 (reported on 3.5% of returns)
79562:
$3,114
Texas:
$3,120
(% of AGI for various income ranges: 0.8% for AGIs $10k-25k, 0.5% for AGIs $50k-75k, 0.2% for AGIs over 100k)
Total itemized deductions: $17,034 (20% of AGI, reported on 26.0% of returns)
Here:
$17,034
State:
$19,631
Here:
19.7% of AGI
State:
18.9% of AGI
(% of AGI for various income ranges: 23.8% for AGIs below $10k, 6.8% for AGIs $10k-25k, 7.9% for AGIs $25k-50k, 11.5% for AGIs $50k-75k, 11.2% for AGIs $75k-100k, 7.4% for AGIs over 100k)
Charity contributions deductions: $4,462 (5% of AGI, reported on 21.8% of returns)
Here:
$4,462
State:
$4,753
Here:
4.9% of AGI
State:
4.2% of AGI
(% of AGI for various income ranges: 1.0% for AGIs $10k-25k, 1.4% for AGIs $25k-50k, 2.0% for AGIs $50k-75k, 2.9% for AGIs $75k-100k, 2.2% for AGIs over 100k)
Total tax: $7,056 (reported on 76.8% of returns)
79562:
$7,056
State:
$9,058
(% of AGI for various income ranges: 5.6% for AGIs below $10k, 4.2% for AGIs $10k-25k, 6.0% for AGIs $25k-50k, 7.9% for AGIs $50k-75k, 10.4% for AGIs $75k-100k, 19.5% for AGIs over 100k)
Earned income credit: $1,739 (reported on 14.1% of returns)
Here:
$1,739
State:
$2,024
Percentage of individuals using paid preparers for their 2004 taxes: 63.0%
Here:
63%
State:
57%
(% for various income ranges: 57.3% for AGIs below $10k, 60.2% for AGIs $10k-25k, 64.5% for AGIs $25k-50k, 60.2% for AGIs $50k-75k, 66.7% for AGIs $75k-100k, 80.2% for AGIs over 100k)
Household received Food Stamps/SNAP in the past 12 months: 61 Household did not receive Food Stamps/SNAP in the past 12 months: 1,413
Women who had a birth in the past 12 months: 11 (7 now married, 3 unmarried) Women who did not have a birth in the past 12 months: 888 (622 now married, 258 unmarried)
Housing units in zip code 79562 with a mortgage: 772 (30 second mortgage) Houses without a mortgage: 1
Median monthly owner costs for units with a mortgage: $2,145 Median monthly owner costs for units without a mortgage: $652
Residents with income below the poverty level in 2022:
This zip code:
2.8%
Whole state:
14.0%
Residents with income below 50% of the poverty level in 2022:
This zip code:
0.8%
Whole state:
7.4%
Median number of rooms in houses and condos:
Here:
6.3
State:
6.3
Median number of rooms in apartments:
Here:
5.9
State:
4.0
Notable locations in this zip code not listed on our city pages
Notable locations in zip code 79562: Abilene Speedway (A), Camp Tonkawa (B), Elm Creek Citizens Association Volunteer Fire Department Station 2 (C), Tuscola Fire Department (D), Jim Ned Volunteer Fire Department (E), Elm Creek Citizens Association Volunteer Fire Department Station 1 (F), South Taylor Emergency Medical Service (G). Display/hide their locations on the map
Reservoirs: Caterpillar Lake (A), Lake Abilene (B), Soil Conservation Service Site 17 Reservoir (C), Soil Conservation Service Site 16 Reservoir (D), Soil Conservation Service Site 17b1 Reservoir (E). Display/hide their locations on the map
Size of family households: 624 2-persons, 97 3-persons, 508 4-persons, 74 5-persons, 13 6-persons
Size of nonfamily households: 141 1-person
1,007 married couples with children.
64 single-parent households (32 men, 32 women).
97.5% of residents of 79562 zip code speak English at home.
2.5% of residents speak Spanish at home (78% very well, 22% well).
0.4% of residents speak Asian or Pacific Island language at home (100% well).
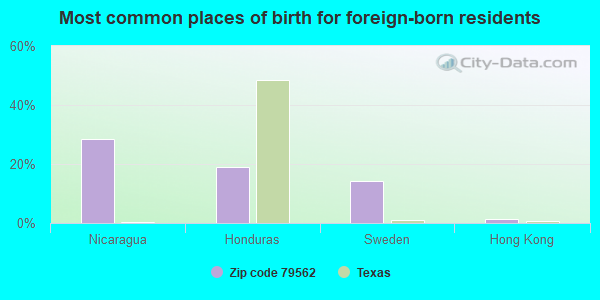
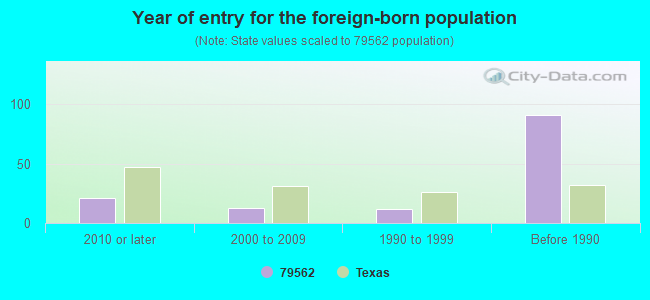
Foreign born population: 86 (2.0%) (63.5% of them are naturalized citizens)
This zip code:
2.0%
Whole state:
17.2%
29%Nicaragua
19%Honduras
14%Sweden
1%Hong Kong
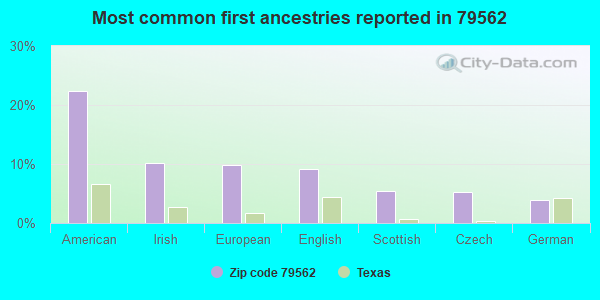
22%American
10%Irish
10%European
9%English
5%Scottish
5%Czech
4%German
Year of entry for the foreign-born population
212010 or later
132000 to 2009
121990 to 1999
91Before 1990
Housing units lacking complete plumbing facilities: 1.4% Housing units lacking complete kitchen facilities: 2.6%
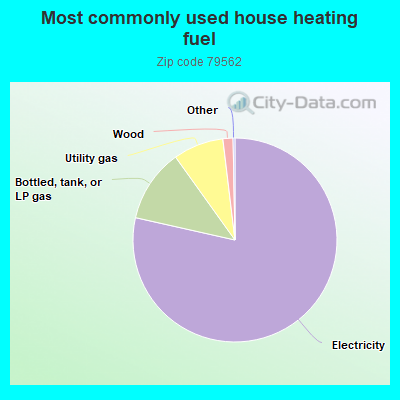
78.6%Electricity
11.6%Bottled, tank, or LP gas
8.0%Utility gas
1.6%Wood
Population in 1990: 2,980.
Place of birth for U.S.-born residents:
This state: 2,993
Northeast: 154
Midwest: 112
South: 565
West: 284
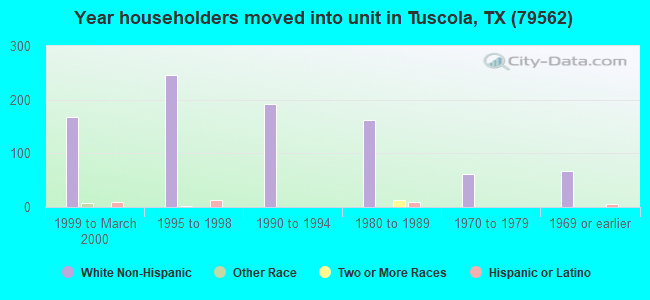
50% of the 79562 zip code residents lived in the same house 5 years ago. Out of people who lived in different houses, 59% lived in this county. Out of people who lived in different counties, 50% lived in Texas.
91% of the 79562 zip code residents lived in the same house 1 year ago. Out of people who lived in different houses, 79% moved from this county. Out of people who lived in different houses, 7% moved from different county within same state. Out of people who lived in different houses, 10% moved from different state.
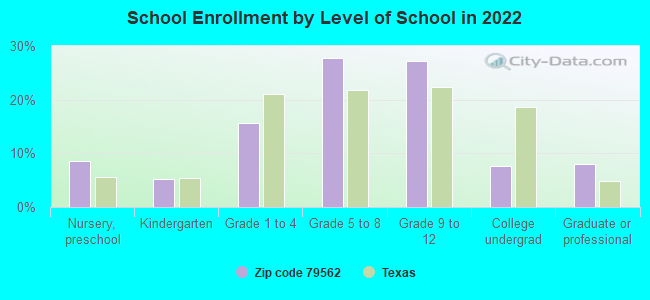
Private vs. public school enrollment:
Students in private schools in grades 1 to 8 (elementary and middle school):
Here:
0.0%
Texas:
8.8%
Students in private schools in grades 9 to 12 (high school):
Here:
0.0%
Texas:
8.0%
Students in private undergraduate colleges:
Here:
0.0%
Texas:
16.2%
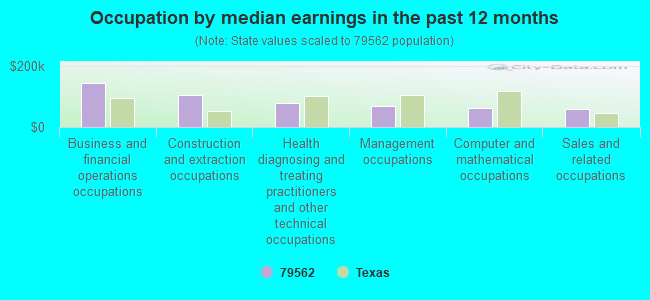
Occupation by median earnings in the past 12 months ($)
143,245Business and financial operations occupations
105,220Construction and extraction occupations
77,577Health diagnosing and treating practitioners and other technical occupations
67,813Management occupations
62,470Computer and mathematical occupations
57,914Sales and related occupations
Companies with federal contracts located in this zip code (TUSCOLA, TX):
CAMCAT INC (365 CR 322; small business) : $281,940 in 15 contractsfrom 2000 to 2005
Contracts for Installation of Equipment -- Miscellaneous, Maintenance, Repair and Rebuilding of Equipment -- Communication, Detection, and Coherent Radiation Equipment, Maintenance, Repair and Rebuilding of Equipment -- Miscellaneous, Installation of Equipment -- Electric Wire, and Power and Distribution Equipment, and moreby Air Force Signed by year:2000: $9,246; 2001: $24,817; 2002: $84,087; 2003: $52,000; 2004: $0; 2005: $111,790; 2006: $0.
Biggest contracts:
$64,217 with Air Force for Installation of Equipment -- Miscellaneous. Signed on 2005-05-17. Completion date: 2005-05-28.
$52,000 with Air Force for Maintenance, Repair and Rebuilding of Equipment -- Communication, Detection, and Coherent Radiation Equipment. Signed on 2003-07-31. Completion date: 2003-09-01.
$41,150 with Air Force for Maintenance, Repair and Rebuilding of Equipment -- Miscellaneous. Signed on 2002-07-23. Completion date: 2002-07-23.
$29,492 with Air Force for Installation of Equipment -- Electric Wire, and Power and Distribution Equipment. Signed on 2002-09-23. Completion date: 2002-09-23.
SPEEGLE, WILLIAM L (3518 HWY 83; small business) : $195,837 in 2 contractsin 2005
$183,193 with Army for Fueling and Other Petroleum Services - Excluding Storage. Signed on 2005-02-24. Completion date: 2006-03-31.
$12,644, same as above.Signed on 2005-04-12. Completion date: 2006-03-31.
JAMES HENSON (1339 S HWY 8384; small business) : $11,600 in 3 contractsfrom 2004 to 2005
$26,000 with Air Force for Landscaping/Groundskeeping Services. Signed on 2004-05-03. Completion date: 2004-09-03.
$0, same as above.Signed on 2005-10-11. Completion date: 2005-09-30.
-$14,400, same as above.Signed on 2005-10-11. Completion date: 2005-09-30.
RAFE C HARSHBERGER (208 STEAMBOAT DRIVE; small business)
$6,600 with Air Force for Other Education and Training Services. Signed on 2004-10-01. Completion date: 2005-09-30.
Top industries in this zip code by the number of employees in 2005:
Other Services (except Public Administration): Car Washes (20-49 employees: 2 establishments)
Accommodation and Food Services: Limited-Service Restaurants (10-19: 1)
Construction: Commercial and Institutional Building Construction (5-9: 2)
Construction: All Other Specialty Trade Contractors (5-9: 1)
Administrative and Support and Waste Management and Remediation Services: Landscaping Services (5-9: 1)
Other Services (except Public Administration): Funeral Homes and Funeral Services (5-9: 1)
Utilities: Water Supply and Irrigation Systems (5-9: 1)
Finance and Insurance: Commercial Banking (5-9: 1)
Fatal accident statistics in 2014:
Fatal accident count: 1
Vehicles involved in fatal accidents: 1
Fatal accidents caused by drunken drivers: 0
Fatalities: 1
Persons involved in fatal accidents: 1
Pedestrians involved in fatal accidents: 0
Fatal accident statistics in 2010:
Fatal accident count: 2
Vehicles involved in fatal accidents: 3
Fatal accidents caused by drunken drivers: 0
Fatalities: 2
Persons involved in fatal accidents: 4
Pedestrians involved in fatal accidents: 0
Home Mortgage Disclosure Act Aggregated Statistics For Year 2009 (Based on 4 partial tracts)
A) FHA, FSA/RHS & VA Home Purchase Loans
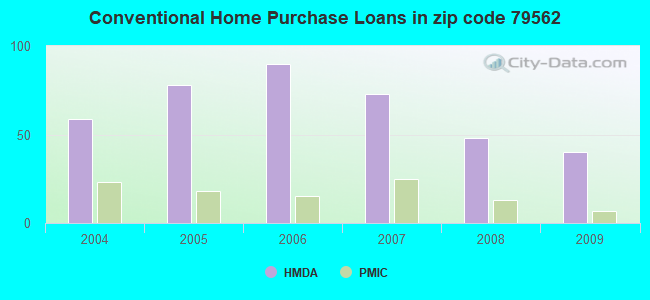
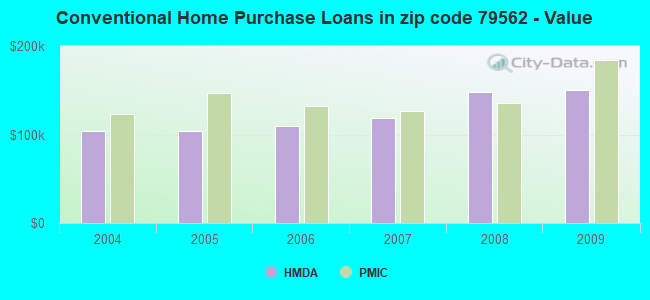
B) Conventional Home Purchase Loans
C) Refinancings
D) Home Improvement Loans
F) Non-occupant Loans on < 5 Family Dwellings (A B C & D)
G) Loans On Manufactured Home Dwelling (A B C & D)
Number
Average Value
Number
Average Value
Number
Average Value
Number
Average Value
Number
Average Value
Number
Average Value
LOANS ORIGINATED
35
$155,338
40
$149,918
73
$156,169
19
$61,087
9
$90,797
7
$44,369
APPLICATIONS APPROVED, NOT ACCEPTED
2
$103,100
4
$53,268
4
$202,865
0
$0
0
$0
4
$68,382
APPLICATIONS DENIED
2
$90,185
3
$162,243
29
$187,356
7
$35,759
1
$114,100
3
$68,527
APPLICATIONS WITHDRAWN
2
$116,310
1
$111,000
15
$216,453
0
$0
0
$0
0
$0
FILES CLOSED FOR INCOMPLETENESS
1
$92,690
2
$42,215
2
$243,245
1
$1,770
0
$0
1
$56,090
Aggregated Statistics For Year 2008 (Based on 4 partial tracts)
A) FHA, FSA/RHS & VA Home Purchase Loans
B) Conventional Home Purchase Loans
C) Refinancings
D) Home Improvement Loans
F) Non-occupant Loans on < 5 Family Dwellings (A B C & D)
G) Loans On Manufactured Home Dwelling (A B C & D)
Number
Average Value
Number
Average Value
Number
Average Value
Number
Average Value
Number
Average Value
Number
Average Value
LOANS ORIGINATED
34
$138,443
48
$148,014
37
$162,396
20
$30,329
7
$108,754
7
$57,450
APPLICATIONS APPROVED, NOT ACCEPTED
1
$68,980
6
$80,815
5
$135,032
3
$16,760
0
$0
3
$34,907
APPLICATIONS DENIED
2
$145,905
13
$146,913
24
$124,599
15
$29,690
1
$48,880
5
$42,466
APPLICATIONS WITHDRAWN
1
$57,270
2
$169,505
11
$154,543
1
$22,200
0
$0
0
$0
FILES CLOSED FOR INCOMPLETENESS
1
$223,750
1
$58,560
3
$145,433
1
$1,770
0
$0
0
$0
Aggregated Statistics For Year 2007 (Based on 4 partial tracts)
A) FHA, FSA/RHS & VA Home Purchase Loans
B) Conventional Home Purchase Loans
C) Refinancings
D) Home Improvement Loans
F) Non-occupant Loans on < 5 Family Dwellings (A B C & D)
G) Loans On Manufactured Home Dwelling (A B C & D)
Number
Average Value
Number
Average Value
Number
Average Value
Number
Average Value
Number
Average Value
Number
Average Value
LOANS ORIGINATED
21
$133,997
73
$118,956
36
$136,095
31
$33,709
6
$99,793
7
$49,423
APPLICATIONS APPROVED, NOT ACCEPTED
0
$0
12
$88,892
8
$124,086
3
$29,463
1
$87,970
5
$53,660
APPLICATIONS DENIED
1
$91,510
10
$81,535
33
$136,603
22
$28,546
2
$77,045
5
$44,654
APPLICATIONS WITHDRAWN
1
$136,970
7
$77,954
21
$118,771
3
$19,543
2
$73,690
0
$0
FILES CLOSED FOR INCOMPLETENESS
0
$0
1
$152,290
3
$163,957
2
$71,965
0
$0
0
$0
Aggregated Statistics For Year 2006 (Based on 4 partial tracts)
A) FHA, FSA/RHS & VA Home Purchase Loans
B) Conventional Home Purchase Loans
C) Refinancings
D) Home Improvement Loans
F) Non-occupant Loans on < 5 Family Dwellings (A B C & D)
G) Loans On Manufactured Home Dwelling (A B C & D)
Number
Average Value
Number
Average Value
Number
Average Value
Number
Average Value
Number
Average Value
Number
Average Value
LOANS ORIGINATED
11
$138,495
90
$109,812
37
$134,659
22
$29,116
7
$141,987
5
$53,722
APPLICATIONS APPROVED, NOT ACCEPTED
1
$158,820
7
$45,120
4
$103,158
3
$23,637
1
$189,560
4
$27,788
APPLICATIONS DENIED
2
$48,305
32
$124,014
36
$107,793
21
$32,246
9
$265,489
9
$47,697
APPLICATIONS WITHDRAWN
3
$107,333
8
$95,538
33
$127,118
5
$54,092
0
$0
1
$37,270
FILES CLOSED FOR INCOMPLETENESS
0
$0
1
$131,340
10
$140,308
1
$23,430
0
$0
0
$0
Aggregated Statistics For Year 2005 (Based on 4 partial tracts)
A) FHA, FSA/RHS & VA Home Purchase Loans
B) Conventional Home Purchase Loans
C) Refinancings
D) Home Improvement Loans
F) Non-occupant Loans on < 5 Family Dwellings (A B C & D)
G) Loans On Manufactured Home Dwelling (A B C & D)
Number
Average Value
Number
Average Value
Number
Average Value
Number
Average Value
Number
Average Value
Number
Average Value
LOANS ORIGINATED
15
$103,366
78
$103,979
46
$115,943
21
$57,272
4
$93,578
4
$62,272
APPLICATIONS APPROVED, NOT ACCEPTED
1
$72,620
16
$66,359
8
$75,791
1
$92,130
1
$39,560
5
$61,186
APPLICATIONS DENIED
2
$96,465
33
$69,190
42
$98,915
17
$32,466
2
$95,325
18
$51,875
APPLICATIONS WITHDRAWN
0
$0
5
$103,174
25
$127,505
5
$123,642
1
$91,720
1
$41,330
FILES CLOSED FOR INCOMPLETENESS
0
$0
1
$162,970
7
$139,390
1
$175,340
0
$0
0
$0
Aggregated Statistics For Year 2004 (Based on 4 partial tracts)
A) FHA, FSA/RHS & VA Home Purchase Loans
B) Conventional Home Purchase Loans
C) Refinancings
D) Home Improvement Loans
F) Non-occupant Loans on < 5 Family Dwellings (A B C & D)
G) Loans On Manufactured Home Dwelling (A B C & D)
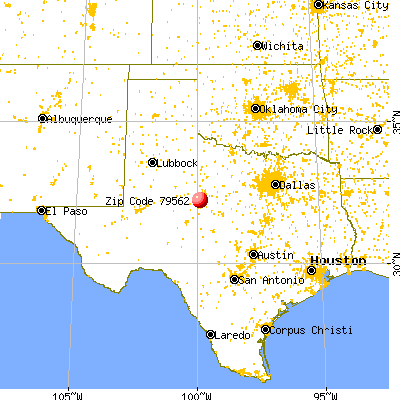


 Nearest zip codes: 79508, 79541, 79603, 79606, 79530, 79563.
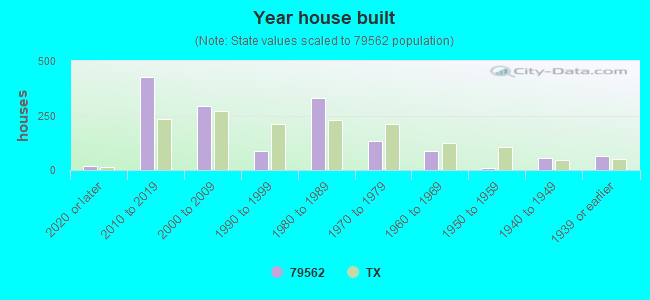


 : $281,940 in 15 contracts from 2000 to 2005