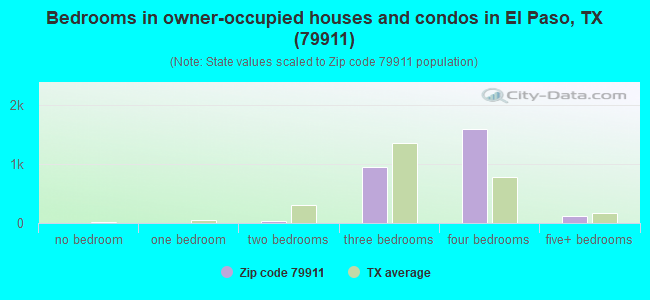
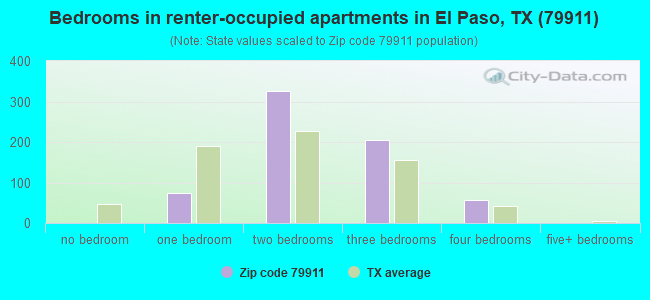
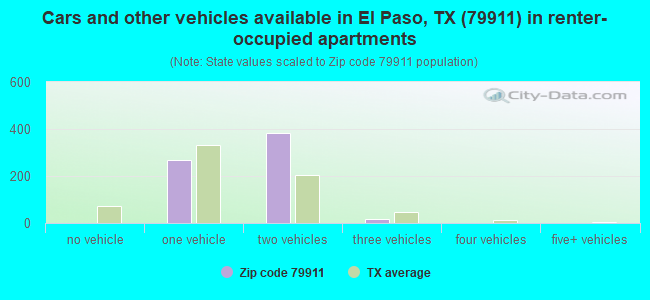
Houses and condos: 3,475 Renter-occupied apartments: 677
% of renters here:
20%
State:
38%
March 2022 cost of living index in zip code 79911: 81.1 (low, U.S. average is 100)
Land area: 6.2 sq. mi. Water area: 0.0 sq. mi.
Population density: 1,455 people per square mile
(low).
OSM Map
Google Map
MSN Map
OSM Map
General Map
Google Map
MSN Map
OSM Map
Google Map
MSN Map
OSM Map
Google Map
MSN Map
Please wait while loading the map...
Real estate property taxes paid for housing units in 2022:
This zip code:
2.4% ($7,753)
Texas:
1.5% ($4,050)
Median real estate property taxes paid for housing units with mortgages in 2022: $8,117 (2.5%) Median real estate property taxes paid for housing units with no mortgage in 2022: $6,878 (2.1%)
Business Search- 14 Million verified businesses
Males: 4,753
(52.3%)
Females: 4,328
(47.7%)
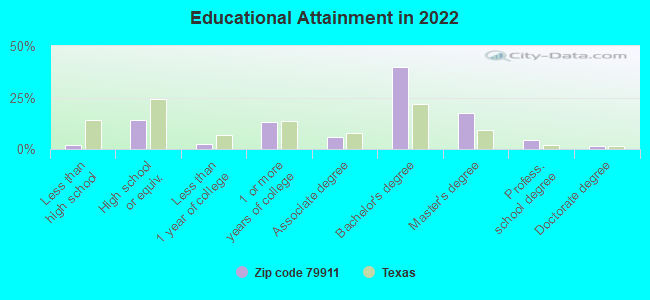
For population 25 years and over in 79911:
High school or higher: 100.2%
Bachelor's degree or higher: 64.4%
Graduate or professional degree: 23.6%
Unemployed: 3.0%
Mean travel time to work (commute): 25.9 minutes
For population 15 years and over in 79911:
Never married: 29.1%
Now married: 64.4%
Separated: 0.8%
Widowed: 0.3%
Divorced: 5.3%
Zip code 79911 compared to state average:
Median household income above state average.
Black race population percentage significantly below state average.
Renting percentage below state average.
Length of stay since moving in significantly below state average.
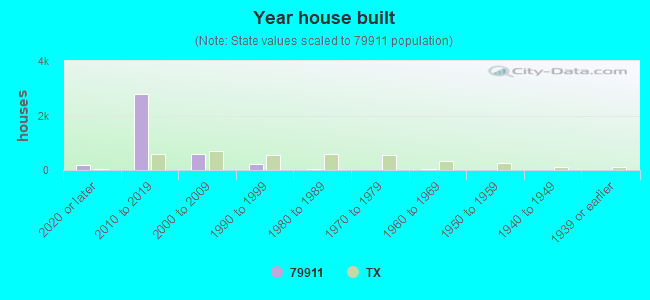
House age significantly below state average.
Percentage of population with a bachelor's degree or higher above state average.
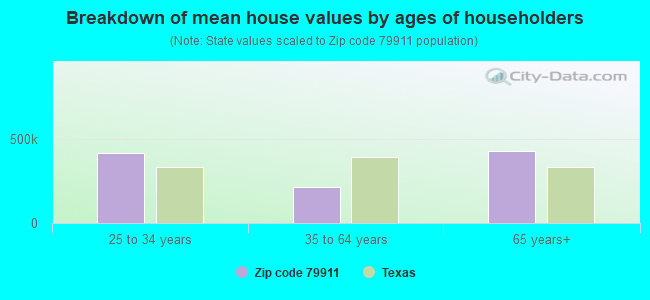
Estimated median house/condo value in 2022: $324,810
79911:
$324,810
Texas:
$275,400
According to our research of Texas and other state lists, there were 2 registered sex offenders living in 79911 zip code as of April 24, 2024. The ratio of all residents to sex offenders in zip code 79911 is 1,982 to 1. The ratio of registered sex offenders to all residents in this zip code is much lower than the state average.
Median resident age:
This zip code:
36.1 years
Texas median age:
35.6 years
Average household size:
This zip code:
2.7 people
Texas:
2.6 people
Averages for the 2020 tax year for zip code 79911, filed in 2021:
Average Adjusted Gross Income (AGI) in 2020: $89,852 (Individual Income Tax Returns)
Here:
$89,852
State:
$77,054
Salary/wage: $83,801 (reported on 87.2% of returns)
Here:
$83,801
State:
$62,766
(% of AGI for various income ranges: 1075.2% for AGIs below $25k, 3784.6% for AGIs $25k-50k, 6339.2% for AGIs $50k-75k, 9615.5% for AGIs $75k-100k, 17699.0% for AGIs $100k-200k, 53746.7% for AGIs over 200k)
Taxable interest for individuals: $1,041 (reported on 26.9% of returns)
This zip code:
$1,041
Texas:
$2,665
(% of AGI for various income ranges: 17.9% for AGIs below $25k, 27.9% for AGIs $25k-50k, 15.2% for AGIs $50k-75k, 25.0% for AGIs $75k-100k, 49.9% for AGIs $100k-200k, 260.8% for AGIs over 200k)
Ordinary dividends: $3,425 (reported on 16.2% of returns)
Here:
$3,425
State:
$10,044
(% of AGI for various income ranges: 15.5% for AGIs below $25k, 25.0% for AGIs $25k-50k, 60.8% for AGIs $50k-75k, 48.2% for AGIs $75k-100k, 61.0% for AGIs $100k-200k, 836.7% for AGIs over 200k)
Net capital gain/loss in AGI: +$8,815 (reported on 17.2% of returns)
Here:
+$8,815
State:
+$39,590
(% of AGI for various income ranges: 5.3% for AGIs below $25k, 27.9% for AGIs $25k-50k, 131.5% for AGIs $50k-75k, 127.6% for AGIs $75k-100k, 209.6% for AGIs $100k-200k, 2566.7% for AGIs over 200k)
Profit/loss from business: +$14,173 (reported on 18.2% of returns)
Here:
+$14,173
State:
+$10,888
(% of AGI for various income ranges: 189.2% for AGIs below $25k, 219.2% for AGIs $25k-50k, 160.8% for AGIs $50k-75k, 173.4% for AGIs $75k-100k, 317.3% for AGIs $100k-200k, 3345.0% for AGIs over 200k)
Taxable individual retirement arrangement distribution: $19,959 (reported on 4.4% of returns)
79911:
$19,959
Texas:
$24,740
(% of AGI for various income ranges: 87.3% for AGIs $25k-50k, 75.2% for AGIs $50k-75k, 145.5% for AGIs $75k-100k, 149.2% for AGIs $100k-200k, 809.2% for AGIs over 200k)
Total itemized deductions: $25,868 (reported on 11.3% of returns)
Here:
$25,868
State:
$40,428
(% of AGI for various income ranges: 278.8% for AGIs $25k-50k, 358.8% for AGIs $50k-75k, 489.7% for AGIs $75k-100k, 575.2% for AGIs $100k-200k, 1860.8% for AGIs over 200k)
Charity contributions: $8,027 (reported on 7.7% of returns)
Here:
$8,027
State:
$18,201
(% of AGI for various income ranges: 25.6% for AGIs $25k-50k, 38.3% for AGIs $50k-75k, 67.1% for AGIs $75k-100k, 139.2% for AGIs $100k-200k, 702.5% for AGIs over 200k)
Taxes paid: $8,295 (reported on 11.3% of returns)
79911:
$8,295
State:
$7,821
(% of AGI for various income ranges: 76.5% for AGIs $25k-50k, 126.9% for AGIs $50k-75k, 166.1% for AGIs $75k-100k, 189.7% for AGIs $100k-200k, 537.5% for AGIs over 200k)
Earned income credit: $2,242 (reported on 10.3% of returns)
Here:
$2,242
State:
$2,584
(% of AGI for various income ranges: 85.0% for AGIs below $25k, 70.0% for AGIs $25k-50k)
Percentage of individuals using paid preparers for their 2020 taxes: 92.6%
Here:
93%
State:
92%
(% for various income ranges: 91.6% for AGIs below $25k, 91.7% for AGIs $25k-50k, 92.2% for AGIs $50k-75k, 91.8% for AGIs $75k-100k, 93.5% for AGIs $100k-200k, 96.3% for AGIs over 200k)
Averages for the 2012 tax year for zip code 79911, filed in 2013:
Average Adjusted Gross Income (AGI) in 2012: $73,796 (Individual Income Tax Returns)
Here:
$73,796
State:
$65,384
Salary/wage: $72,816 (reported on 90.4% of returns)
Here:
$72,816
State:
$52,524
(% of AGI for various income ranges: 75.7% for AGIs below $25k, 86.5% for AGIs $25k-50k, 91.3% for AGIs $50k-75k, 92.9% for AGIs $75k-100k, 89.8% for AGIs $100k-200k, 85.1% for AGIs over 200k)
Taxable interest for individuals: $602 (reported on 29.5% of returns)
This zip code:
$602
Texas:
$2,372
(% of AGI for various income ranges: 0.2% for AGIs below $25k, 0.7% for AGIs $25k-50k, 0.1% for AGIs $50k-75k, 0.2% for AGIs $75k-100k, 0.2% for AGIs $100k-200k, 0.1% for AGIs over 200k)
Ordinary dividends: $1,714 (reported on 14.4% of returns)
Here:
$1,714
State:
$9,721
(% of AGI for various income ranges: 5.2% for AGIs below $25k, 0.6% for AGIs $25k-50k, 0.2% for AGIs $100k-200k)
Net capital gain/loss in AGI: +$438 (reported on 8.9% of returns)
Here:
+$438
State:
+$35,319
(% of AGI for various income ranges: 0.1% for AGIs $100k-200k)
Profit/loss from business: +$14,356 (reported on 17.1% of returns)
Here:
+$14,356
State:
+$13,732
(% of AGI for various income ranges: 12.1% for AGIs below $25k, 7.7% for AGIs $25k-50k, 1.3% for AGIs $50k-75k, 2.0% for AGIs $75k-100k, 4.0% for AGIs $100k-200k)
Taxable individual retirement arrangement distribution: $13,117 (reported on 4.1% of returns)
79911:
$13,117
Texas:
$19,511
(% of AGI for various income ranges: 2.9% for AGIs $25k-50k, 1.1% for AGIs $100k-200k)
Total itemized deductions: $20,122 (20% of AGI, reported on 49.3% of returns)
Here:
$20,122
State:
$24,724
Here:
19.9% of AGI
State:
15.9% of AGI
(% of AGI for various income ranges: 10.1% for AGIs below $25k, 12.8% for AGIs $25k-50k, 15.4% for AGIs $50k-75k, 15.7% for AGIs $75k-100k, 13.3% for AGIs $100k-200k, 9.6% for AGIs over 200k)
Charity contributions: $2,558 (reported on 32.9% of returns)
Here:
$2,558
State:
$6,808
(% of AGI for various income ranges: 1.3% for AGIs $25k-50k, 1.0% for AGIs $50k-75k, 1.1% for AGIs $75k-100k, 1.2% for AGIs $100k-200k, 1.3% for AGIs over 200k)
Taxes paid: $6,849 (reported on 49.3% of returns)
79911:
$6,849
State:
$6,921
(% of AGI for various income ranges: 3.3% for AGIs below $25k, 3.8% for AGIs $25k-50k, 4.8% for AGIs $50k-75k, 5.7% for AGIs $75k-100k, 4.7% for AGIs $100k-200k, 3.2% for AGIs over 200k)
Earned income credit: $2,056 (reported on 12.3% of returns)
Here:
$2,056
State:
$2,570
(% of AGI for various income ranges: 6.8% for AGIs below $25k, 1.1% for AGIs $25k-50k)
Percentage of individuals using paid preparers for their 2012 taxes: 52.1%
Here:
52%
State:
51%
(% for various income ranges: 50.0% for AGIs below $25k, 53.8% for AGIs $25k-50k, 48.0% for AGIs $50k-75k, 52.0% for AGIs $75k-100k, 54.5% for AGIs $100k-200k, 60.0% for AGIs over 200k)
Averages for the 2004 tax year for zip code 79911, filed in 2005:
Average Adjusted Gross Income (AGI) in 2004: $56,796 (Individual Income Tax Returns)
Here:
$56,796
State:
$47,881
Salary/wage: $56,204 (reported on 93.8% of returns)
Here:
$56,204
State:
$41,947
(% of AGI for various income ranges: 90.0% for AGIs below $10k, 76.3% for AGIs $10k-25k, 97.4% for AGIs $25k-50k, 97.3% for AGIs $50k-75k, 95.1% for AGIs $75k-100k, 82.5% for AGIs over 100k)
Taxable interest for individuals: $147 (reported on 42.0% of returns)
This zip code:
$147
Texas:
$2,255
(% of AGI for various income ranges: 0.3% for AGIs $25k-50k, 0.1% for AGIs $50k-75k, 0.1% for AGIs $75k-100k, 0.0% for AGIs over 100k)
Taxable dividends: $59 (reported on 10.5% of returns)
Here:
$59
State:
$4,261
Profit/loss from business: +$2,471 (reported on 10.5% of returns)
Here:
+$2,471
State:
+$11,013
Total itemized deductions: $17,350 (22% of AGI, reported on 37.0% of returns)
Here:
$17,350
State:
$19,631
Here:
22.3% of AGI
State:
18.9% of AGI
(% of AGI for various income ranges: 48.1% for AGIs $10k-25k, 13.4% for AGIs $50k-75k, 20.8% for AGIs $75k-100k)
Charity contributions deductions: $2,208 (3% of AGI, reported on 29.6% of returns)
Here:
$2,208
State:
$4,753
Here:
2.8% of AGI
State:
4.2% of AGI
Total tax: $6,621 (reported on 81.5% of returns)
79911:
$6,621
State:
$9,058
(% of AGI for various income ranges: 13.8% for AGIs below $10k, 6.0% for AGIs $25k-50k, 8.0% for AGIs $50k-75k, 10.4% for AGIs $75k-100k, 14.3% for AGIs over 100k)
Earned income credit: $2,400 (reported on 6.2% of returns)
Here:
$2,400
State:
$2,024
Percentage of individuals using paid preparers for their 2004 taxes: 59.9%
Here:
60%
State:
57%
(% for various income ranges: 105.6% for AGIs $10k-25k, 59.5% for AGIs $25k-50k, 55.1% for AGIs $50k-75k, 107.4% for AGIs $75k-100k)
Household received Food Stamps/SNAP in the past 12 months: 34 Household did not receive Food Stamps/SNAP in the past 12 months: 3,303
Women who had a birth in the past 12 months: 233 (220 now married, 16 unmarried) Women who did not have a birth in the past 12 months: 2,348 (1,292 now married, 1,047 unmarried)
Housing units in zip code 79911 with a mortgage: 2,212 (19 second mortgage) Median monthly owner costs for units with a mortgage: $2,081 Median monthly owner costs for units without a mortgage: $887
Residents with income below the poverty level in 2022:
This zip code:
4.4%
Whole state:
14.0%
Residents with income below 50% of the poverty level in 2022:
This zip code:
1.9%
Whole state:
7.4%
Median number of rooms in houses and condos:
Here:
6.3
State:
6.3
Median number of rooms in apartments:
Here:
4.2
State:
4.0
Notable locations in this zip code not listed on our city pages
In group quarters: 16 (-1 institutionalized population)
Size of family households: 1,105 2-persons, 643 3-persons, 552 4-persons, 351 5-persons, 41 6-persons, 12 7-or-more-persons
Size of nonfamily households: 610 1-person, 16 2-persons
2,092 married couples with children.
337 single-parent households (237 men, 100 women).
42.9% of residents of 79911 zip code speak English at home.
53.6% of residents speak Spanish at home (79% very well, 16% well, 4% not well).
1.2% of residents speak other Indo-European language at home (100% very well).
1.5% of residents speak Asian or Pacific Island language at home (22% very well, 55% well, 22% not well).
0.4% of residents speak other language at home (100% very well).
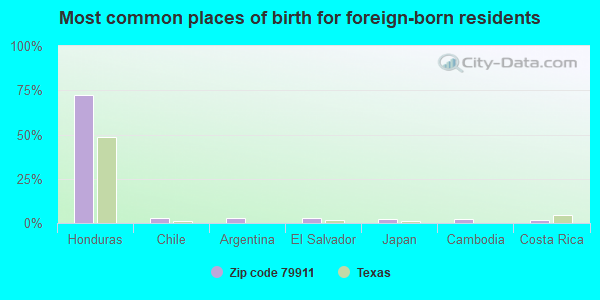
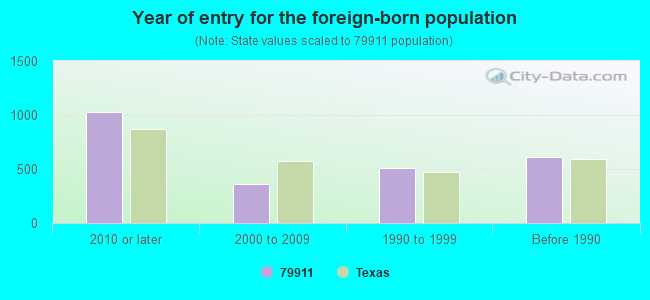
Foreign born population: 2,257 (24.9%) (54.8% of them are naturalized citizens)
79% of the 79911 zip code residents lived in the same house 1 year ago. Out of people who lived in different houses, 31% moved from this county. Out of people who lived in different houses, 40% moved from different county within same state. Out of people who lived in different houses, 24% moved from different state. Out of people who lived in different houses, 8% moved from abroad.
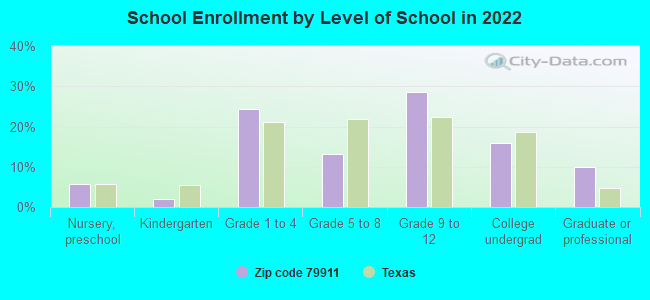
Private vs. public school enrollment:
Students in private schools in grades 1 to 8 (elementary and middle school): 189
Here:
17.4%
Texas:
8.8%
Students in private schools in grades 9 to 12 (high school): 23
Here:
2.9%
Texas:
8.0%
Students in private undergraduate colleges: 75
Here:
16.4%
Texas:
16.2%
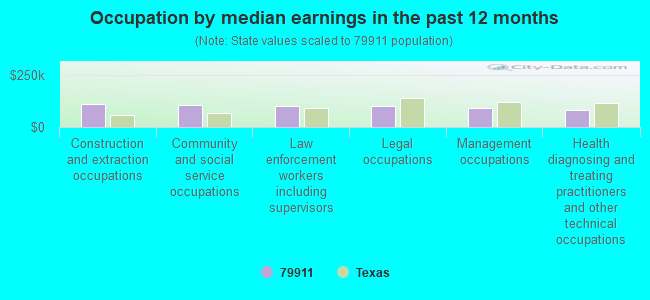
Occupation by median earnings in the past 12 months ($)
111,267Construction and extraction occupations
108,483Community and social service occupations
102,219Law enforcement workers including supervisors
102,185Legal occupations
94,189Management occupations
83,817Health diagnosing and treating practitioners and other technical occupations
Top industries in this zip code by the number of employees in 2005:
Administrative and Support and Waste Management and Remediation Services: Carpet and Upholstery Cleaning Services (1-4 employees: 1 establishment)
Fatal accident statistics in 2014:
Fatal accident count: 1
Vehicles involved in fatal accidents: 2
Fatal accidents caused by drunken drivers: 1
Fatalities: 1
Persons involved in fatal accidents: 5
Pedestrians involved in fatal accidents: 0
Discuss El Paso, Texas (TX) on our hugely popular Texas forum.