Estimated zip code population in 2022: 35,608 Zip code population in 2010: 33,667 Zip code population in 2000: 32,226
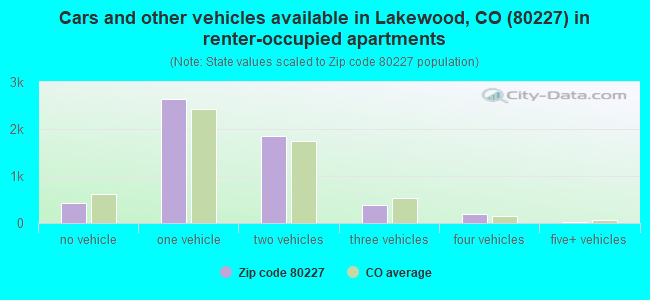
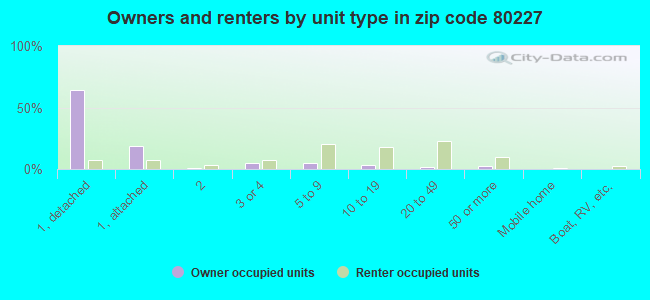
Houses and condos: 16,974 Renter-occupied apartments: 5,504
% of renters here:
34%
State:
34%
March 2022 cost of living index in zip code 80227: 110.0 (more than average, U.S. average is 100)
Land area: 7.4 sq. mi. Water area: 0.1 sq. mi.
Population density: 4,812 people per square mile
(average).
OSM Map
General Map
Google Map
MSN Map
OSM Map
General Map
Google Map
MSN Map
OSM Map
General Map
Google Map
MSN Map
OSM Map
General Map
Google Map
MSN Map
Please wait while loading the map...
Real estate property taxes paid for housing units in 2022:
This zip code:
0.4% ($2,428)
Colorado:
0.5% ($2,422)
Median real estate property taxes paid for housing units with mortgages in 2022: $2,414 (0.4%) Median real estate property taxes paid for housing units with no mortgage in 2022: $2,476 (0.5%)
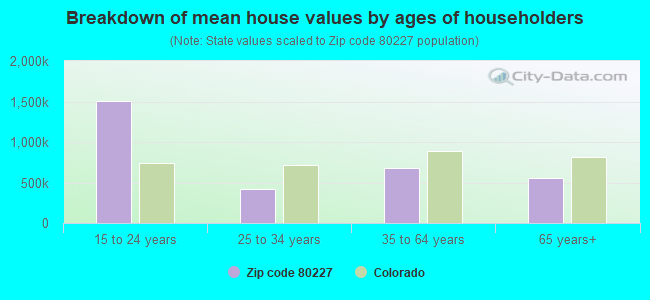
Estimated median house/condo value in 2022: $547,173
80227:
$547,173
Colorado:
$531,100
According to our research of Colorado and other state lists, there were 66 registered sex offenders living in 80227 zip code as of April 18, 2024. The ratio of all residents to sex offenders in zip code 80227 is 538 to 1. The ratio of registered sex offenders to all residents in this zip code is near the state average.
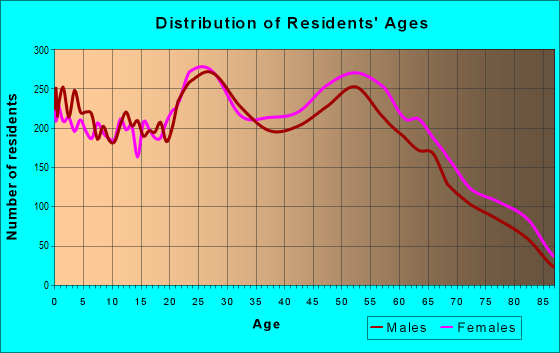
Median resident age:
This zip code:
40.6 years
Colorado median age:
37.7 years
Average household size:
This zip code:
2.2 people
Colorado:
2.4 people
Averages for the 2020 tax year for zip code 80227, filed in 2021:
Average Adjusted Gross Income (AGI) in 2020: $78,491 (Individual Income Tax Returns)
Here:
$78,491
State:
$89,260
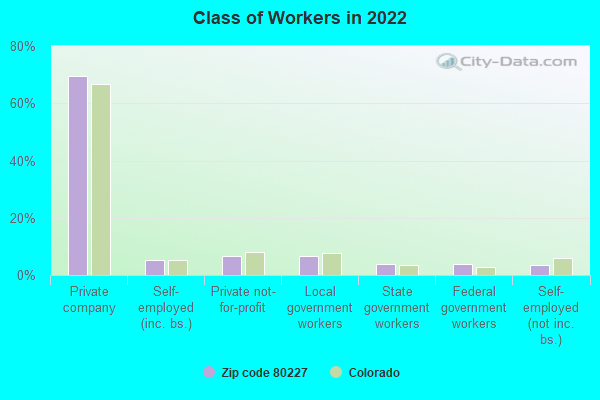
Salary/wage: $64,196 (reported on 80.7% of returns)
Here:
$64,196
State:
$70,330
(% of AGI for various income ranges: 1184.0% for AGIs below $25k, 3736.6% for AGIs $25k-50k, 6644.5% for AGIs $50k-75k, 9458.9% for AGIs $75k-100k, 17506.5% for AGIs $100k-200k, 79529.4% for AGIs over 200k)
Taxable interest for individuals: $1,648 (reported on 31.4% of returns)
This zip code:
$1,648
Colorado:
$2,176
(% of AGI for various income ranges: 20.4% for AGIs below $25k, 20.5% for AGIs $25k-50k, 34.6% for AGIs $50k-75k, 70.5% for AGIs $75k-100k, 190.0% for AGIs $100k-200k, 1172.6% for AGIs over 200k)
Ordinary dividends: $8,237 (reported on 23.1% of returns)
Here:
$8,237
State:
$8,820
(% of AGI for various income ranges: 33.5% for AGIs below $25k, 36.1% for AGIs $25k-50k, 105.4% for AGIs $50k-75k, 201.2% for AGIs $75k-100k, 479.1% for AGIs $100k-200k, 6790.6% for AGIs over 200k)
Net capital gain/loss in AGI: +$23,517 (reported on 21.3% of returns)
Here:
+$23,517
State:
+$37,276
(% of AGI for various income ranges: 11.3% for AGIs below $25k, 35.5% for AGIs $25k-50k, 108.0% for AGIs $50k-75k, 199.3% for AGIs $75k-100k, 836.3% for AGIs $100k-200k, 24378.7% for AGIs over 200k)
Profit/loss from business: +$13,915 (reported on 16.6% of returns)
Here:
+$13,915
State:
+$15,295
(% of AGI for various income ranges: 165.5% for AGIs below $25k, 201.6% for AGIs $25k-50k, 238.9% for AGIs $50k-75k, 316.7% for AGIs $75k-100k, 642.9% for AGIs $100k-200k, 3445.5% for AGIs over 200k)
Taxable individual retirement arrangement distribution: $26,018 (reported on 10.0% of returns)
80227:
$26,018
Colorado:
$23,785
(% of AGI for various income ranges: 66.7% for AGIs below $25k, 89.3% for AGIs $25k-50k, 217.1% for AGIs $50k-75k, 454.2% for AGIs $75k-100k, 1046.2% for AGIs $100k-200k, 5195.8% for AGIs over 200k)
Self-employed (Keogh) retirement plans: $16,967 (reported on 0.5% of returns)
80227:
$16,967
Colorado:
$23,633
(% of AGI for various income ranges: 42.6% for AGIs $100k-200k, 271.3% for AGIs over 200k)
Total itemized deductions: $31,331 (reported on 11.3% of returns)
Here:
$31,331
State:
$35,141
(% of AGI for various income ranges: 74.8% for AGIs below $25k, 123.8% for AGIs $25k-50k, 321.1% for AGIs $50k-75k, 645.5% for AGIs $75k-100k, 1289.8% for AGIs $100k-200k, 7613.9% for AGIs over 200k)
Charity contributions: $8,622 (reported on 8.8% of returns)
Here:
$8,622
State:
$12,103
(% of AGI for various income ranges: 5.1% for AGIs below $25k, 10.0% for AGIs $25k-50k, 35.4% for AGIs $50k-75k, 74.7% for AGIs $75k-100k, 241.7% for AGIs $100k-200k, 2652.9% for AGIs over 200k)
Taxes paid: $6,997 (reported on 11.2% of returns)
80227:
$6,997
State:
$7,710
(% of AGI for various income ranges: 9.1% for AGIs below $25k, 17.8% for AGIs $25k-50k, 72.7% for AGIs $50k-75k, 168.8% for AGIs $75k-100k, 361.5% for AGIs $100k-200k, 1389.7% for AGIs over 200k)
Earned income credit: $1,915 (reported on 9.9% of returns)
Here:
$1,915
State:
$2,053
(% of AGI for various income ranges: 66.1% for AGIs below $25k, 37.2% for AGIs $25k-50k)
Percentage of individuals using paid preparers for their 2020 taxes: 92.3%
Here:
92%
State:
93%
(% for various income ranges: 89.6% for AGIs below $25k, 93.5% for AGIs $25k-50k, 92.7% for AGIs $50k-75k, 94.1% for AGIs $75k-100k, 92.7% for AGIs $100k-200k, 92.9% for AGIs over 200k)
Averages for the 2012 tax year for zip code 80227, filed in 2013:
Average Adjusted Gross Income (AGI) in 2012: $66,917 (Individual Income Tax Returns)
Here:
$66,917
State:
$69,103
Salary/wage: $51,339 (reported on 81.8% of returns)
Here:
$51,339
State:
$54,794
(% of AGI for various income ranges: 73.0% for AGIs below $25k, 80.1% for AGIs $25k-50k, 72.6% for AGIs $50k-75k, 69.9% for AGIs $75k-100k, 70.6% for AGIs $100k-200k, 37.7% for AGIs over 200k)
Taxable interest for individuals: $2,076 (reported on 35.3% of returns)
This zip code:
$2,076
Colorado:
$1,971
(% of AGI for various income ranges: 1.1% for AGIs below $25k, 0.6% for AGIs $25k-50k, 0.7% for AGIs $50k-75k, 0.8% for AGIs $75k-100k, 1.0% for AGIs $100k-200k, 1.8% for AGIs over 200k)
Ordinary dividends: $11,243 (reported on 22.3% of returns)
Here:
$11,243
State:
$7,140
(% of AGI for various income ranges: 1.8% for AGIs below $25k, 1.0% for AGIs $25k-50k, 1.4% for AGIs $50k-75k, 1.6% for AGIs $75k-100k, 1.9% for AGIs $100k-200k, 9.1% for AGIs over 200k)
Net capital gain/loss in AGI: +$12,539 (reported on 18.5% of returns)
Here:
+$12,539
State:
+$23,009
(% of AGI for various income ranges: 0.2% for AGIs $25k-50k, 0.5% for AGIs $50k-75k, 0.8% for AGIs $75k-100k, 1.5% for AGIs $100k-200k, 10.1% for AGIs over 200k)
Profit/loss from business: +$12,932 (reported on 15.6% of returns)
Here:
+$12,932
State:
+$13,514
(% of AGI for various income ranges: 9.0% for AGIs below $25k, 3.2% for AGIs $25k-50k, 2.9% for AGIs $50k-75k, 3.1% for AGIs $75k-100k, 3.0% for AGIs $100k-200k, 1.7% for AGIs over 200k)
Taxable individual retirement arrangement distribution: $16,415 (reported on 12.5% of returns)
80227:
$16,415
Colorado:
$17,927
(% of AGI for various income ranges: 4.1% for AGIs below $25k, 2.8% for AGIs $25k-50k, 3.6% for AGIs $50k-75k, 3.3% for AGIs $75k-100k, 3.4% for AGIs $100k-200k, 2.3% for AGIs over 200k)
Self-employment retirement plans: $16,650 (reported on 0.6% of returns)
80227:
$16,650
Colorado:
$19,483
(% of AGI for various income ranges: 0.2% for AGIs $50k-75k, 0.2% for AGIs $100k-200k, 0.3% for AGIs over 200k)
Total itemized deductions: $21,902 (18% of AGI, reported on 35.4% of returns)
Here:
$21,902
State:
$24,621
Here:
17.6% of AGI
State:
18.5% of AGI
(% of AGI for various income ranges: 11.6% for AGIs below $25k, 9.9% for AGIs $25k-50k, 12.3% for AGIs $50k-75k, 13.7% for AGIs $75k-100k, 13.9% for AGIs $100k-200k, 9.3% for AGIs over 200k)
Charity contributions: $3,736 (reported on 30.2% of returns)
Here:
$3,736
State:
$4,449
(% of AGI for various income ranges: 0.8% for AGIs below $25k, 1.1% for AGIs $25k-50k, 1.5% for AGIs $50k-75k, 1.8% for AGIs $75k-100k, 2.1% for AGIs $100k-200k, 1.8% for AGIs over 200k)
Taxes paid: $6,732 (reported on 35.2% of returns)
80227:
$6,732
State:
$7,641
(% of AGI for various income ranges: 1.5% for AGIs below $25k, 1.9% for AGIs $25k-50k, 2.8% for AGIs $50k-75k, 3.6% for AGIs $75k-100k, 4.7% for AGIs $100k-200k, 4.2% for AGIs over 200k)
Earned income credit: $1,991 (reported on 13.3% of returns)
Here:
$1,991
State:
$2,095
(% of AGI for various income ranges: 4.5% for AGIs below $25k, 0.8% for AGIs $25k-50k)
Percentage of individuals using paid preparers for their 2012 taxes: 48.8%
Here:
49%
State:
49%
(% for various income ranges: 44.6% for AGIs below $25k, 46.6% for AGIs $25k-50k, 51.5% for AGIs $50k-75k, 52.0% for AGIs $75k-100k, 52.9% for AGIs $100k-200k, 73.7% for AGIs over 200k)
Averages for the 2004 tax year for zip code 80227, filed in 2005:
Average Adjusted Gross Income (AGI) in 2004: $53,233 (Individual Income Tax Returns)
Here:
$53,233
State:
$55,014
Salary/wage: $44,962 (reported on 83.4% of returns)
Here:
$44,962
State:
$46,010
(% of AGI for various income ranges: 217.7% for AGIs below $10k, 75.4% for AGIs $10k-25k, 81.8% for AGIs $25k-50k, 76.0% for AGIs $50k-75k, 76.8% for AGIs $75k-100k, 57.4% for AGIs over 100k)
Taxable interest for individuals: $1,826 (reported on 49.7% of returns)
This zip code:
$1,826
Colorado:
$2,127
(% of AGI for various income ranges: 13.2% for AGIs below $10k, 2.4% for AGIs $10k-25k, 1.4% for AGIs $25k-50k, 1.4% for AGIs $50k-75k, 1.6% for AGIs $75k-100k, 1.8% for AGIs over 100k)
Taxable dividends: $4,014 (reported on 28.3% of returns)
Here:
$4,014
State:
$3,782
(% of AGI for various income ranges: 10.4% for AGIs below $10k, 1.8% for AGIs $10k-25k, 1.1% for AGIs $25k-50k, 1.1% for AGIs $50k-75k, 1.3% for AGIs $75k-100k, 3.3% for AGIs over 100k)
Net capital gain/loss: +$13,683 (reported on 23.9% of returns)
Here:
+$13,683
State:
+$17,882
(% of AGI for various income ranges: -0.2% for AGIs below $10k, 0.2% for AGIs $10k-25k, 0.4% for AGIs $25k-50k, 0.9% for AGIs $50k-75k, 1.3% for AGIs $75k-100k, 14.0% for AGIs over 100k)
Profit/loss from business: +$11,605 (reported on 16.3% of returns)
Here:
+$11,605
State:
+$11,247
(% of AGI for various income ranges: 15.9% for AGIs below $10k, 6.9% for AGIs $10k-25k, 3.0% for AGIs $25k-50k, 2.5% for AGIs $50k-75k, 3.0% for AGIs $75k-100k, 3.8% for AGIs over 100k)
IRA payment deduction: $3,013 (reported on 3.4% of returns)
80227:
$3,013
Colorado:
$2,947
(% of AGI for various income ranges: 0.7% for AGIs below $10k, 0.3% for AGIs $10k-25k, 0.3% for AGIs $25k-50k, 0.2% for AGIs $50k-75k, 0.2% for AGIs $75k-100k, 0.1% for AGIs over 100k)
Self-employed pension: $13,250 (reported on 1.1% of returns)
Here:
$13,250
Colorado:
$13,653
(% of AGI for various income ranges: 0.1% for AGIs $25k-50k, 0.1% for AGIs $50k-75k, 0.2% for AGIs $75k-100k, 0.5% for AGIs over 100k)
Total itemized deductions: $18,724 (22% of AGI, reported on 43.8% of returns)
Here:
$18,724
State:
$20,560
Here:
21.8% of AGI
State:
21.4% of AGI
(% of AGI for various income ranges: 40.5% for AGIs below $10k, 12.9% for AGIs $10k-25k, 14.9% for AGIs $25k-50k, 17.4% for AGIs $50k-75k, 17.6% for AGIs $75k-100k, 14.0% for AGIs over 100k)
Charity contributions deductions: $3,012 (3% of AGI, reported on 39.0% of returns)
Here:
$3,012
State:
$3,518
Here:
3.3% of AGI
State:
3.4% of AGI
(% of AGI for various income ranges: 2.2% for AGIs below $10k, 1.2% for AGIs $10k-25k, 1.6% for AGIs $25k-50k, 2.1% for AGIs $50k-75k, 2.5% for AGIs $75k-100k, 2.6% for AGIs over 100k)
Total tax: $8,294 (reported on 80.9% of returns)
80227:
$8,294
State:
$9,173
(% of AGI for various income ranges: 6.4% for AGIs below $10k, 4.7% for AGIs $10k-25k, 7.8% for AGIs $25k-50k, 9.9% for AGIs $50k-75k, 10.9% for AGIs $75k-100k, 18.0% for AGIs over 100k)
Earned income credit: $1,547 (reported on 9.8% of returns)
Here:
$1,547
State:
$1,595
Percentage of individuals using paid preparers for their 2004 taxes: 52.9%
Here:
53%
State:
55%
(% for various income ranges: 47.2% for AGIs below $10k, 52.6% for AGIs $10k-25k, 51.8% for AGIs $25k-50k, 53.2% for AGIs $50k-75k, 53.9% for AGIs $75k-100k, 63.3% for AGIs over 100k)
Likely homosexual households (counted as self-reported same-sex unmarried-partner households)
Lesbian couples: 0.0% of all households
Gay men: 0.0% of all households
Household received Food Stamps/SNAP in the past 12 months: 645 Household did not receive Food Stamps/SNAP in the past 12 months: 15,498
Women who had a birth in the past 12 months: 483 (371 now married, 109 unmarried) Women who did not have a birth in the past 12 months: 7,907 (3,241 now married, 4,674 unmarried)
Housing units in zip code 80227 with a mortgage: 6,803 (759 second mortgage, 14 home equity loan, 568 both second mortgage and home equity loan) Houses without a mortgage: 126
Median monthly owner costs for units with a mortgage: $2,049 Median monthly owner costs for units without a mortgage: $645
Residents with income below the poverty level in 2022:
This zip code:
6.5%
Whole state:
9.4%
Residents with income below 50% of the poverty level in 2022:
This zip code:
2.2%
Whole state:
4.6%
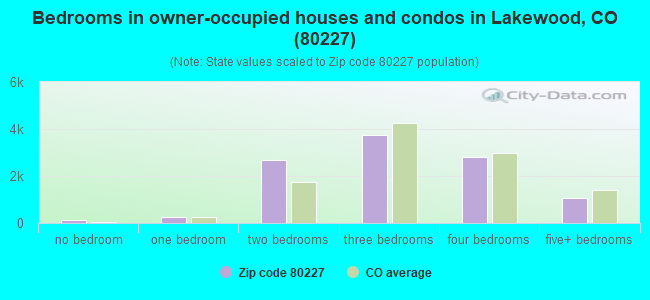
Median number of rooms in houses and condos:
Here:
6.5
State:
6.8
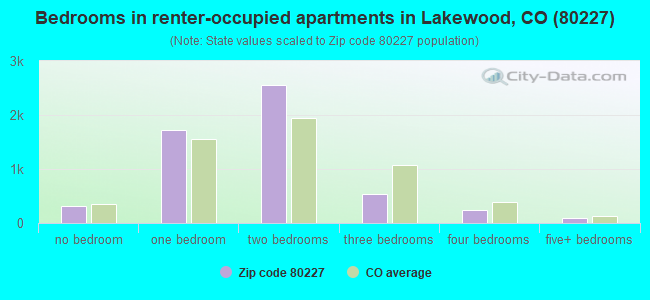
Median number of rooms in apartments:
Here:
3.9
State:
4.0
Notable locations in this zip code not listed on our city pages
Churches in zip code 80227 include: Saint Joseph's Episcopal Church (A), River of Life Church (B), Rocky Mountain Islamic Center (C), Zion Evangelical Lutheran Church (D), Hope Crossing Church (E), Southwest First Assembly of God (F), Atonement Lutheran Church (G), Landmark Tabernacle (H), Bear Valley Church of God of Prophecy (I). Display/hide their locations on the map
Parks in zip code 80227 include: Hutchinson Park (1), Jefferson Green Park (2), Westgate Park (3), Bear Valley Park (4), Bear Creek Greenbelt (5), Carmody Park (6), Lakewood Sister City Park (7), Avoca Lodge / Molly Brown Summer Home (8), Schnell Farm (9). Display/hide their locations on the map
Tourist attraction (not listed on the city page) : Molly Brown Summer House (Cultural Attractions- Events- & Facilities; 2690 South Wadsworth Boulevard).
3,431 married couples with children.
1,375 single-parent households (271 men, 1,104 women).
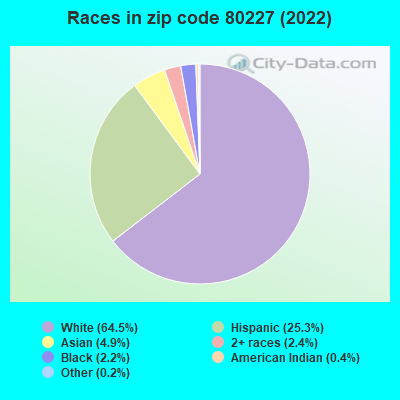
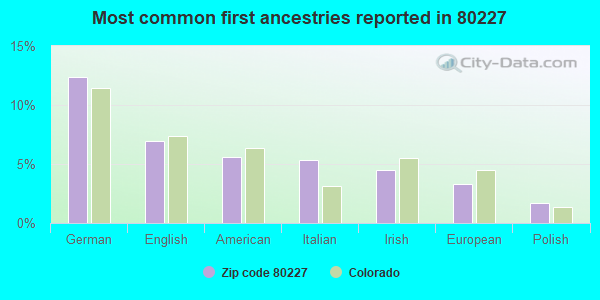
85.8% of residents of 80227 zip code speak English at home.
8.6% of residents speak Spanish at home (73% very well, 11% well, 15% not well, 1% not at all).
2.3% of residents speak other Indo-European language at home (90% very well, 4% well, 6% not well).
3.2% of residents speak Asian or Pacific Island language at home (43% very well, 30% well, 26% not well, 1% not at all).
0.3% of residents speak other language at home (100% very well).
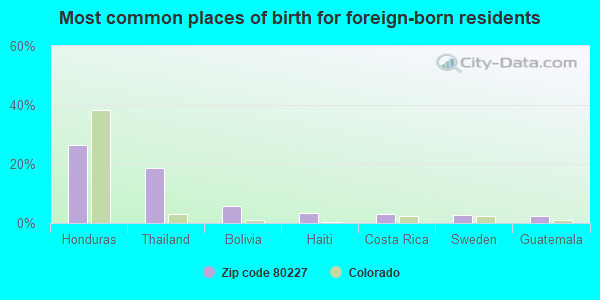
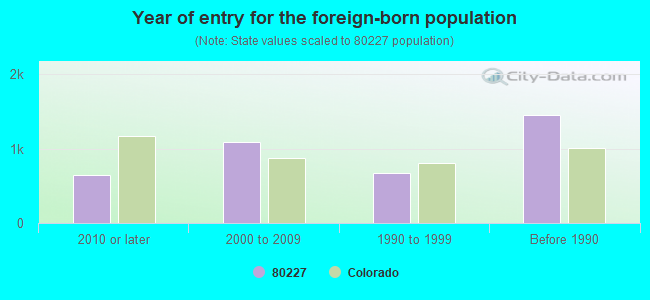
Foreign born population: 3,479 (9.8%) (54.8% of them are naturalized citizens)
Major facilities with environmental interests located in this zip code:
BEAR CREEK HIGH SCHOOL (3490 SOUTH KIPLING in LAKEWOOD, CO)
(Geographic Names Information System) COMPLIANCE ACTIVITY (Tracking inspections of insecticide, fungicide, and rodenticide, and toxic substances) (National Center for Education Statistics) - STATE ID-0664 Organizations: JEFFERSON COUNTY R-1 (SCHOOL DISTRICT)
BEAR CREEK ELEMENTARY SCHOOL (3125 S. KIPLING STREET in LAKEWOOD, CO)
(Geographic Names Information System) (National Center for Education Statistics) - STATE ID-0660 Organizations: JEFFERSON COUNTY R-1 (SCHOOL DISTRICT)
CARMODY MIDDLE SCHOOL (2050 S. KIPLING STREET in LAKEWOOD, CO)
(Geographic Names Information System) (National Center for Education Statistics) - STATE ID-1318 Organizations: JEFFERSON COUNTY R-1 (SCHOOL DISTRICT)
GREEN GABLES ELEMENTARY SCHOOL (8701 WEST WOODARD DRIVE in LAKEWOOD, CO)
(Geographic Names Information System) (National Center for Education Statistics) - STATE ID-3622 Organizations: JEFFERSON COUNTY R-1 (SCHOOL DISTRICT)
CENTER FOR DISCOVERY LEARNING CHARTER SCHOOL (7700 WEST WOODARD DRIVE in LAKEWOOD, CO)
(National Center for Education Statistics) - STATE ID-1867 Organizations: JEFFERSON COUNTY R-1 (SCHOOL DISTRICT)
HENRY MIDDLE SCHOOL (3005 SOUTH GOLDEN WAY in DENVER, CO)
(National Center for Education Statistics) - STATE ID-8054 Organizations: DENVER COUNTY 1 (SCHOOL DISTRICT)
BUBBLES CLEANER (2131 SOUTH SHERIDAN BOULEVARD UNIT B in DENVER, CO)
AIR MINOR (AIRS/AFS) CRITERIA AND HAZARDOUS AIR POLLUTANT INVENTORY (Inventory of air pollution sources) Conditionally Exempt Small Quantity Generators, less than 100 kg/month of hazardous waste (Resource Conservation and Recovery Act (tracking hazardous waste)) - notification Business SIC classification: DRYCLEANING PLANTS, EXCEPT RUG CLEANING Business NAICS classification: DRYCLEANING AND LAUNDRY SERVICES (EXCEPT COIN-OPERATED). Organizations: KWANG YOI YI (CONTACT/OWNER)
AMOCO OIL 2332 (3457 SOUTH WADSWORTH in LAKEWOOD, CO)
(Resource Conservation and Recovery Act (tracking hazardous waste)) Organizations: WESTERN STANDARD SERVICE (CONTACT/OWNER)
BEAR VALLEY CONOCO (3097 SOUTH SHERIDAN BOULEVARD in DENVER, CO)
AIR MINOR (AIRS/AFS) CRITERIA AND HAZARDOUS AIR POLLUTANT INVENTORY (Inventory of air pollution sources) Business SIC classification: GASOLINE SERVICE STATIONS
JEFFCO - BEAR CREEK BUS TERMINAL (3401 S. KIPLING STREET in LAKEWOOD, CO)
(Resource Conservation and Recovery Act (tracking hazardous waste)) Organizations: JEFF CO. PUBLIC SCHOOLS (CONTACT/OWNER)
11777 W HAMPDEN (11777 W HAMPDEN in DENVER, CO)
(Resource Conservation and Recovery Act (tracking hazardous waste))
CASS AND COMPANY (9187 WEST JEWELL PLACE in LAKEWOOD, CO)
ENFORCEMENT/COMPLIANCE ACTIVITY (Integrated Compliance Information System) COMPLIANCE ACTIVITY (Tracking inspections of insecticide, fungicide, and rodenticide, and toxic substances) Business SIC classification: REAL ESTATE AGENTS AND MANAGERS
HUGH M WOODS NUMBER 147 (2085 SOUTH SHERIDAN BOULEVARD in DENVER, CO)
Conditionally Exempt Small Quantity Generators, less than 100 kg/month of hazardous waste (Resource Conservation and Recovery Act (tracking hazardous waste)) - notification Organizations: PAYLESS CASHWAYS INC (CONTACT/OWNER)
Housing units lacking complete plumbing facilities: 0.8% Housing units lacking complete kitchen facilities: 1.4%
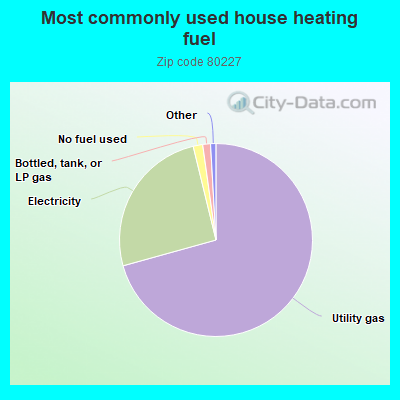
70.7%Utility gas
25.5%Electricity
1.6%No fuel used
1.3%Bottled, tank, or LP gas
Population in 1990: 26,932. Population change in the 1990s: +5,294 (+19.7%).
Place of birth for U.S.-born residents:
This state: 17,021
Northeast: 2,055
Midwest: 5,582
South: 2,645
West: 4,343
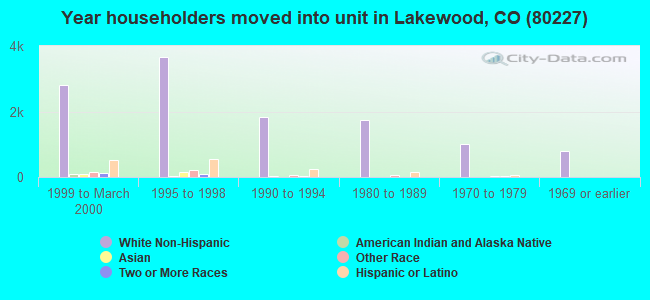
47% of the 80227 zip code residents lived in the same house 5 years ago. Out of people who lived in different houses, 43% lived in this county. Out of people who lived in different counties, 50% lived in Colorado.
86% of the 80227 zip code residents lived in the same house 1 year ago. Out of people who lived in different houses, 38% moved from this county. Out of people who lived in different houses, 39% moved from different county within same state. Out of people who lived in different houses, 15% moved from different state. Out of people who lived in different houses, 9% moved from abroad.
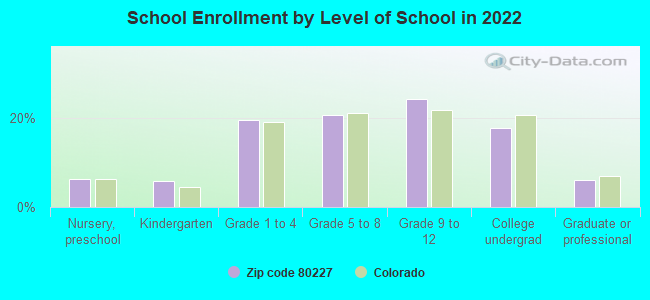
Private vs. public school enrollment:
Students in private schools in grades 1 to 8 (elementary and middle school): 187
Here:
7.0%
Colorado:
11.4%
Students in private schools in grades 9 to 12 (high school): 94
Here:
5.9%
Colorado:
8.5%
Students in private undergraduate colleges: 262
Here:
22.1%
Colorado:
14.0%
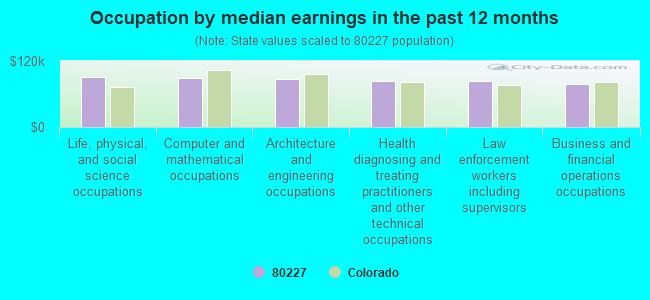
Occupation by median earnings in the past 12 months ($)
91,762Life, physical, and social science occupations
88,409Computer and mathematical occupations
86,442Architecture and engineering occupations
84,168Health diagnosing and treating practitioners and other technical occupations
82,915Law enforcement workers including supervisors
79,084Business and financial operations occupations
Companies with federal contracts located in this zip code:
STRATEGIC TRANSPORT SYSTEMS, I (3110 S. WADSWORTH BLVD#207 in LAKEWOOD, CO; small business)
$440,700 with Navy for Lease or Rental of Equipment -- Guided Missiles. Taking place in UT. Signed on 2000-05-01. Completion date: 2000-09-30.
VAN COURT & COMPANY, INC (5353 WEST DARTMOUTH AVE 5 in DENVER, CO; small business) : $16,375 in 2 contractsfrom 2001 to 2002
$11,500 with Army for Real Property Appraisals Services (SIC 6531). Signed on 2002-07-26. Completion date: 2002-09-15.
$4,875, same as above.Signed on 2001-03-06. Completion date: 2001-05-31.
Top industries in this zip code by the number of employees in 2005:
2002 - 2018 National Fire Incident Reporting System (NFIRS) incidents
Based on the data from the years 2002 - 2018 the average number of fire incidents per year is 55. The highest number of fire incidents - 80 took place in 2002, and the least - 35 in 2011. The data has a declining trend.
When looking into fire subcategories, the most reports belonged to: Outside Fires (40.2%), and Structure Fires (38.2%).
Fire incident types reported to NFIRS in Zip Code 80227


 Nearest zip codes: 80235, 80232, 80226, 80236, 80123, 80219.
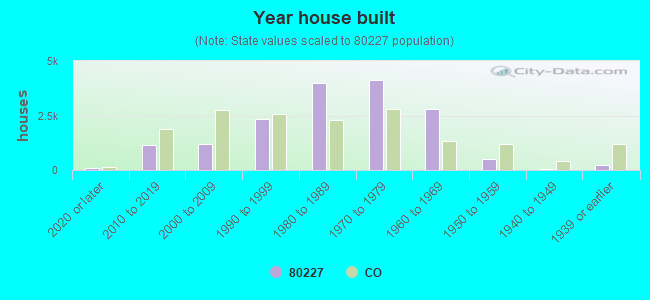


 Based on the data from the years 2002 - 2018 the average number of fire incidents per year is 55. The highest number of fire incidents - 80 took place in 2002, and the least - 35 in 2011. The data has a declining trend.
 When looking into fire subcategories, the most reports belonged to: Outside Fires (40.2%), and Structure Fires (38.2%).