Estimated zip code population in 2022: 10,531 Zip code population in 2010: 9,313 Zip code population in 2000: 9,147
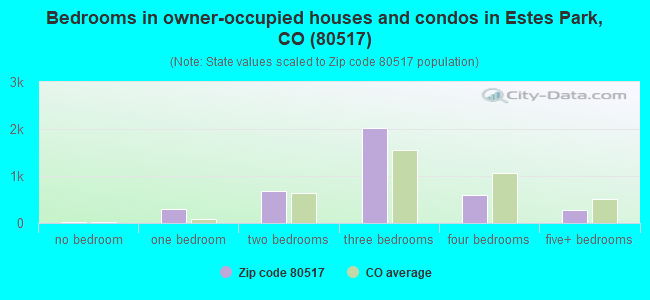
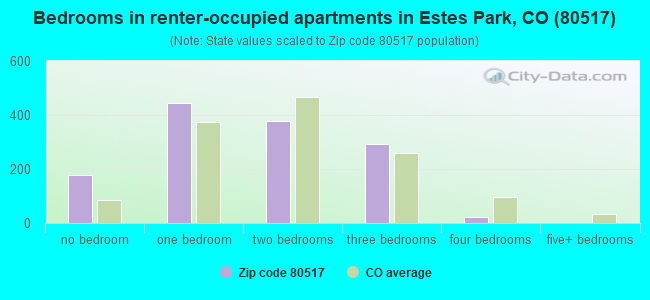
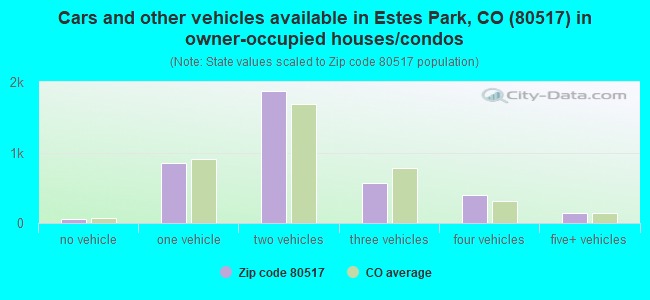
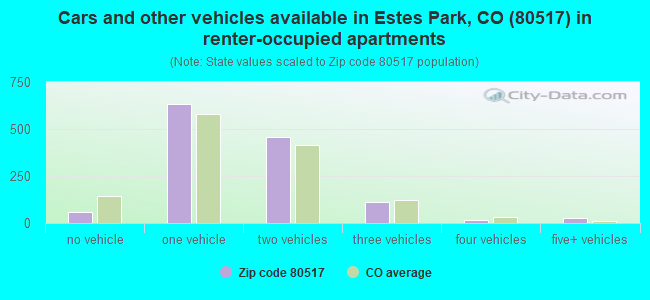
Houses and condos: 7,426 Renter-occupied apartments: 1,309
% of renters here:
25%
State:
34%
March 2022 cost of living index in zip code 80517: 101.7 (near average, U.S. average is 100)
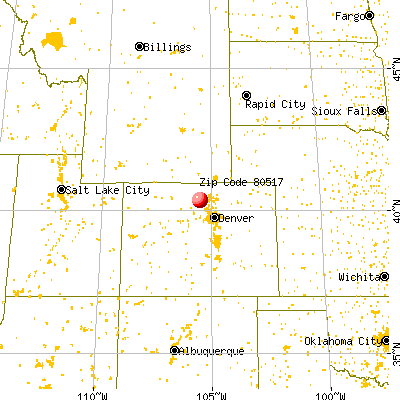
Land area: 295.9 sq. mi. Water area: 1.4 sq. mi.
Population density: 36 people per square mile
(very low).
OSM Map
General Map
Google Map
MSN Map
OSM Map
General Map
Google Map
MSN Map
OSM Map
General Map
Google Map
MSN Map
OSM Map
General Map
Google Map
MSN Map
Please wait while loading the map...
Real estate property taxes paid for housing units in 2022:
This zip code:
0.4% ($2,762)
Colorado:
0.5% ($2,422)
Median real estate property taxes paid for housing units with mortgages in 2022: $2,676 (0.4%) Median real estate property taxes paid for housing units with no mortgage in 2022: $3,003 (0.4%)
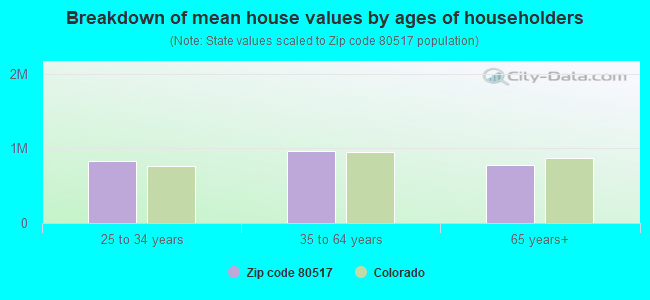
Estimated median house/condo value in 2022: $713,719
80517:
$713,719
Colorado:
$531,100
According to our research of Colorado and other state lists, there were 3 registered sex offenders living in 80517 zip code as of April 25, 2024. The ratio of all residents to sex offenders in zip code 80517 is 3,096 to 1. The ratio of registered sex offenders to all residents in this zip code is much lower than the state average.
Median resident age:
This zip code:
57.0 years
Colorado median age:
37.7 years
Average household size:
This zip code:
1.9 people
Colorado:
2.4 people
Averages for the 2020 tax year for zip code 80517, filed in 2021:
Average Adjusted Gross Income (AGI) in 2020: $89,179 (Individual Income Tax Returns)
Here:
$89,179
State:
$89,260
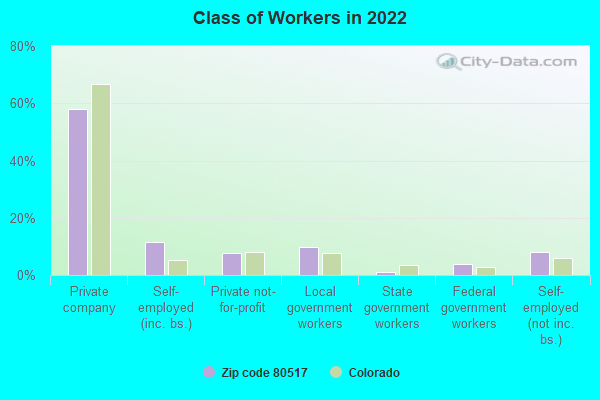
Salary/wage: $55,419 (reported on 69.8% of returns)
Here:
$55,419
State:
$70,330
(% of AGI for various income ranges: 1275.4% for AGIs below $25k, 3691.0% for AGIs $25k-50k, 6072.4% for AGIs $50k-75k, 7258.6% for AGIs $75k-100k, 13023.2% for AGIs $100k-200k, 58214.5% for AGIs over 200k)
Taxable interest for individuals: $2,030 (reported on 50.7% of returns)
This zip code:
$2,030
Colorado:
$2,176
(% of AGI for various income ranges: 53.9% for AGIs below $25k, 50.0% for AGIs $25k-50k, 102.9% for AGIs $50k-75k, 212.9% for AGIs $75k-100k, 384.5% for AGIs $100k-200k, 1780.9% for AGIs over 200k)
Ordinary dividends: $10,322 (reported on 36.1% of returns)
Here:
$10,322
State:
$8,820
(% of AGI for various income ranges: 117.9% for AGIs below $25k, 135.8% for AGIs $25k-50k, 441.4% for AGIs $50k-75k, 645.4% for AGIs $75k-100k, 1523.2% for AGIs $100k-200k, 6983.6% for AGIs over 200k)
Net capital gain/loss in AGI: +$29,354 (reported on 33.0% of returns)
Here:
+$29,354
State:
+$37,276
(% of AGI for various income ranges: 24.0% for AGIs below $25k, 124.2% for AGIs $25k-50k, 246.4% for AGIs $50k-75k, 509.3% for AGIs $75k-100k, 2157.2% for AGIs $100k-200k, 35219.1% for AGIs over 200k)
Profit/loss from business: +$16,237 (reported on 19.0% of returns)
Here:
+$16,237
State:
+$15,295
(% of AGI for various income ranges: 149.4% for AGIs below $25k, 213.5% for AGIs $25k-50k, 462.9% for AGIs $50k-75k, 549.6% for AGIs $75k-100k, 1000.2% for AGIs $100k-200k, 5137.3% for AGIs over 200k)
Taxable individual retirement arrangement distribution: $29,988 (reported on 18.4% of returns)
80517:
$29,988
Colorado:
$23,785
(% of AGI for various income ranges: 87.9% for AGIs below $25k, 204.1% for AGIs $25k-50k, 620.7% for AGIs $50k-75k, 1147.5% for AGIs $75k-100k, 2690.5% for AGIs $100k-200k, 9118.2% for AGIs over 200k)
Self-employed (Keogh) retirement plans: $20,475 (reported on 0.8% of returns)
80517:
$20,475
Colorado:
$23,633
(% of AGI for various income ranges: 204.8% for AGIs $100k-200k)
Total itemized deductions: $40,172 (reported on 15.0% of returns)
Here:
$40,172
State:
$35,141
(% of AGI for various income ranges: 97.0% for AGIs below $25k, 299.8% for AGIs $25k-50k, 702.4% for AGIs $50k-75k, 1030.7% for AGIs $75k-100k, 2125.5% for AGIs $100k-200k, 12770.0% for AGIs over 200k)
Charity contributions: $11,189 (reported on 12.1% of returns)
Here:
$11,189
State:
$12,103
(% of AGI for various income ranges: 4.0% for AGIs below $25k, 21.4% for AGIs $25k-50k, 116.4% for AGIs $50k-75k, 259.6% for AGIs $75k-100k, 465.5% for AGIs $100k-200k, 3517.3% for AGIs over 200k)
Taxes paid: $7,135 (reported on 15.0% of returns)
80517:
$7,135
State:
$7,710
(% of AGI for various income ranges: 14.6% for AGIs below $25k, 36.7% for AGIs $25k-50k, 124.8% for AGIs $50k-75k, 208.2% for AGIs $75k-100k, 522.5% for AGIs $100k-200k, 1822.7% for AGIs over 200k)
Earned income credit: $1,588 (reported on 8.0% of returns)
Here:
$1,588
State:
$2,053
(% of AGI for various income ranges: 43.4% for AGIs below $25k, 33.9% for AGIs $25k-50k)
Percentage of individuals using paid preparers for their 2020 taxes: 91.1%
Here:
91%
State:
93%
(% for various income ranges: 89.6% for AGIs below $25k, 91.8% for AGIs $25k-50k, 92.0% for AGIs $50k-75k, 88.5% for AGIs $75k-100k, 92.3% for AGIs $100k-200k, 93.0% for AGIs over 200k)
Averages for the 2012 tax year for zip code 80517, filed in 2013:
Average Adjusted Gross Income (AGI) in 2012: $64,384 (Individual Income Tax Returns)
Here:
$64,384
State:
$69,103
Salary/wage: $42,209 (reported on 71.8% of returns)
Here:
$42,209
State:
$54,794
(% of AGI for various income ranges: 69.9% for AGIs below $25k, 66.0% for AGIs $25k-50k, 54.6% for AGIs $50k-75k, 45.3% for AGIs $75k-100k, 44.2% for AGIs $100k-200k, 31.6% for AGIs over 200k)
Taxable interest for individuals: $2,228 (reported on 45.9% of returns)
This zip code:
$2,228
Colorado:
$1,971
(% of AGI for various income ranges: 2.3% for AGIs below $25k, 1.2% for AGIs $25k-50k, 1.6% for AGIs $50k-75k, 1.9% for AGIs $75k-100k, 1.3% for AGIs $100k-200k, 1.7% for AGIs over 200k)
Ordinary dividends: $9,238 (reported on 35.8% of returns)
Here:
$9,238
State:
$7,140
(% of AGI for various income ranges: 4.9% for AGIs below $25k, 3.1% for AGIs $25k-50k, 4.4% for AGIs $50k-75k, 4.2% for AGIs $75k-100k, 4.4% for AGIs $100k-200k, 7.8% for AGIs over 200k)
Net capital gain/loss in AGI: +$14,590 (reported on 31.3% of returns)
Here:
+$14,590
State:
+$23,009
(% of AGI for various income ranges: 1.0% for AGIs $25k-50k, 1.9% for AGIs $50k-75k, 3.3% for AGIs $75k-100k, 4.6% for AGIs $100k-200k, 19.3% for AGIs over 200k)
Profit/loss from business: +$12,368 (reported on 18.9% of returns)
Here:
+$12,368
State:
+$13,514
(% of AGI for various income ranges: 8.9% for AGIs below $25k, 4.7% for AGIs $25k-50k, 2.5% for AGIs $50k-75k, 4.0% for AGIs $75k-100k, 3.0% for AGIs $100k-200k, 2.7% for AGIs over 200k)
Taxable individual retirement arrangement distribution: $21,204 (reported on 18.9% of returns)
80517:
$21,204
Colorado:
$17,927
(% of AGI for various income ranges: 4.4% for AGIs below $25k, 3.9% for AGIs $25k-50k, 4.8% for AGIs $50k-75k, 6.6% for AGIs $75k-100k, 8.9% for AGIs $100k-200k, 5.6% for AGIs over 200k)
Self-employment retirement plans: $22,050 (reported on 0.8% of returns)
80517:
$22,050
Colorado:
$19,483
Total itemized deductions: $25,591 (23% of AGI, reported on 39.9% of returns)
Here:
$25,591
State:
$24,621
Here:
23.5% of AGI
State:
18.5% of AGI
(% of AGI for various income ranges: 20.7% for AGIs below $25k, 14.9% for AGIs $25k-50k, 16.7% for AGIs $50k-75k, 16.3% for AGIs $75k-100k, 16.2% for AGIs $100k-200k, 14.0% for AGIs over 200k)
Charity contributions: $5,163 (reported on 34.2% of returns)
Here:
$5,163
State:
$4,449
(% of AGI for various income ranges: 1.6% for AGIs below $25k, 1.7% for AGIs $25k-50k, 2.5% for AGIs $50k-75k, 2.5% for AGIs $75k-100k, 3.1% for AGIs $100k-200k, 3.5% for AGIs over 200k)
Taxes paid: $7,106 (reported on 39.5% of returns)
80517:
$7,106
State:
$7,641
(% of AGI for various income ranges: 3.1% for AGIs below $25k, 2.9% for AGIs $25k-50k, 3.5% for AGIs $50k-75k, 4.3% for AGIs $75k-100k, 5.0% for AGIs $100k-200k, 5.3% for AGIs over 200k)
Earned income credit: $1,846 (reported on 10.1% of returns)
Here:
$1,846
State:
$2,095
(% of AGI for various income ranges: 3.0% for AGIs below $25k, 0.6% for AGIs $25k-50k)
Percentage of individuals using paid preparers for their 2012 taxes: 52.1%
Here:
52%
State:
49%
(% for various income ranges: 43.0% for AGIs below $25k, 50.8% for AGIs $25k-50k, 56.8% for AGIs $50k-75k, 59.6% for AGIs $75k-100k, 60.3% for AGIs $100k-200k, 81.0% for AGIs over 200k)
Averages for the 2004 tax year for zip code 80517, filed in 2005:
Average Adjusted Gross Income (AGI) in 2004: $53,145 (Individual Income Tax Returns)
Here:
$53,145
State:
$55,014
Salary/wage: $33,882 (reported on 72.9% of returns)
Here:
$33,882
State:
$46,010
(% of AGI for various income ranges: 156.6% for AGIs below $10k, 66.6% for AGIs $10k-25k, 64.4% for AGIs $25k-50k, 53.3% for AGIs $50k-75k, 51.9% for AGIs $75k-100k, 30.2% for AGIs over 100k)
Taxable interest for individuals: $2,709 (reported on 60.4% of returns)
This zip code:
$2,709
Colorado:
$2,127
(% of AGI for various income ranges: 21.7% for AGIs below $10k, 3.8% for AGIs $10k-25k, 2.8% for AGIs $25k-50k, 2.8% for AGIs $50k-75k, 2.1% for AGIs $75k-100k, 3.1% for AGIs over 100k)
Taxable dividends: $5,631 (reported on 40.3% of returns)
Here:
$5,631
State:
$3,782
(% of AGI for various income ranges: 18.6% for AGIs below $10k, 3.5% for AGIs $10k-25k, 3.3% for AGIs $25k-50k, 2.9% for AGIs $50k-75k, 3.2% for AGIs $75k-100k, 5.3% for AGIs over 100k)
Net capital gain/loss: +$18,547 (reported on 36.6% of returns)
Here:
+$18,547
State:
+$17,882
(% of AGI for various income ranges: 28.6% for AGIs below $10k, 0.4% for AGIs $10k-25k, 1.5% for AGIs $25k-50k, 2.6% for AGIs $50k-75k, 4.1% for AGIs $75k-100k, 25.0% for AGIs over 100k)
Profit/loss from business: +$8,991 (reported on 20.8% of returns)
Here:
+$8,991
State:
+$11,247
(% of AGI for various income ranges: -19.4% for AGIs below $10k, 6.3% for AGIs $10k-25k, 5.4% for AGIs $25k-50k, 3.1% for AGIs $50k-75k, 3.3% for AGIs $75k-100k, 3.0% for AGIs over 100k)
IRA payment deduction: $3,275 (reported on 4.5% of returns)
80517:
$3,275
Colorado:
$2,947
(% of AGI for various income ranges: 0.5% for AGIs $10k-25k, 0.5% for AGIs $25k-50k, 0.3% for AGIs $50k-75k, 0.3% for AGIs $75k-100k, 0.1% for AGIs over 100k)
Self-employed pension: $14,984 (reported on 1.3% of returns)
Here:
$14,984
Colorado:
$13,653
(% of AGI for various income ranges: 1.8% for AGIs below $10k, 0.3% for AGIs $50k-75k, 0.6% for AGIs over 100k)
Total itemized deductions: $20,736 (24% of AGI, reported on 43.1% of returns)
Here:
$20,736
State:
$20,560
Here:
23.9% of AGI
State:
21.4% of AGI
(% of AGI for various income ranges: 69.9% for AGIs below $10k, 20.7% for AGIs $10k-25k, 19.0% for AGIs $25k-50k, 19.2% for AGIs $50k-75k, 19.6% for AGIs $75k-100k, 12.6% for AGIs over 100k)
Charity contributions deductions: $4,105 (4% of AGI, reported on 37.6% of returns)
Here:
$4,105
State:
$3,518
Here:
4.5% of AGI
State:
3.4% of AGI
(% of AGI for various income ranges: 3.7% for AGIs below $10k, 2.3% for AGIs $10k-25k, 2.1% for AGIs $25k-50k, 2.8% for AGIs $50k-75k, 3.5% for AGIs $75k-100k, 3.1% for AGIs over 100k)
Total tax: $8,481 (reported on 78.2% of returns)
80517:
$8,481
State:
$9,173
(% of AGI for various income ranges: 7.2% for AGIs below $10k, 4.8% for AGIs $10k-25k, 7.2% for AGIs $25k-50k, 8.8% for AGIs $50k-75k, 10.3% for AGIs $75k-100k, 17.8% for AGIs over 100k)
Earned income credit: $1,335 (reported on 9.2% of returns)
Here:
$1,335
State:
$1,595
Percentage of individuals using paid preparers for their 2004 taxes: 59.2%
Here:
59%
State:
55%
(% for various income ranges: 55.1% for AGIs below $10k, 55.2% for AGIs $10k-25k, 58.8% for AGIs $25k-50k, 60.1% for AGIs $50k-75k, 61.4% for AGIs $75k-100k, 72.5% for AGIs over 100k)
Likely homosexual households (counted as self-reported same-sex unmarried-partner households)
Lesbian couples: 0.5% of all households
Gay men: 0.0% of all households
Household received Food Stamps/SNAP in the past 12 months: 171 Household did not receive Food Stamps/SNAP in the past 12 months: 4,987
Women who had a birth in the past 12 months: 134 (66 now married, 62 unmarried) Women who did not have a birth in the past 12 months: 1,542 (894 now married, 642 unmarried)
Housing units in zip code 80517 with a mortgage: 2,413 (218 second mortgage, 192 both second mortgage and home equity loan) Houses without a mortgage: 166
Median monthly owner costs for units with a mortgage: $2,273 Median monthly owner costs for units without a mortgage: $670
Residents with income below the poverty level in 2022:
This zip code:
9.8%
Whole state:
9.4%
Residents with income below 50% of the poverty level in 2022:
This zip code:
3.7%
Whole state:
4.6%
Median number of rooms in houses and condos:
Here:
6.4
State:
6.8
Median number of rooms in apartments:
Here:
4.1
State:
4.0
Notable locations in this zip code not listed on our city pages
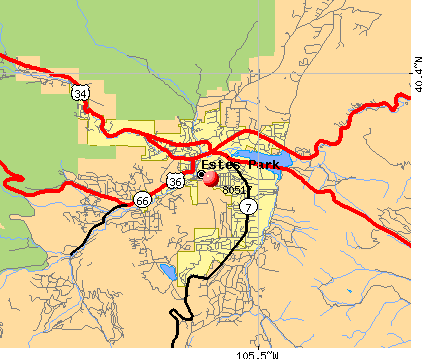
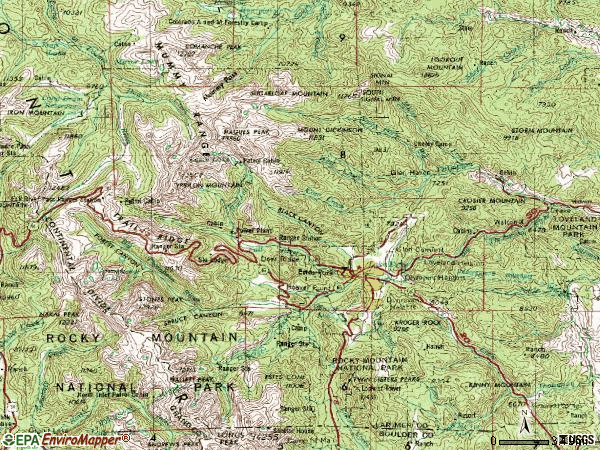
Notable locations in zip code 80517: Colorado State Fish Hatchery (A), Estes Park District Ranger Office (B), Glacier Basin Campground (C), Longs Peak Campground (D), Lion Gulch Trailhead (E), Moraine Park Campground (F), Beaver Ponds Picnic Area (G), Meadowdale Ranch (H), Longs Peak Ranger Station (I), Beaver Meadows Entrance (J), Moraine Park Visitor Center (K), Estes Park Center/YMCA of the Rockies (L), Cheley Camp (M), Glacier Gorge Junction (N), Tundra Curves (O), H Bar G Ranch (P), Camp Bob Waite (Q), Glen Haven Picnic Ground (R), Endovalley Campground (S), Many Parks Curve (T). Display/hide their locations on the map
Cemeteries: Saint Francis of Assisi Anglican Church Cemetery (1), Saint Bartholomew Episcopal Church Cemetery (2), Doctor Thornton R Sampson Grave (3), Herbert Richards Grave (4), Estes Valley Memorial Gardens (5), J P Chitwood Grave (6), Edwin Bradt Grave (7). Display/hide their locations on the map
Lakes and reservoirs: Doughnut Lake (A), Rock Lake (B), Gorge Lakes (C), Little Rock Lake (D), Highest Lake (E), Loomis Lake (F), Dream Lake (G), Jewel Lake (H). Display/hide their locations on the map
Streams, rivers, and creeks: Tyndall Creek (A), Spruce Creek (B), Inn Brook (C), Moss Brook (D), Chapin Creek (E), Chiquita Creek (F), Fox Creek (G), Cow Creek (H), Buck Creek (I). Display/hide their locations on the map
Parks in zip code 80517 include: Rocky Mountain National Park (1), Agnes Vaille Memorial Shelter (2), Rocky Mountain National Park Administration Building (3). Display/hide their locations on the map
Tourist attractions (not listed on the city page) : Trout Haven Vacation Rentals (810 Moraine Avenue) (1), American Wilderness Tours (Tours & Charters; 875 Moraine Avenue) (2), Colorado Mountain School (Tours & Charters; 341 Moraine Avenue) (3), Colorado Kitchen & Bath (Tours & Charters; 525 Pine River Lane) (4). Display/hide their approximate locations on the map
In group quarters: 618 (-1 institutionalized population)
Size of family households: 2,355 2-persons, 584 3-persons, 257 4-persons, 118 5-persons, 12 6-persons, 23 7-or-more-persons
Size of nonfamily households: 1,550 1-person, 288 2-persons, 30 4-persons
765 married couples with children.
113 single-parent households (31 men, 82 women).
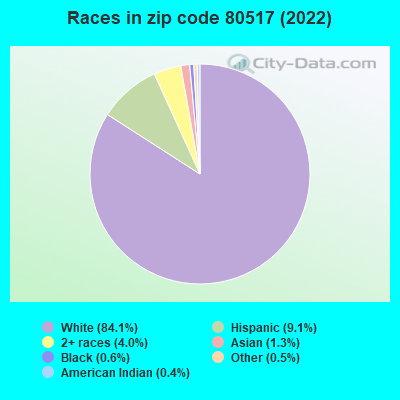
91.1% of residents of 80517 zip code speak English at home.
8.0% of residents speak Spanish at home (53% very well, 10% well, 26% not well, 11% not at all).
1.6% of residents speak other Indo-European language at home (96% very well, 4% well).
0.6% of residents speak Asian or Pacific Island language at home (2% very well, 98% well).
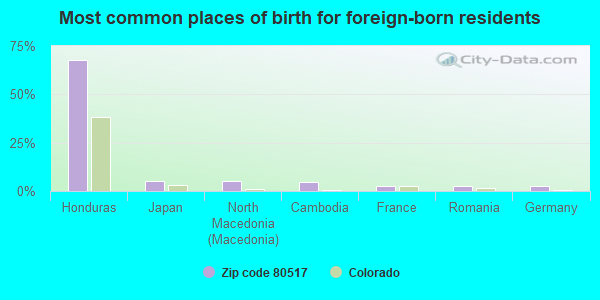
Foreign born population: 737 (7.0%) (21.3% of them are naturalized citizens)
This zip code:
7.0%
Whole state:
9.5%
68%Honduras
5%Japan
5%North Macedonia (Macedonia)
5%Cambodia
3%France
3%Romania
3%Germany
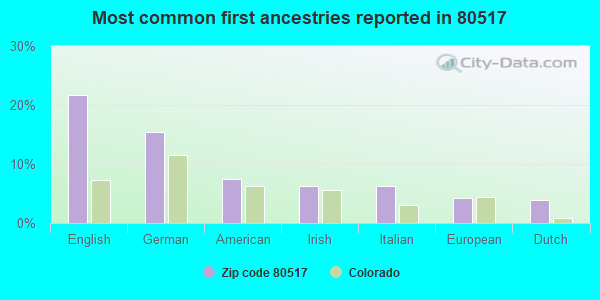
22%English
15%German
7%American
6%Irish
6%Italian
4%European
4%Dutch
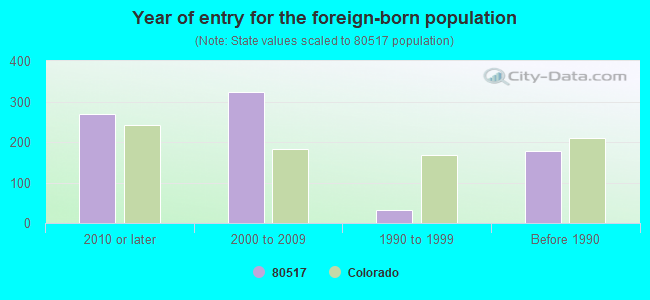
Year of entry for the foreign-born population
2692010 or later
3232000 to 2009
321990 to 1999
177Before 1990
Facilities with environmental interests located in this zip code:
HARVEST HOUSE FOR WOMEN (5532 US HIGHWAY 36 in ESTES PARK, CO)
(Integrated Compliance Information System) - ICIS-08-2000-0140, FORMAL ENFORCEMENT ACTION COMMUNITY WATER SYSTEM (SDWIS) - SDWIS-CO0235506 4, WATER TREATMENT PLANT Alternative names: HARVEST HOUSE RANCH
ASPEN LODGE AT ESTES PARK CORPORATION (6120 HIGHWAY 7 in ESTES PARK, CO)
STATE MASTER (Colorado database) - NPDES-CO0042820, NPDES NON-MAJOR National Pollutant Discharge Elimination System NON-MAJOR (Tracking pollutant discharge elimination systems) - permit National Pollutant Discharge Elimination System NON-MAJOR (Tracking pollutant discharge elimination systems) - permit Business SIC classification: SEWERAGE SYSTEMS Alternative names: STANGER-ASPEN LTD.
BROWNS CHINESE LAUNDRY DRY CLNRS (183 W RIVERSIDE DR in ESTES PARK, CO)
AIR MINOR (AIRS/AFS) Conditionally Exempt Small Quantity Generators, less than 100 kg/month of hazardous waste (Resource Conservation and Recovery Act (tracking hazardous waste)) - notification Business SIC classification: DRYCLEANING PLANTS, EXCEPT RUG CLEANING Organizations: CHRISTOPHER J BROWN (CONTACT/OWNER)
Alternative names: BROWN'S CHINESE DRY CLEANING
AGILENT TECHNOLOGIES INCORPORATED (3860 HIGHWAY 66 in ESTES PARK, CO)
Conditionally Exempt Small Quantity Generators, less than 100 kg/month of hazardous waste (Resource Conservation and Recovery Act (tracking hazardous waste)) - notification Organizations: AGILENT TECHONLOGIES INC (CONTACT/OWNER)
, HEWLETT-PACKARD CO (LOVELAND) (CONTACT/OWNER)
ABSS-ALIGNMENT BRAKES SUSPENSION SPECIALIST (840 DUNRAVEN STREET in ESTES PARK, CO)
ENFORCEMENT/COMPLIANCE ACTIVITY (Integrated Compliance Information System) Business SIC classification: GENERAL AUTOMOTIVE REPAIR SHOPS
AGLAND, INC. (320 ELM RD in ESTES PARK, CO)
AIR SYNTHETIC MINOR (AIRS/AFS) Business SIC classification: PETROLEUM BULK STATIONS AND TERMINALS
CENTURY 21 PEAK REALTY (240 EAST ELKHORN AVENUE in ESTES PARK, CO)
ENFORCEMENT/COMPLIANCE ACTIVITY (Integrated Compliance Information System)
Housing units lacking complete plumbing facilities: 0.4% Housing units lacking complete kitchen facilities: 1.7%
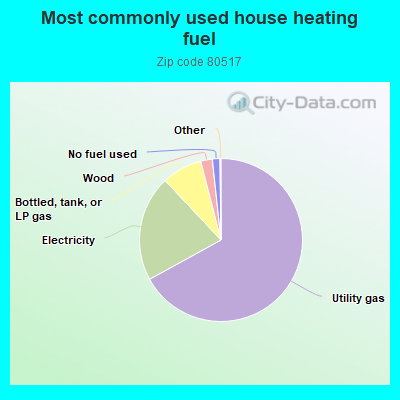
67.0%Utility gas
21.0%Electricity
8.0%Bottled, tank, or LP gas
2.3%Wood
1.5%No fuel used
Population in 1990: 6,428. Population change in the 1990s: +2,719 (+42.3%).
Place of birth for U.S.-born residents:
This state: 2,552
Northeast: 808
Midwest: 3,759
South: 1,498
West: 1,102
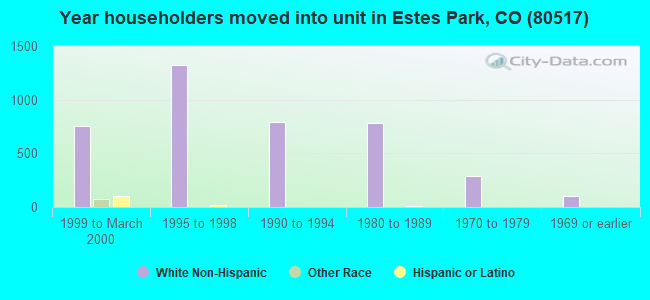
49% of the 80517 zip code residents lived in the same house 5 years ago. Out of people who lived in different houses, 43% lived in this county. Out of people who lived in different counties, 50% lived in Colorado.
89% of the 80517 zip code residents lived in the same house 1 year ago. Out of people who lived in different houses, 33% moved from this county. Out of people who lived in different houses, 34% moved from different county within same state. Out of people who lived in different houses, 25% moved from different state. Out of people who lived in different houses, 11% moved from abroad.
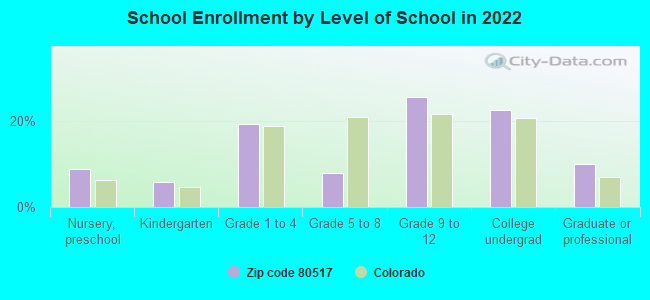
Private vs. public school enrollment:
Students in private schools in grades 1 to 8 (elementary and middle school): 71
Here:
23.9%
Colorado:
11.4%
Students in private schools in grades 9 to 12 (high school): 127
Here:
45.6%
Colorado:
8.5%
Students in private undergraduate colleges: 24
Here:
9.8%
Colorado:
14.0%
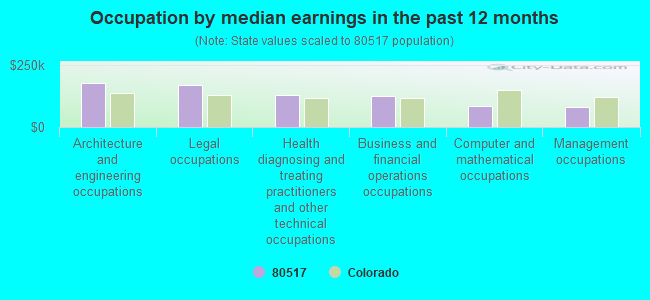
Occupation by median earnings in the past 12 months ($)
178,460Architecture and engineering occupations
171,147Legal occupations
130,811Health diagnosing and treating practitioners and other technical occupations
125,329Business and financial operations occupations
87,065Computer and mathematical occupations
81,826Management occupations
Companies with federal contracts located in this zip code:
ESTES PARK FIRE DEPT (901 N SAINT VRAIN AVE in ESTES PARK, CO; small business) : $23,000 in 2 contractsfrom 2002 to 2003
$14,000 with National Park Service for Fire Fighting Equipment. Signed on 2003-07-15. Completion date: 2003-08-15.
$9,000, same as above.Signed on 2002-05-15. Completion date: 2002-08-15.
BUCKNER RICHARD P (2715 NIMBUS DR in ESTES PARK, CO; small business)
$14,985 with Air Force for Miscellaneous Communication Equipment. Taking place in MD. Signed on 2005-09-09. Completion date: 2005-10-11.
Top industries in this zip code by the number of employees in 2005:
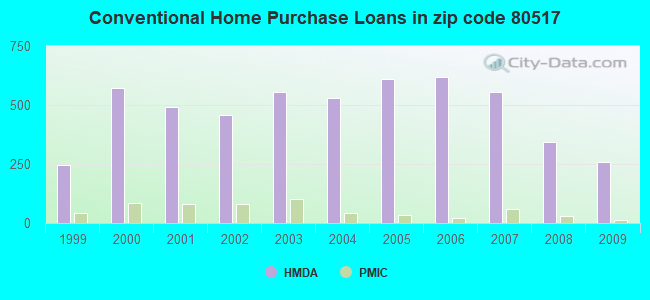
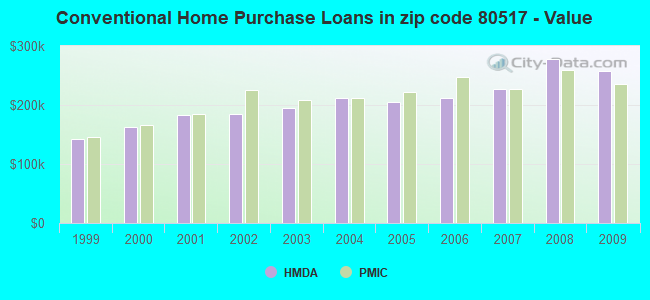
Detailed PMIC statistics for the following Tracts:0019.03
, 0028.00
2003 - 2018 National Fire Incident Reporting System (NFIRS) incidents
According to the data from the years 2003 - 2018 the average number of fires per year is 34. The highest number of reported fire incidents - 50 took place in 2012, and the least - 24 in 2015. The data has an increasing trend.
When looking into fire subcategories, the most reports belonged to: Structure Fires (46.8%), and Outside Fires (40.7%).
Fire incident types reported to NFIRS in Zip Code 80517


 Nearest zip codes: 80511, 80532, 80510, 80447, 80515, 80512.


 According to the data from the years 2003 - 2018 the average number of fires per year is 34. The highest number of reported fire incidents - 50 took place in 2012, and the least - 24 in 2015. The data has an increasing trend.
 When looking into fire subcategories, the most reports belonged to: Structure Fires (46.8%), and Outside Fires (40.7%).