Estimated zip code population in 2022: 226 Zip code population in 2010: 225 Zip code population in 2000: 310
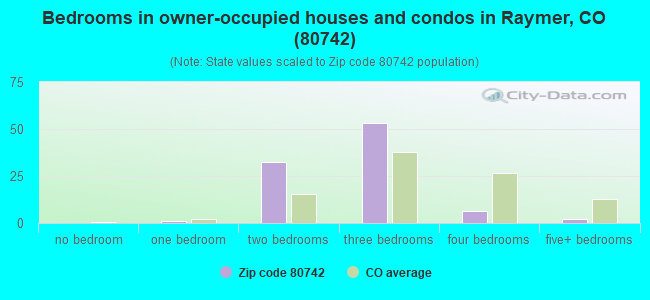
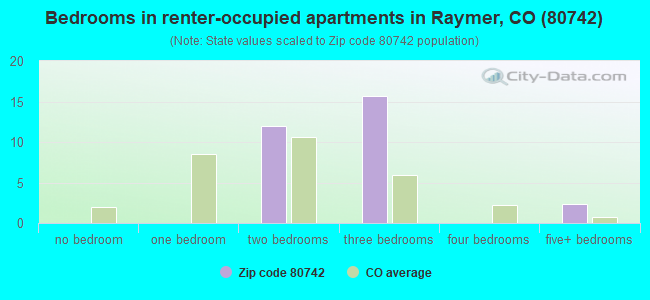
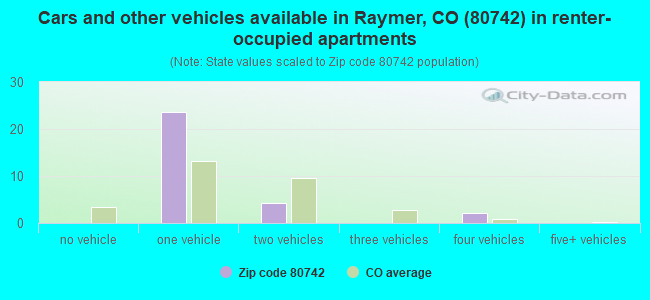
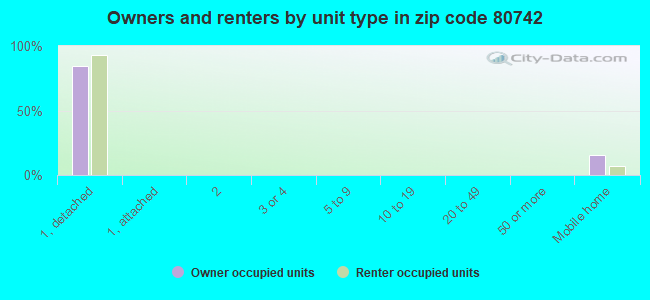
Houses and condos: 144 Renter-occupied apartments: 30
% of renters here:
24%
State:
34%
March 2022 cost of living index in zip code 80742: 98.3 (near average, U.S. average is 100)
Land area: 446.0 sq. mi. Water area: 0.0 sq. mi.
Population density: 0.507 people per square mile
(very low).
OSM Map
General Map
Google Map
MSN Map
OSM Map
General Map
Google Map
MSN Map
OSM Map
General Map
Google Map
MSN Map
OSM Map
General Map
Google Map
MSN Map
Please wait while loading the map...
Real estate property taxes paid for housing units in 2022:
This zip code:
0.3% ($518)
Colorado:
0.5% ($2,422)
Median real estate property taxes paid for housing units with mortgages in 2022: $897 (0.2%) Median real estate property taxes paid for housing units with no mortgage in 2022: $305 (0.1%)
Business Search- 14 Million verified businesses
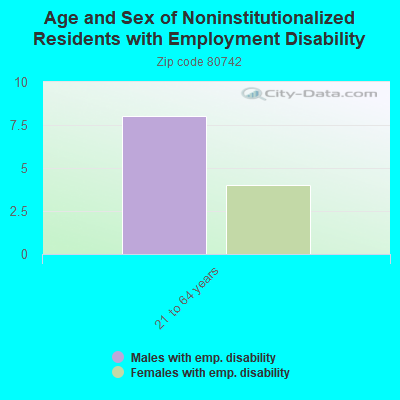
Males: 124
(54.9%)
Females: 102
(45.1%)
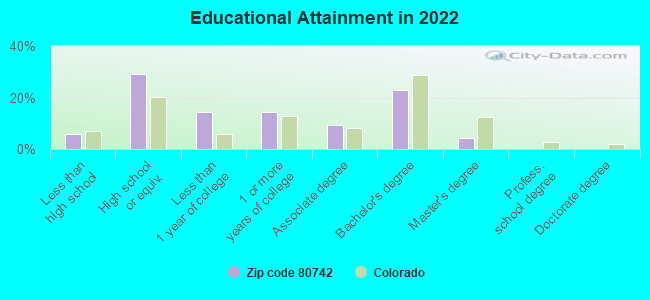
For population 25 years and over in 80742:
High school or higher: 92.0%
Bachelor's degree or higher: 26.9%
Graduate or professional degree: 4.1%
Unemployed: 5.0%
Mean travel time to work (commute): 29.7 minutes
For population 15 years and over in 80742:
Never married: 27.2%
Now married: 55.7%
Separated: 0.4%
Widowed: 8.3%
Divorced: 8.4%
Zip code 80742 compared to state average:
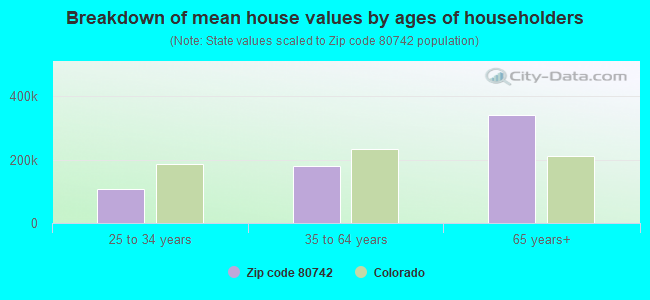
Median house value significantly below state average.
Black race population percentage significantly below state average.
Hispanic race population percentage significantly below state average.
Median age significantly above state average.
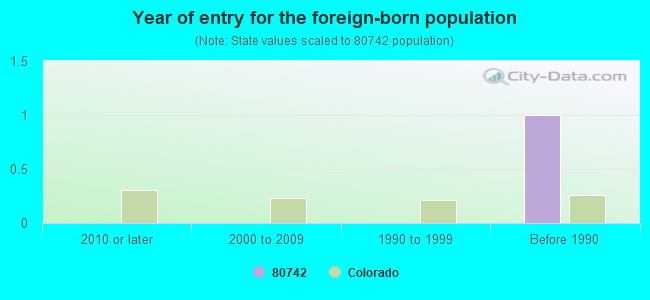
Foreign-born population percentage significantly below state average.
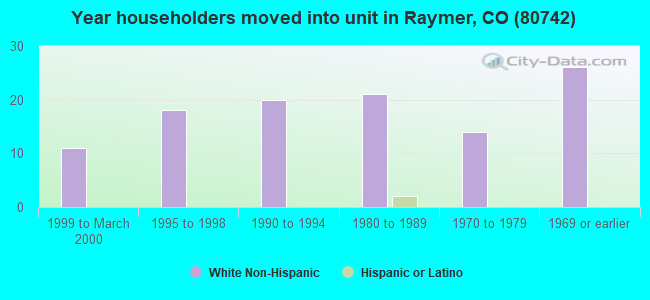
Length of stay since moving in significantly above state average.
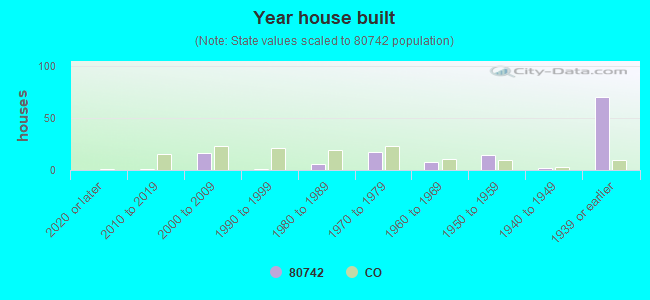
House age significantly above state average.
Number of college students significantly below state average.
According to our research of Colorado and other state lists, there was 1 registered sex offender living in 80742 zip code as of April 19, 2024. The ratio of all residents to sex offenders in zip code 80742 is 180 to 1.
Median resident age:
This zip code:
62.0 years
Colorado median age:
37.7 years
Average household size:
This zip code:
1.8 people
Colorado:
2.4 people
Averages for the 2004 tax year for zip code 80742, filed in 2005:
Average Adjusted Gross Income (AGI) in 2004: $25,375 (Individual Income Tax Returns)
Here:
$25,375
State:
$55,014
Salary/wage: $24,020 (reported on 63.7% of returns)
Here:
$24,020
State:
$46,010
Taxable interest for individuals: $289 (reported on 56.2% of returns)
This zip code:
$289
Colorado:
$2,127
Taxable dividends: $167 (reported on 30.0% of returns)
Here:
$167
State:
$3,782
Net capital gain/loss: +$632 (reported on 23.8% of returns)
Here:
+$632
State:
+$17,882
Total tax: $2,650 (reported on 75.0% of returns)
80742:
$2,650
State:
$9,173
(% of AGI for various income ranges: 6.6% for AGIs $10k-25k, 6.5% for AGIs $25k-50k, 9.1% for AGIs $50k-75k)
Percentage of individuals using paid preparers for their 2004 taxes: 81.2%
Size of family households: 54 2-persons, 7 3-persons, 2 4-persons
Size of nonfamily households: 45 1-person, 15 2-persons
10 married couples with children.
2 single-parent households (2 men).
101.3% of residents of 80742 zip code speak English at home.
Foreign born population: 0 (0.0%)
:
0.0%
Whole state:
9.5%
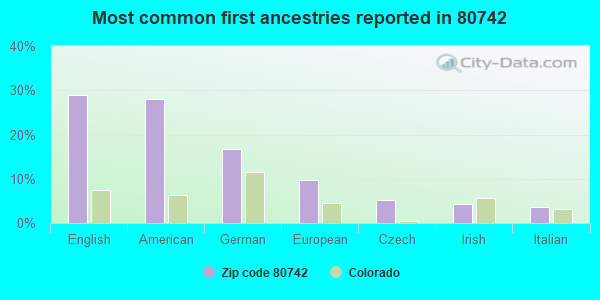
29%English
28%American
17%German
10%European
5%Czech
4%Irish
4%Italian
Year of entry for the foreign-born population
02010 or later
02000 to 2009
01990 to 1999
1Before 1990
Facilities with environmental interests located in this zip code:
ANTELOPE ENERGY CO - NELSON RANCH C #1 (NE NW SEC 18 T10N R58W in RAYMER, 16.1 MI N OF, CO)
AIR MINOR (AIRS/AFS) CRITERIA AND HAZARDOUS AIR POLLUTANT INVENTORY (Inventory of air pollution sources) Business SIC classification: CRUDE PETROLEUM AND NATURAL GAS; NATURAL GAS LIQUIDS Business NAICS classification: CRUDE PETROLEUM AND NATURAL GAS EXTRACTION. Alternative names: ANTELOPE ENERGY CO - NELSON RANCH A 1,2,, ANTELOPE ENERGY CO - NELSON RANCHES, ANTELOPE ENERGY COMPANY-TERANCE PLANT, ANTELOPE PRODUCTION COMPANY, ANTELOPE PRODUCTION COMPANY
ANTELOPE ENERGY CO - CEDAR VALLEY STATIO (NW/4 SEC 22 T10N R57W in RAYMER, 15.6 MI N OF, CO)
AIR MINOR (AIRS/AFS) CRITERIA AND HAZARDOUS AIR POLLUTANT INVENTORY (Inventory of air pollution sources) Business SIC classification: CRUDE PETROLEUM AND NATURAL GAS
ANTELOPE ENERGY CO - NELSON RANCH A 3,4, (SE NE SEC 17 T10N R58W in RAYMER, 15.6 MI N OF, CO)
AIR MINOR (AIRS/AFS) CRITERIA AND HAZARDOUS AIR POLLUTANT INVENTORY (Inventory of air pollution sources) Business SIC classification: NATURAL GAS LIQUIDS
ANTELOPE ENERGY CO- NELSON RANCH A 6,7 (NW SW SEC 20 T10N R58W in RAYMER, 14.5 MI N OF, CO)
AIR MINOR (AIRS/AFS) CRITERIA AND HAZARDOUS AIR POLLUTANT INVENTORY (Inventory of air pollution sources) Business SIC classification: NATURAL GAS LIQUIDS
BITTER CREEK PIPELINES - NEW RAYMER .CN (SEC 22 T7N R58W in RAYMER, CO)
AIR MINOR (AIRS/AFS) CRITERIA AND HAZARDOUS AIR POLLUTANT INVENTORY (Inventory of air pollution sources) Business SIC and NAICS classification: CRUDE PETROLEUM AND NATURAL GAS Alternative names: BITTER CREEK PIPELINES NEW RAYMER CS
INTER MOUNTAIN OIL CO - CRAIG WELLS (SE SW SEC 29 T9N R56W in RAYMER, 11.7 MI NE OF, CO)
AIR MINOR (AIRS/AFS) CRITERIA AND HAZARDOUS AIR POLLUTANT INVENTORY (Inventory of air pollution sources) Business SIC classification: NATURAL GAS LIQUIDS
INTER MOUNTAIN OIL CO - TOEDTLI #22-3 (NE NW SEC 22 T10N R57W in RAYMER, 15.8 MI N OF, CO)
AIR MINOR (AIRS/AFS) Business SIC classification: NATURAL GAS LIQUIDS
HORIZON TURF (15470 RD U in FT. MORGAN, CO)
COMPLIANCE ACTIVITY (Tracking inspections of insecticide, fungicide, and rodenticide, and toxic substances)
Housing units lacking complete plumbing facilities: 8.3% Housing units lacking complete kitchen facilities: 1.4%
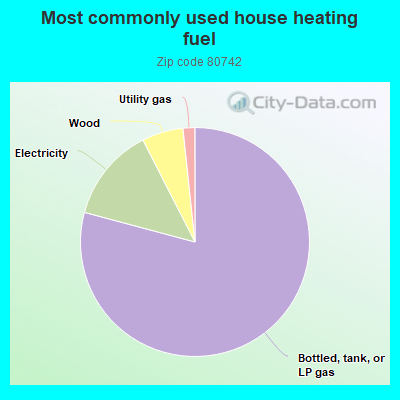
80.2%Bottled, tank, or LP gas
13.5%Electricity
5.9%Wood
1.7%Utility gas
Population in 1990: 310.
Place of birth for U.S.-born residents:
This state: 110
Northeast: 15
Midwest: 59
South: 29
West: 10
66% of the 80742 zip code residents lived in the same house 5 years ago. Out of people who lived in different houses, 40% lived in this county. Out of people who lived in different counties, 50% lived in Colorado.
96% of the 80742 zip code residents lived in the same house 1 year ago. Out of people who lived in different houses, 111% moved from different county within same state.
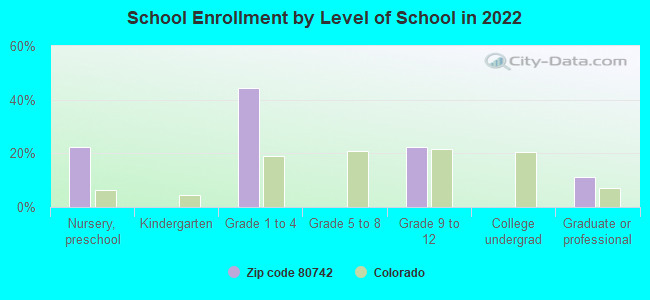
Private vs. public school enrollment:
Students in private schools in grades 1 to 8 (elementary and middle school):
Here:
0.0%
Colorado:
11.4%
Students in private schools in grades 9 to 12 (high school):
Here:
0.0%
Colorado:
8.5%
Students in private undergraduate colleges:
Here:
0.0%
Colorado:
14.0%
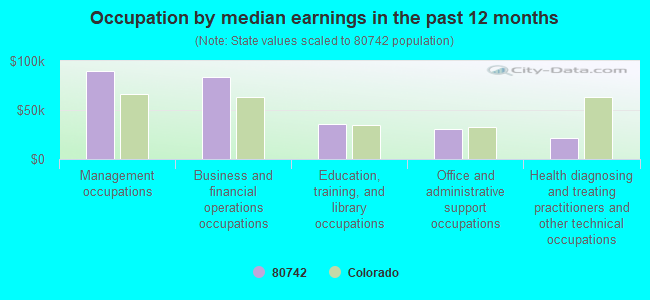
Occupation by median earnings in the past 12 months ($)
89,646Management occupations
83,967Business and financial operations occupations
35,455Education, training, and library occupations
30,658Office and administrative support occupations
21,271Health diagnosing and treating practitioners and other technical occupations
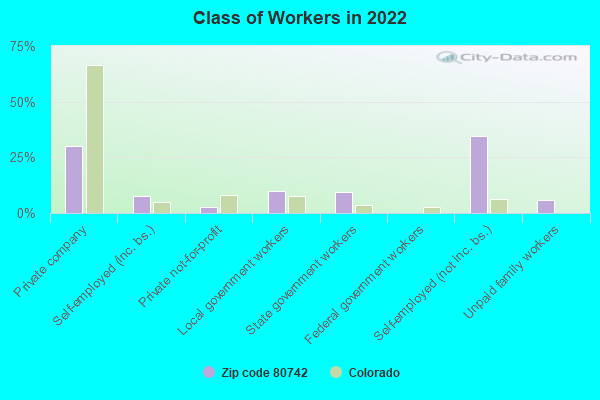
Top industries in this zip code by the number of employees in 2005:
Health Care and Social Assistance: Other Residential Care Facilities (10-19 employees: 1 establishment)
People in group quarters in 2000:
10 people in homes for abused, dependent, and neglected children
7 people in nursing homes
Fatal accident statistics in 2011:
Fatal accident count: 1
Vehicles involved in fatal accidents: 2
Fatal accidents caused by drunken drivers: 0
Fatalities: 1
Persons involved in fatal accidents: 2
Pedestrians involved in fatal accidents: 0
Fatal accident statistics in 2010:
Fatal accident count: 2
Vehicles involved in fatal accidents: 2
Fatal accidents caused by drunken drivers: 2
Fatalities: 2
Persons involved in fatal accidents: 2
Pedestrians involved in fatal accidents: 0
Home Mortgage Disclosure Act Aggregated Statistics For Year 2009 (Based on 2 partial tracts)
A) FHA, FSA/RHS & VA Home Purchase Loans
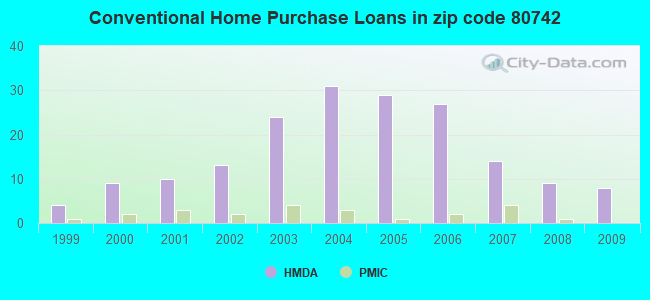
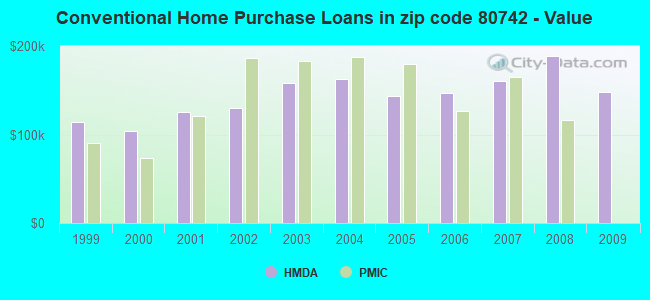
B) Conventional Home Purchase Loans
C) Refinancings
D) Home Improvement Loans
F) Non-occupant Loans on < 5 Family Dwellings (A B C & D)
G) Loans On Manufactured Home Dwelling (A B C & D)
Number
Average Value
Number
Average Value
Number
Average Value
Number
Average Value
Number
Average Value
Number
Average Value
LOANS ORIGINATED
6
$170,930
8
$147,465
28
$201,090
3
$56,530
4
$87,530
6
$154,732
APPLICATIONS APPROVED, NOT ACCEPTED
1
$112,310
2
$59,210
5
$212,582
1
$28,960
2
$132,420
2
$108,930
APPLICATIONS DENIED
1
$127,750
4
$91,875
17
$220,111
2
$25,585
1
$145,130
3
$138,160
APPLICATIONS WITHDRAWN
1
$132,260
1
$101,050
13
$233,330
1
$198,870
1
$85,280
2
$116,650
FILES CLOSED FOR INCOMPLETENESS
0
$0
0
$0
2
$272,405
0
$0
0
$0
0
$0
Aggregated Statistics For Year 2008 (Based on 2 partial tracts)
A) FHA, FSA/RHS & VA Home Purchase Loans
B) Conventional Home Purchase Loans
C) Refinancings
D) Home Improvement Loans
F) Non-occupant Loans on < 5 Family Dwellings (A B C & D)
G) Loans On Manufactured Home Dwelling (A B C & D)
Number
Average Value
Number
Average Value
Number
Average Value
Number
Average Value
Number
Average Value
Number
Average Value
LOANS ORIGINATED
7
$144,304
9
$188,253
20
$193,836
1
$91,710
2
$118,100
9
$133,297
APPLICATIONS APPROVED, NOT ACCEPTED
1
$156,720
1
$172,810
5
$169,074
0
$0
0
$0
1
$93,320
APPLICATIONS DENIED
5
$137,860
4
$103,138
22
$196,444
5
$34,562
1
$86,240
6
$131,295
APPLICATIONS WITHDRAWN
1
$147,710
2
$116,490
6
$143,952
1
$193,400
1
$92,680
2
$75,625
FILES CLOSED FOR INCOMPLETENESS
0
$0
0
$0
1
$199,190
0
$0
0
$0
0
$0
Aggregated Statistics For Year 2007 (Based on 2 partial tracts)
A) FHA, FSA/RHS & VA Home Purchase Loans
B) Conventional Home Purchase Loans
C) Refinancings
D) Home Improvement Loans
F) Non-occupant Loans on < 5 Family Dwellings (A B C & D)
G) Loans On Manufactured Home Dwelling (A B C & D)
Number
Average Value
Number
Average Value
Number
Average Value
Number
Average Value
Number
Average Value
Number
Average Value
LOANS ORIGINATED
6
$148,188
14
$160,004
29
$183,814
6
$49,825
2
$153,015
11
$145,775
APPLICATIONS APPROVED, NOT ACCEPTED
0
$0
3
$109,197
6
$147,867
2
$57,440
1
$98,790
1
$161,540
APPLICATIONS DENIED
1
$127,750
7
$212,066
51
$175,520
11
$87,968
2
$192,760
6
$143,255
APPLICATIONS WITHDRAWN
1
$97,180
3
$138,803
9
$179,279
2
$158,165
1
$28,320
2
$164,920
FILES CLOSED FOR INCOMPLETENESS
0
$0
2
$116,975
3
$237,703
0
$0
0
$0
1
$109,090
Aggregated Statistics For Year 2006 (Based on 2 partial tracts)
A) FHA, FSA/RHS & VA Home Purchase Loans
B) Conventional Home Purchase Loans
C) Refinancings
D) Home Improvement Loans
F) Non-occupant Loans on < 5 Family Dwellings (A B C & D)
G) Loans On Manufactured Home Dwelling (A B C & D)
Number
Average Value
Number
Average Value
Number
Average Value
Number
Average Value
Number
Average Value
Number
Average Value
LOANS ORIGINATED
4
$152,130
27
$146,598
42
$162,003
5
$57,796
4
$142,558
13
$145,726
APPLICATIONS APPROVED, NOT ACCEPTED
0
$0
6
$110,217
11
$179,038
1
$75,940
1
$162,510
1
$176,350
APPLICATIONS DENIED
0
$0
14
$206,113
54
$155,930
7
$62,337
2
$254,865
7
$148,671
APPLICATIONS WITHDRAWN
0
$0
6
$142,772
19
$173,399
1
$195,980
1
$125,820
3
$159,183
FILES CLOSED FOR INCOMPLETENESS
0
$0
1
$48,270
6
$172,592
0
$0
0
$0
0
$0
Aggregated Statistics For Year 2005 (Based on 2 partial tracts)
A) FHA, FSA/RHS & VA Home Purchase Loans
B) Conventional Home Purchase Loans
C) Refinancings
D) Home Improvement Loans
F) Non-occupant Loans on < 5 Family Dwellings (A B C & D)
G) Loans On Manufactured Home Dwelling (A B C & D)
Number
Average Value
Number
Average Value
Number
Average Value
Number
Average Value
Number
Average Value
Number
Average Value
LOANS ORIGINATED
3
$141,270
29
$143,290
50
$165,881
8
$88,334
4
$127,755
11
$130,797
APPLICATIONS APPROVED, NOT ACCEPTED
0
$0
4
$95,012
14
$161,360
1
$55,670
2
$62,590
3
$91,390
APPLICATIONS DENIED
0
$0
20
$140,272
59
$168,427
7
$96,449
5
$107,288
7
$137,363
APPLICATIONS WITHDRAWN
0
$0
7
$149,316
32
$166,883
3
$50,950
2
$100,560
5
$153,242
FILES CLOSED FOR INCOMPLETENESS
0
$0
1
$133,870
9
$172,771
1
$91,710
1
$167,980
0
$0
Aggregated Statistics For Year 2004 (Based on 2 partial tracts)
A) FHA, FSA/RHS & VA Home Purchase Loans
B) Conventional Home Purchase Loans
C) Refinancings
D) Home Improvement Loans
F) Non-occupant Loans on < 5 Family Dwellings (A B C & D)
G) Loans On Manufactured Home Dwelling (A B C & D)
Number
Average Value
Number
Average Value
Number
Average Value
Number
Average Value
Number
Average Value
Number
Average Value
LOANS ORIGINATED
4
$147,705
31
$162,499
62
$169,469
6
$32,287
4
$117,780
12
$153,257
APPLICATIONS APPROVED, NOT ACCEPTED
0
$0
5
$160,192
16
$164,822
0
$0
0
$0
2
$177,150
APPLICATIONS DENIED
2
$152,695
11
$151,509
56
$164,871
8
$72,405
1
$141,910
12
$137,784
APPLICATIONS WITHDRAWN
1
$151,570
3
$169,590
30
$165,073
1
$40,870
0
$0
3
$145,777
FILES CLOSED FOR INCOMPLETENESS
0
$0
1
$67,260
8
$163,716
1
$130,330
0
$0
1
$120,680
Aggregated Statistics For Year 2003 (Based on 2 partial tracts)
A) FHA, FSA/RHS & VA Home Purchase Loans
B) Conventional Home Purchase Loans
C) Refinancings
D) Home Improvement Loans
F) Non-occupant Loans on < 5 Family Dwellings (A B C & D)
Number
Average Value
Number
Average Value
Number
Average Value
Number
Average Value
Number
Average Value
LOANS ORIGINATED
5
$157,360
24
$158,044
92
$162,775
8
$40,588
2
$186,320
APPLICATIONS APPROVED, NOT ACCEPTED
0
$0
5
$207,496
15
$166,349
1
$19,310
2
$158,165
APPLICATIONS DENIED
1
$79,810
11
$132,933
57
$170,334
6
$21,990
3
$173,663
APPLICATIONS WITHDRAWN
1
$113,920
3
$168,623
18
$162,974
1
$14,480
2
$106,355
FILES CLOSED FOR INCOMPLETENESS
0
$0
1
$75,940
3
$214,963
0
$0
0
$0
Aggregated Statistics For Year 2002 (Based on 2 partial tracts)
A) FHA, FSA/RHS & VA Home Purchase Loans
B) Conventional Home Purchase Loans
C) Refinancings
D) Home Improvement Loans
F) Non-occupant Loans on < 5 Family Dwellings (A B C & D)
Number
Average Value
Number
Average Value
Number
Average Value
Number
Average Value
Number
Average Value
LOANS ORIGINATED
3
$125,717
13
$130,155
49
$156,027
5
$44,666
3
$134,940
APPLICATIONS APPROVED, NOT ACCEPTED
0
$0
5
$146,418
7
$161,221
0
$0
1
$28,640
APPLICATIONS DENIED
0
$0
7
$108,400
27
$143,952
3
$11,693
1
$90,100
APPLICATIONS WITHDRAWN
1
$86,240
3
$129,687
14
$147,316
1
$34,430
1
$167,660
FILES CLOSED FOR INCOMPLETENESS
0
$0
1
$144,810
3
$178,277
0
$0
0
$0
Aggregated Statistics For Year 2001 (Based on 2 partial tracts)
A) FHA, FSA/RHS & VA Home Purchase Loans
B) Conventional Home Purchase Loans
C) Refinancings
D) Home Improvement Loans
F) Non-occupant Loans on < 5 Family Dwellings (A B C & D)
Number
Average Value
Number
Average Value
Number
Average Value
Number
Average Value
Number
Average Value
LOANS ORIGINATED
2
$128,560
10
$124,955
32
$135,226
4
$17,378
2
$88,010
APPLICATIONS APPROVED, NOT ACCEPTED
0
$0
2
$43,120
5
$135,670
0
$0
0
$0
APPLICATIONS DENIED
0
$0
6
$112,468
14
$124,192
2
$17,540
0
$0
APPLICATIONS WITHDRAWN
0
$0
2
$114,560
9
$122,320
1
$186,320
0
$0
FILES CLOSED FOR INCOMPLETENESS
0
$0
0
$0
1
$160,900
0
$0
0
$0
Aggregated Statistics For Year 2000 (Based on 2 partial tracts)
A) FHA, FSA/RHS & VA Home Purchase Loans
B) Conventional Home Purchase Loans
C) Refinancings
D) Home Improvement Loans
F) Non-occupant Loans on < 5 Family Dwellings (A B C & D)
Number
Average Value
Number
Average Value
Number
Average Value
Number
Average Value
Number
Average Value
LOANS ORIGINATED
1
$159,610
9
$104,513
9
$135,692
5
$28,126
1
$80,450
APPLICATIONS APPROVED, NOT ACCEPTED
0
$0
3
$67,793
4
$130,893
2
$14,965
0
$0
APPLICATIONS DENIED
1
$81,740
6
$81,683
11
$79,163
4
$19,710
0
$0
APPLICATIONS WITHDRAWN
0
$0
1
$151,250
6
$121,640
0
$0
0
$0
FILES CLOSED FOR INCOMPLETENESS
0
$0
1
$65,970
2
$86,080
0
$0
0
$0
Aggregated Statistics For Year 1999 (Based on 1 partial tract)

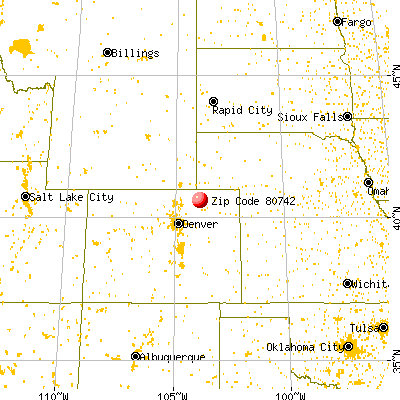


 Nearest zip codes: 80754, 80653, 80741, 80750, 80745, 80729.