Estimated zip code population in 2022: 22,313 Zip code population in 2010: 13,827 Zip code population in 2000: 9,222
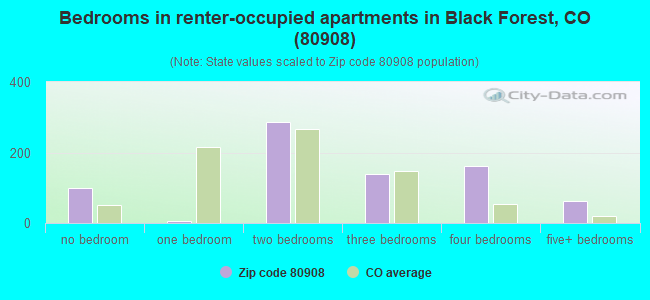
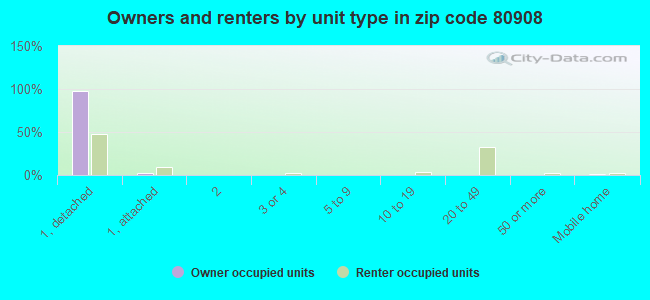
Houses and condos: 8,187 Renter-occupied apartments: 743
% of renters here:
9%
State:
34%
March 2022 cost of living index in zip code 80908: 95.0 (less than average, U.S. average is 100)
Land area: 95.4 sq. mi. Water area: 0.1 sq. mi.
Population density: 234 people per square mile
(very low).
OSM Map
General Map
Google Map
MSN Map
OSM Map
General Map
Google Map
MSN Map
OSM Map
General Map
Google Map
MSN Map
OSM Map
General Map
Google Map
MSN Map
Please wait while loading the map...
Real estate property taxes paid for housing units in 2022:
This zip code:
0.4% ($3,047)
Colorado:
0.5% ($2,422)
Median real estate property taxes paid for housing units with mortgages in 2022: $3,009 (0.4%) Median real estate property taxes paid for housing units with no mortgage in 2022: $3,177 (0.4%)
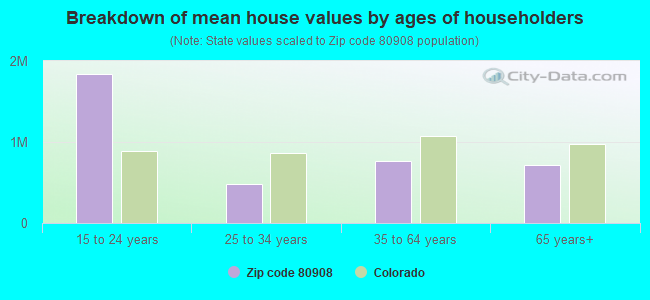
Estimated median house/condo value in 2022: $732,870
80908:
$732,870
Colorado:
$531,100
According to our research of Colorado and other state lists, there were 24 registered sex offenders living in 80908 zip code as of April 23, 2024. The ratio of all residents to sex offenders in zip code 80908 is 649 to 1. The ratio of registered sex offenders to all residents in this zip code is lower than the state average.
Median resident age:
This zip code:
40.0 years
Colorado median age:
37.7 years
Average household size:
This zip code:
2.8 people
Colorado:
2.4 people
Averages for the 2020 tax year for zip code 80908, filed in 2021:
Average Adjusted Gross Income (AGI) in 2020: $133,167 (Individual Income Tax Returns)
Here:
$133,167
State:
$89,260
Salary/wage: $96,791 (reported on 80.9% of returns)
Here:
$96,791
State:
$70,330
(% of AGI for various income ranges: 1151.5% for AGIs below $25k, 3392.5% for AGIs $25k-50k, 6230.9% for AGIs $50k-75k, 9056.4% for AGIs $75k-100k, 18759.0% for AGIs $100k-200k, 70457.8% for AGIs over 200k)
Taxable interest for individuals: $2,007 (reported on 52.1% of returns)
This zip code:
$2,007
Colorado:
$2,176
(% of AGI for various income ranges: 20.9% for AGIs below $25k, 60.8% for AGIs $25k-50k, 62.9% for AGIs $50k-75k, 89.3% for AGIs $75k-100k, 116.3% for AGIs $100k-200k, 1385.4% for AGIs over 200k)
Ordinary dividends: $5,968 (reported on 32.9% of returns)
Here:
$5,968
State:
$8,820
(% of AGI for various income ranges: 35.9% for AGIs below $25k, 82.2% for AGIs $25k-50k, 167.6% for AGIs $50k-75k, 178.5% for AGIs $75k-100k, 340.0% for AGIs $100k-200k, 2211.9% for AGIs over 200k)
Net capital gain/loss in AGI: +$29,241 (reported on 31.6% of returns)
Here:
+$29,241
State:
+$37,276
(% of AGI for various income ranges: 20.2% for AGIs below $25k, 151.9% for AGIs $25k-50k, 137.6% for AGIs $50k-75k, 230.6% for AGIs $75k-100k, 604.4% for AGIs $100k-200k, 16348.7% for AGIs over 200k)
Profit/loss from business: +$15,145 (reported on 18.9% of returns)
Here:
+$15,145
State:
+$15,295
(% of AGI for various income ranges: 93.2% for AGIs below $25k, 231.6% for AGIs $25k-50k, 227.1% for AGIs $50k-75k, 350.6% for AGIs $75k-100k, 552.0% for AGIs $100k-200k, 2576.1% for AGIs over 200k)
Taxable individual retirement arrangement distribution: $29,339 (reported on 12.6% of returns)
80908:
$29,339
Colorado:
$23,785
(% of AGI for various income ranges: 54.1% for AGIs below $25k, 193.2% for AGIs $25k-50k, 314.8% for AGIs $50k-75k, 564.7% for AGIs $75k-100k, 901.6% for AGIs $100k-200k, 2982.0% for AGIs over 200k)
Self-employed (Keogh) retirement plans: $22,800 (reported on 0.9% of returns)
80908:
$22,800
Colorado:
$23,633
(% of AGI for various income ranges: 33.6% for AGIs $100k-200k, 317.2% for AGIs over 200k)
Total itemized deductions: $38,915 (reported on 22.1% of returns)
Here:
$38,915
State:
$35,141
(% of AGI for various income ranges: 102.4% for AGIs below $25k, 266.7% for AGIs $25k-50k, 549.4% for AGIs $50k-75k, 926.2% for AGIs $75k-100k, 1779.4% for AGIs $100k-200k, 9272.6% for AGIs over 200k)
Charity contributions: $14,751 (reported on 19.0% of returns)
Here:
$14,751
State:
$12,103
(% of AGI for various income ranges: 5.5% for AGIs below $25k, 45.4% for AGIs $25k-50k, 78.8% for AGIs $50k-75k, 181.1% for AGIs $75k-100k, 426.1% for AGIs $100k-200k, 3999.4% for AGIs over 200k)
Taxes paid: $8,226 (reported on 22.1% of returns)
80908:
$8,226
State:
$7,710
(% of AGI for various income ranges: 10.3% for AGIs below $25k, 41.1% for AGIs $25k-50k, 110.0% for AGIs $50k-75k, 204.3% for AGIs $75k-100k, 474.9% for AGIs $100k-200k, 1719.4% for AGIs over 200k)
Earned income credit: $2,103 (reported on 6.4% of returns)
Here:
$2,103
State:
$2,053
(% of AGI for various income ranges: 45.9% for AGIs below $25k, 60.0% for AGIs $25k-50k)
Percentage of individuals using paid preparers for their 2020 taxes: 93.4%
Here:
93%
State:
93%
(% for various income ranges: 91.1% for AGIs below $25k, 93.2% for AGIs $25k-50k, 93.5% for AGIs $50k-75k, 94.4% for AGIs $75k-100k, 94.5% for AGIs $100k-200k, 94.1% for AGIs over 200k)
Averages for the 2012 tax year for zip code 80908, filed in 2013:
Average Adjusted Gross Income (AGI) in 2012: $101,362 (Individual Income Tax Returns)
Here:
$101,362
State:
$69,103
Salary/wage: $81,043 (reported on 82.0% of returns)
Here:
$81,043
State:
$54,794
(% of AGI for various income ranges: 74.4% for AGIs below $25k, 67.9% for AGIs $25k-50k, 66.0% for AGIs $50k-75k, 71.2% for AGIs $75k-100k, 72.8% for AGIs $100k-200k, 56.9% for AGIs over 200k)
Taxable interest for individuals: $1,811 (reported on 60.3% of returns)
This zip code:
$1,811
Colorado:
$1,971
(% of AGI for various income ranges: 2.0% for AGIs below $25k, 1.4% for AGIs $25k-50k, 0.9% for AGIs $50k-75k, 0.9% for AGIs $75k-100k, 0.8% for AGIs $100k-200k, 1.3% for AGIs over 200k)
Ordinary dividends: $4,857 (reported on 35.9% of returns)
Here:
$4,857
State:
$7,140
(% of AGI for various income ranges: 2.2% for AGIs below $25k, 1.7% for AGIs $25k-50k, 1.7% for AGIs $50k-75k, 1.7% for AGIs $75k-100k, 1.5% for AGIs $100k-200k, 1.9% for AGIs over 200k)
Net capital gain/loss in AGI: +$17,337 (reported on 32.3% of returns)
Here:
+$17,337
State:
+$23,009
(% of AGI for various income ranges: 0.2% for AGIs below $25k, 0.8% for AGIs $25k-50k, 2.0% for AGIs $50k-75k, 1.1% for AGIs $75k-100k, 1.6% for AGIs $100k-200k, 11.7% for AGIs over 200k)
Profit/loss from business: +$15,208 (reported on 21.1% of returns)
Here:
+$15,208
State:
+$13,514
(% of AGI for various income ranges: 7.7% for AGIs below $25k, 4.8% for AGIs $25k-50k, 4.4% for AGIs $50k-75k, 2.8% for AGIs $75k-100k, 2.4% for AGIs $100k-200k, 3.2% for AGIs over 200k)
Taxable individual retirement arrangement distribution: $20,889 (reported on 12.7% of returns)
80908:
$20,889
Colorado:
$17,927
(% of AGI for various income ranges: 5.3% for AGIs below $25k, 4.0% for AGIs $25k-50k, 3.2% for AGIs $50k-75k, 3.4% for AGIs $75k-100k, 2.9% for AGIs $100k-200k, 1.7% for AGIs over 200k)
Self-employment retirement plans: $17,111 (reported on 1.4% of returns)
80908:
$17,111
Colorado:
$19,483
(% of AGI for various income ranges: 0.6% for AGIs $25k-50k, 0.2% for AGIs $100k-200k, 0.3% for AGIs over 200k)
Total itemized deductions: $30,023 (20% of AGI, reported on 54.8% of returns)
Here:
$30,023
State:
$24,621
Here:
19.7% of AGI
State:
18.5% of AGI
(% of AGI for various income ranges: 18.5% for AGIs below $25k, 18.7% for AGIs $25k-50k, 18.6% for AGIs $50k-75k, 18.6% for AGIs $75k-100k, 17.2% for AGIs $100k-200k, 13.9% for AGIs over 200k)
Charity contributions: $6,483 (reported on 48.6% of returns)
Here:
$6,483
State:
$4,449
(% of AGI for various income ranges: 1.3% for AGIs below $25k, 2.7% for AGIs $25k-50k, 2.6% for AGIs $50k-75k, 3.0% for AGIs $75k-100k, 2.8% for AGIs $100k-200k, 3.7% for AGIs over 200k)
Taxes paid: $8,674 (reported on 54.4% of returns)
80908:
$8,674
State:
$7,641
(% of AGI for various income ranges: 2.5% for AGIs below $25k, 3.2% for AGIs $25k-50k, 3.9% for AGIs $50k-75k, 4.4% for AGIs $75k-100k, 5.1% for AGIs $100k-200k, 4.8% for AGIs over 200k)
Earned income credit: $1,713 (reported on 6.8% of returns)
Here:
$1,713
State:
$2,095
(% of AGI for various income ranges: 2.9% for AGIs below $25k, 0.8% for AGIs $25k-50k)
Percentage of individuals using paid preparers for their 2012 taxes: 48.3%
Here:
48%
State:
49%
(% for various income ranges: 37.1% for AGIs below $25k, 48.3% for AGIs $25k-50k, 49.4% for AGIs $50k-75k, 51.2% for AGIs $75k-100k, 50.6% for AGIs $100k-200k, 66.7% for AGIs over 200k)
Averages for the 2004 tax year for zip code 80908, filed in 2005:
Average Adjusted Gross Income (AGI) in 2004: $79,861 (Individual Income Tax Returns)
Here:
$79,861
State:
$55,014
Salary/wage: $64,645 (reported on 82.5% of returns)
Here:
$64,645
State:
$46,010
(% of AGI for various income ranges: 168.7% for AGIs below $10k, 69.5% for AGIs $10k-25k, 65.5% for AGIs $25k-50k, 70.9% for AGIs $50k-75k, 81.4% for AGIs $75k-100k, 62.2% for AGIs over 100k)
Taxable interest for individuals: $1,935 (reported on 67.3% of returns)
This zip code:
$1,935
Colorado:
$2,127
(% of AGI for various income ranges: 10.9% for AGIs below $10k, 2.7% for AGIs $10k-25k, 2.6% for AGIs $25k-50k, 1.8% for AGIs $50k-75k, 0.8% for AGIs $75k-100k, 1.5% for AGIs over 100k)
Taxable dividends: $3,259 (reported on 43.1% of returns)
Here:
$3,259
State:
$3,782
(% of AGI for various income ranges: 7.9% for AGIs below $10k, 2.6% for AGIs $10k-25k, 2.0% for AGIs $25k-50k, 1.8% for AGIs $50k-75k, 1.0% for AGIs $75k-100k, 1.8% for AGIs over 100k)
Net capital gain/loss: +$15,703 (reported on 38.8% of returns)
Here:
+$15,703
State:
+$17,882
(% of AGI for various income ranges: -2.9% for AGIs below $10k, 1.6% for AGIs $10k-25k, 1.1% for AGIs $25k-50k, 1.7% for AGIs $50k-75k, 0.9% for AGIs $75k-100k, 11.0% for AGIs over 100k)
Profit/loss from business: +$12,847 (reported on 23.7% of returns)
Here:
+$12,847
State:
+$11,247
(% of AGI for various income ranges: 17.8% for AGIs below $10k, 6.5% for AGIs $10k-25k, 7.7% for AGIs $25k-50k, 5.3% for AGIs $50k-75k, 3.8% for AGIs $75k-100k, 2.9% for AGIs over 100k)
IRA payment deduction: $3,253 (reported on 4.3% of returns)
80908:
$3,253
Colorado:
$2,947
(% of AGI for various income ranges: 0.5% for AGIs $10k-25k, 0.4% for AGIs $25k-50k, 0.3% for AGIs $50k-75k, 0.3% for AGIs $75k-100k, 0.1% for AGIs over 100k)
Self-employed pension: $11,794 (reported on 2.0% of returns)
Here:
$11,794
Colorado:
$13,653
(% of AGI for various income ranges: 0.3% for AGIs $25k-50k, 0.2% for AGIs $50k-75k, 0.2% for AGIs $75k-100k, 0.3% for AGIs over 100k)
Total itemized deductions: $25,300 (21% of AGI, reported on 58.8% of returns)
Here:
$25,300
State:
$20,560
Here:
21.4% of AGI
State:
21.4% of AGI
(% of AGI for various income ranges: 36.4% for AGIs below $10k, 24.0% for AGIs $10k-25k, 24.7% for AGIs $25k-50k, 23.1% for AGIs $50k-75k, 21.2% for AGIs $75k-100k, 16.4% for AGIs over 100k)
Charity contributions deductions: $5,427 (4% of AGI, reported on 54.0% of returns)
Here:
$5,427
State:
$3,518
Here:
4.4% of AGI
State:
3.4% of AGI
(% of AGI for various income ranges: 1.5% for AGIs below $10k, 2.1% for AGIs $10k-25k, 3.1% for AGIs $25k-50k, 2.9% for AGIs $50k-75k, 3.1% for AGIs $75k-100k, 4.0% for AGIs over 100k)
Total tax: $13,612 (reported on 82.4% of returns)
80908:
$13,612
State:
$9,173
(% of AGI for various income ranges: 5.8% for AGIs below $10k, 4.9% for AGIs $10k-25k, 6.9% for AGIs $25k-50k, 8.2% for AGIs $50k-75k, 9.6% for AGIs $75k-100k, 17.1% for AGIs over 100k)
Earned income credit: $1,494 (reported on 5.2% of returns)
Here:
$1,494
State:
$1,595
Percentage of individuals using paid preparers for their 2004 taxes: 51.3%
Here:
51%
State:
55%
(% for various income ranges: 41.4% for AGIs below $10k, 48.0% for AGIs $10k-25k, 56.9% for AGIs $25k-50k, 57.7% for AGIs $50k-75k, 48.1% for AGIs $75k-100k, 55.3% for AGIs over 100k)
Likely homosexual households (counted as self-reported same-sex unmarried-partner households)
Lesbian couples: 0.1% of all households
Gay men: 0.0% of all households
Household received Food Stamps/SNAP in the past 12 months: 212 Household did not receive Food Stamps/SNAP in the past 12 months: 7,742
Women who had a birth in the past 12 months: 165 (149 now married, 18 unmarried) Women who did not have a birth in the past 12 months: 4,625 (2,662 now married, 1,945 unmarried)
Housing units in zip code 80908 with a mortgage: 4,926 (493 second mortgage, 399 both second mortgage and home equity loan) Houses without a mortgage: 29
Median monthly owner costs for units with a mortgage: $2,486 Median monthly owner costs for units without a mortgage: $720
Residents with income below the poverty level in 2022:
This zip code:
3.3%
Whole state:
9.4%
Residents with income below 50% of the poverty level in 2022:
This zip code:
0.7%
Whole state:
4.6%
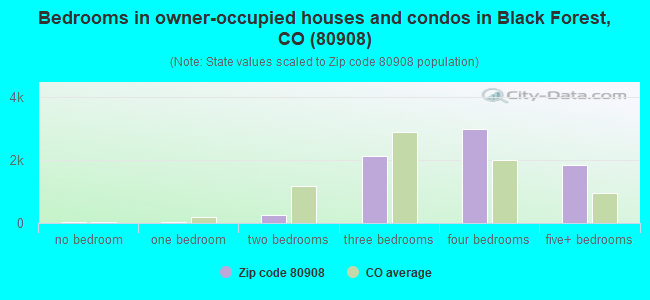
Median number of rooms in houses and condos:
Here:
8.1
State:
6.8
Median number of rooms in apartments:
Here:
4.6
State:
4.0
Notable locations in this zip code not listed on our city pages
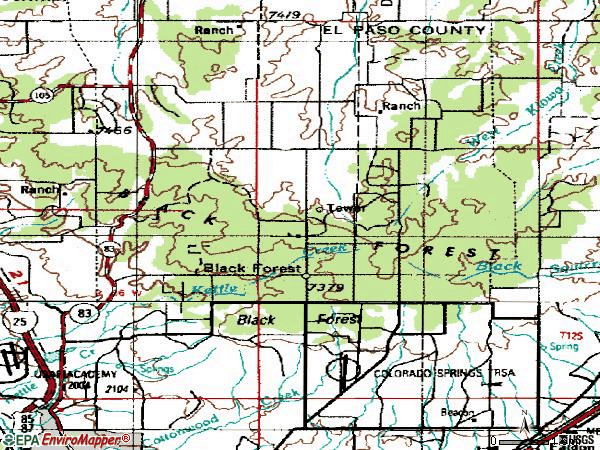
Notable locations in zip code 80908: Hyatt Ranch (A), Reverse J Diamond Ranch (B), Pine Cone Ranch (C), Old Bar X Ranch (D), Brentwood Country Club (E), Bridle Bit Ranch (F), Falcon Fire Department Station 2 (G), Black Forest Fire / Rescue Protection District Station 2 (H), Black Forest Fire / Rescue Protection District Station 1 (I). Display/hide their locations on the map
In group quarters: 27 (-1 institutionalized population)
Size of family households: 2,742 2-persons, 1,354 3-persons, 1,162 4-persons, 753 5-persons, 185 6-persons, 135 7-or-more-persons
Size of nonfamily households: 1,294 1-person, 243 2-persons, 22 3-persons
4,612 married couples with children.
824 single-parent households (173 men, 651 women).
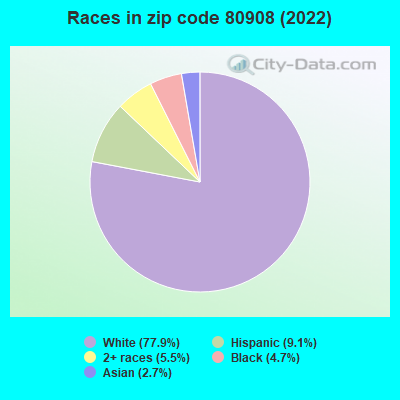
93.6% of residents of 80908 zip code speak English at home.
2.8% of residents speak Spanish at home (91% very well, 9% well).
2.2% of residents speak other Indo-European language at home (86% very well, 14% well).
0.8% of residents speak Asian or Pacific Island language at home (40% very well, 60% well).
0.5% of residents speak other language at home (59% very well, 41% well).
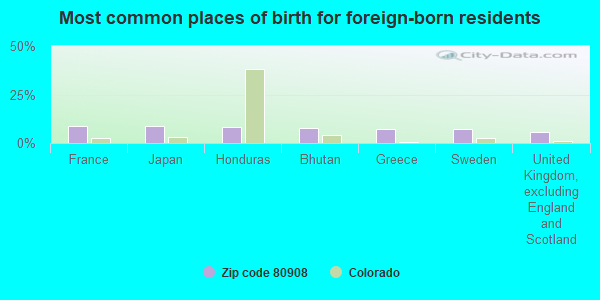
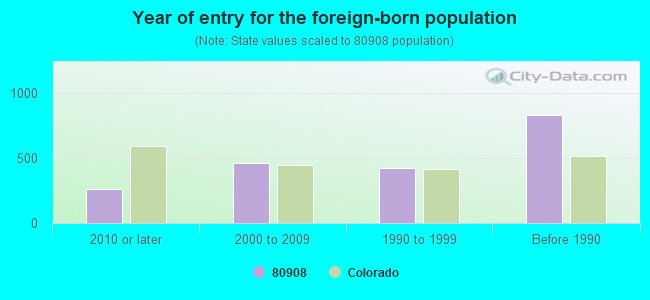
Foreign born population: 1,394 (6.2%) (73.8% of them are naturalized citizens)
Facilities with environmental interests located in this zip code:
C&C EXCAVATION (CAROL EDWARDS) (8670 KENOSHA DR in COLORADO SPRINGS, CO)
AIR MINOR (AIRS/AFS) Business SIC classification: EXCAVATION WORK Alternative names: C & C EXCAVATION
BLACK FOREST HEATING (11410 HOLMES ROAD in BLACK FOREST, CO)
ENFORCEMENT/COMPLIANCE ACTIVITY (Integrated Compliance Information System)
Housing units lacking complete plumbing facilities: 0.1% Housing units lacking complete kitchen facilities: 0.3%
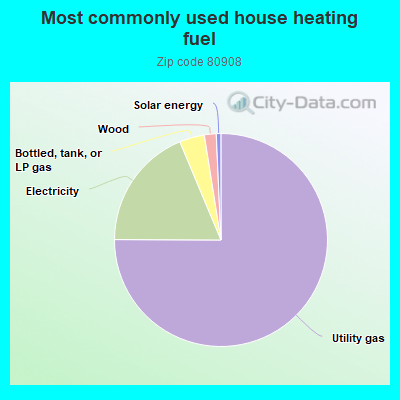
75.0%Utility gas
18.6%Electricity
3.8%Bottled, tank, or LP gas
1.8%Wood
0.7%Solar energy
Population in 1990: 6,803. Population change in the 1990s: +2,419 (+35.6%).
Place of birth for U.S.-born residents:
This state: 6,728
Northeast: 1,832
Midwest: 4,344
South: 2,907
West: 4,480
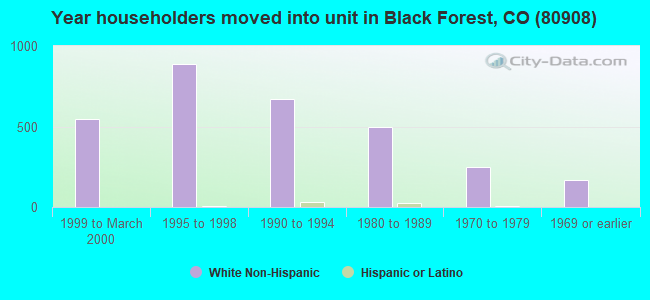
56% of the 80908 zip code residents lived in the same house 5 years ago. Out of people who lived in different houses, 55% lived in this county. Out of people who lived in different counties, 50% lived in Colorado.
89% of the 80908 zip code residents lived in the same house 1 year ago. Out of people who lived in different houses, 56% moved from this county. Out of people who lived in different houses, 18% moved from different county within same state. Out of people who lived in different houses, 23% moved from different state. Out of people who lived in different houses, 3% moved from abroad.
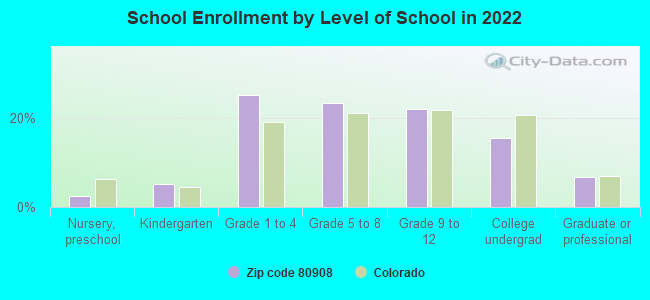
Private vs. public school enrollment:
Students in private schools in grades 1 to 8 (elementary and middle school): 585
Here:
19.1%
Colorado:
11.4%
Students in private schools in grades 9 to 12 (high school): 194
Here:
14.1%
Colorado:
8.5%
Students in private undergraduate colleges: 120
Here:
12.4%
Colorado:
14.0%
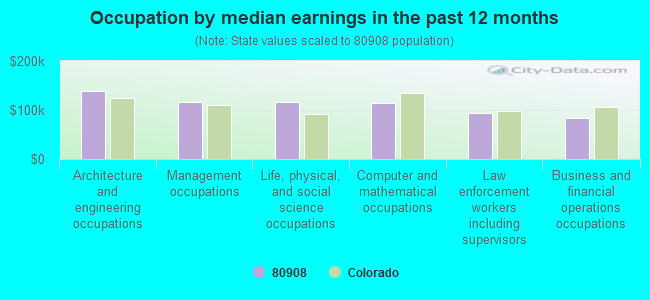
Occupation by median earnings in the past 12 months ($)
139,481Architecture and engineering occupations
116,269Management occupations
116,046Life, physical, and social science occupations
114,885Computer and mathematical occupations
94,275Law enforcement workers including supervisors
84,497Business and financial operations occupations
Companies with federal contracts located in this zip code:
ELECTROMAGNITIC TECHNIQUES INC (20340 PINE SHADOW DRIVE in COLORADO SPRIN, CO; small business) : $673,999 in 5 contractsfrom 2000 to 2005
Contracts for Engineering -- Basic Research (R&D), Other Transportation Travel and Relocation Services, Educational Services, Other Special Studies and Analyses, and moreby Air Force Signed by year:2000: $420,000; 2001: $0; 2002: $0; 2003: $100,000; 2004: $94,999; 2005: $59,000; 2006: $0.
Biggest contracts:
$420,000 with Air Force for Engineering -- Basic Research (R&D). Signed on 2000-01-31. Completion date: 2001-04-30.
$100,000 with Air Force for Other Transportation Travel and Relocation Services. Signed on 2003-05-29. Completion date: 2004-05-31.
$59,000 with Air Force for Educational Services. Signed on 2005-07-22. Completion date: 2006-07-24.
$49,999 with Air Force for Other Special Studies and Analyses. Signed on 2004-08-17. Completion date: 2005-08-19.
AMATEK, INC (6920 SILVER PONDS in COLORADO SPRIN, CO; small business) : $314,066 in 5 contractsfrom 2004 to 2005
Contracts for Intercommunication and Public Address Systems, Airborne, Telecommunications Network Management Services, Batteries, Rechargeable by Air Force, Geological Survey, Navy, Army, and others Signed by year:2000: $0; 2001: $0; 2002: $0; 2003: $0; 2004: $56,408; 2005: $257,658; 2006: $0.
Biggest contracts:
$251,820 with Air Force for Intercommunication and Public Address Systems, Airborne. Signed on 2005-04-29. Completion date: 2005-07-31.
$33,800 with Geological Survey for Telecommunications Network Management Services. Signed on 2004-05-26. Completion date: 2004-06-30.
$17,386 with Navy for Batteries, Rechargeable. Signed on 2004-10-04. Completion date: 2005-09-29.
$5,838 with Army for Batteries, Rechargeable. Signed on 2005-02-11. Completion date: 2005-02-16.
JACK D JONES (9560 THOROUGHBRED LN in COLORADO SPRIN, CO; small business) : $135,850 in 5 contractsfrom 2000 to 2004
Contracts for Maintenance, Repair and Rebuilding of Equipment -- Prefabricated Structures and Scaffolding, Maintenance, Repair or Alteration of Real Property -- Office Buildings by Air Force Signed by year:2000: $39,950; 2001: $39,950; 2002: $39,950; 2003: $0; 2004: $16,000; 2005: $0; 2006: $0.
Biggest contracts:
$39,950 with Air Force for Maintenance, Repair and Rebuilding of Equipment -- Prefabricated Structures and Scaffolding. Signed on 2002-10-01. Completion date: 2003-09-30.
$39,950, same as above.Signed on 2001-10-01. Completion date: 2002-09-30.
$39,950, same as above.Signed on 2000-10-02. Completion date: 2001-09-30.
$16,000 with Air Force for Maintenance, Repair or Alteration of Real Property -- Office Buildings. Signed on 2004-09-27. Completion date: 2004-10-29.
INTELLIVISUAL LLC (15855 WILDWIND TERRACE in BLACK FOREST, CO; small business) : $99,862 in 2 contractsin 2003
$249,862 with Army for Other Defense -- Operational Systems Development (R&D). Signed on 2003-05-29. Completion date: 2004-03-29.
-$150,000, same as above.Signed on 2003-06-12. Completion date: 2004-03-29.
RAU-SOBOTKA, CYNTHIA K (15385 BLACK FOREST RD in COLORADO SPRIN, CO; small business) : $94,992 in 2 contractsin 2005
$94,992 with Army for Nursing Services. Signed on 2005-10-05. Completion date: 2006-09-30.
$0, same as above.Signed on 2005-10-05. Completion date: 2006-09-30.
KEY MANAGEMENT SYSTEMS INC (14960 WEST KIOWA CREEK LN in COLORADO SPRIN, CO; small business)
$72,495 with Navy for ADP Support Equipment. Signed on 2006-06-22. Completion date: 2006-07-05.
SIGN SHOP LIMITED (3505 EAST PLATTE AVE in COLORADO SPRIN, CO; small business)
$34,013 with Air Force for Miscellaneous Items. Signed on 2003-09-02. Completion date: 2003-10-08.
JANE YATES YAWS (14405 PINE GLEN DRIVE WEST in COLORADO SPRIN, CO; small business)
$32,000 with Army for Other Medical Services. Signed on 1999-10-29. Completion date: 2000-05-30.
FREDERICK R LANG (10315 BURGESS RD in COLORADO SPRIN, CO; small business) : $5,490 in 2 contractsfrom 2004 to 2005
$6,110 with Air Force for Chaplain Services. Signed on 2004-10-01. Completion date: 2005-09-30.
-$620, same as above.Signed on 2005-07-01. Completion date: 2002-09-30.
COLORADO BARNS (9390 HARDIN ROAD in COLORADO SPRIN, CO; small business)
$3,675 with Army for Prefabricated and Portable Buildings. Signed on 2003-03-11. Completion date: 2003-04-30.
Top industries in this zip code by the number of employees in 2005:
Other Services (except Public Administration): Religious Organizations (20-49 employees: 1 establishment, 10-19 employees: 4 establishments, 5-9 employees: 2 establishments, 1-4 employees: 3 establishments)
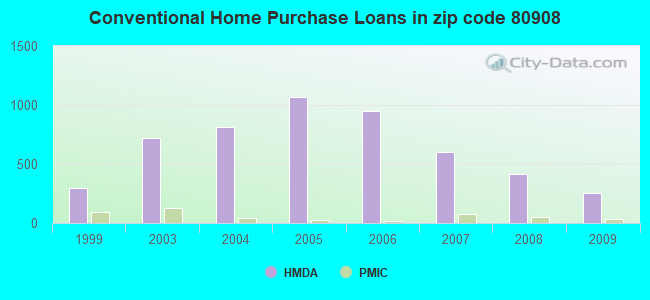
Detailed PMIC statistics for the following Tracts:0075.00
, 0076.00
2003 - 2018 National Fire Incident Reporting System (NFIRS) incidents
Based on the data from the years 2003 - 2018 the average number of fire incidents per year is 59. The highest number of reported fire incidents - 122 took place in 2011, and the least - 26 in 2018. The data has a decreasing trend.
When looking into fire subcategories, the most incidents belonged to: Outside Fires (46.3%), and Structure Fires (42.3%).
Fire incident types reported to NFIRS in Zip Code 80908

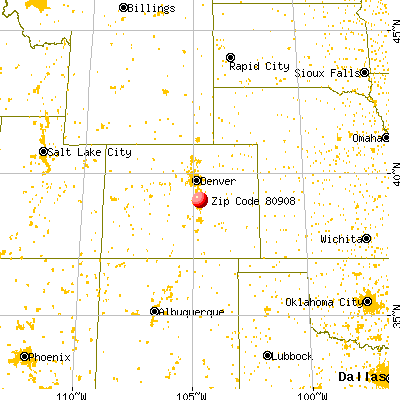


 Nearest zip codes: 80924, 80920, 80923, 80927, 80938, 80922.
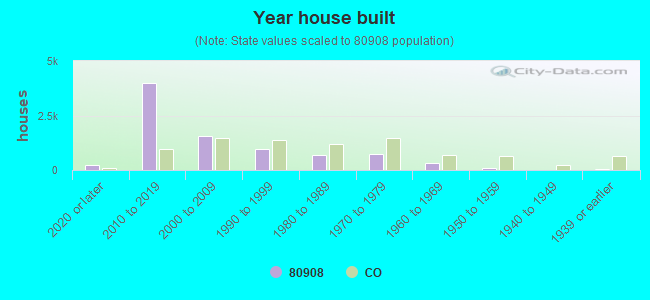


 Based on the data from the years 2003 - 2018 the average number of fire incidents per year is 59. The highest number of reported fire incidents - 122 took place in 2011, and the least - 26 in 2018. The data has a decreasing trend.
 When looking into fire subcategories, the most incidents belonged to: Outside Fires (46.3%), and Structure Fires (42.3%).