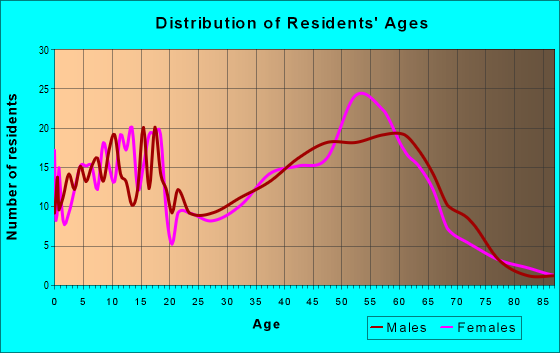
Estimated zip code population in 2022: 2,642 Zip code population in 2010: 2,193 Zip code population in 2000: 1,875
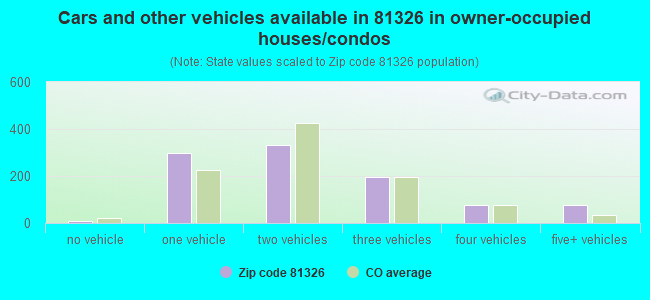
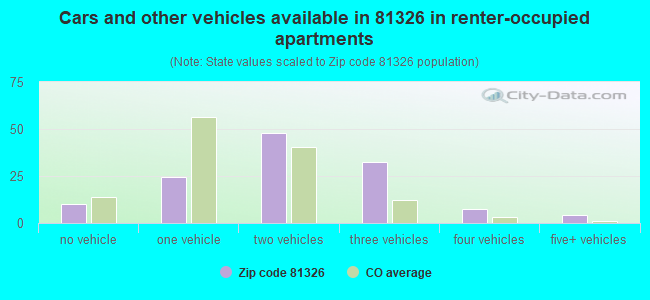
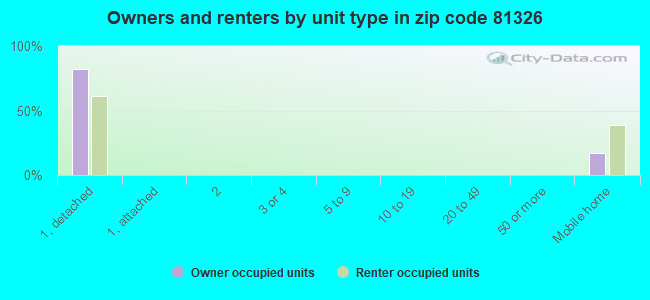
Houses and condos: 1,397 Renter-occupied apartments: 125
% of renters here:
11%
State:
34%
March 2022 cost of living index in zip code 81326: 95.6 (near average, U.S. average is 100)
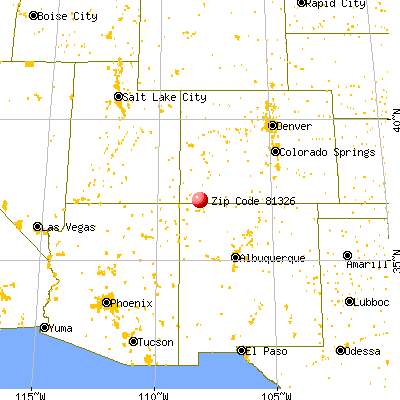
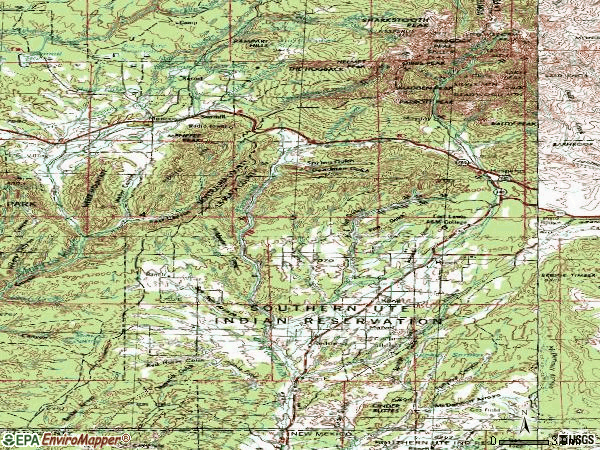
Land area: 250.1 sq. mi. Water area: 0.1 sq. mi.
Population density: 11 people per square mile
(very low).
OSM Map
General Map
Google Map
MSN Map
OSM Map
General Map
Google Map
MSN Map
OSM Map
General Map
Google Map
MSN Map
OSM Map
General Map
Google Map
MSN Map
Please wait while loading the map...
Real estate property taxes paid for housing units in 2022:
This zip code:
0.2% ($1,273)
Colorado:
0.5% ($2,422)
Median real estate property taxes paid for housing units with mortgages in 2022: $1,351 (0.3%) Median real estate property taxes paid for housing units with no mortgage in 2022: $1,107 (0.2%)
Averages for the 2020 tax year for zip code 81326, filed in 2021:
Average Adjusted Gross Income (AGI) in 2020: $81,700 (Individual Income Tax Returns)
Here:
$81,700
State:
$89,260
Salary/wage: $58,433 (reported on 74.5% of returns)
Here:
$58,433
State:
$70,330
(% of AGI for various income ranges: 1314.3% for AGIs below $25k, 3627.2% for AGIs $25k-50k, 6098.0% for AGIs $50k-75k, 10710.0% for AGIs $75k-100k, 12283.0% for AGIs $100k-200k)
Taxable interest for individuals: $1,759 (reported on 38.7% of returns)
This zip code:
$1,759
Colorado:
$2,176
(% of AGI for various income ranges: 15.2% for AGIs below $25k, 25.6% for AGIs $25k-50k, 26.0% for AGIs $50k-75k, 52.0% for AGIs $75k-100k, 297.0% for AGIs $100k-200k)
Ordinary dividends: $9,227 (reported on 24.5% of returns)
Here:
$9,227
State:
$8,820
(% of AGI for various income ranges: 40.5% for AGIs below $25k, 80.6% for AGIs $25k-50k, 200.0% for AGIs $50k-75k, 370.0% for AGIs $75k-100k, 789.0% for AGIs $100k-200k)
Net capital gain/loss in AGI: +$35,188 (reported on 23.6% of returns)
Here:
+$35,188
State:
+$37,276
(% of AGI for various income ranges: 30.0% for AGIs below $25k, 47.8% for AGIs $25k-50k, 182.0% for AGIs $50k-75k, 266.0% for AGIs $75k-100k, 1384.0% for AGIs $100k-200k)
Profit/loss from business: +$14,680 (reported on 23.6% of returns)
Here:
+$14,680
State:
+$15,295
(% of AGI for various income ranges: 161.9% for AGIs below $25k, 357.2% for AGIs $25k-50k, 854.0% for AGIs $50k-75k, 984.0% for AGIs $75k-100k, 680.0% for AGIs $100k-200k)
Taxable individual retirement arrangement distribution: $31,038 (reported on 12.3% of returns)
81326:
$31,038
Colorado:
$23,785
(% of AGI for various income ranges: 153.3% for AGIs below $25k, 627.0% for AGIs $50k-75k, 3086.0% for AGIs $100k-200k)
Total itemized deductions: $30,855 (reported on 10.4% of returns)
Here:
$30,855
State:
$35,141
(% of AGI for various income ranges: 989.0% for AGIs $50k-75k, 924.0% for AGIs $100k-200k)
Charity contributions: $10,257 (reported on 6.6% of returns)
Here:
$10,257
State:
$12,103
(% of AGI for various income ranges: 61.0% for AGIs $50k-75k, 237.0% for AGIs $100k-200k)
Taxes paid: $6,455 (reported on 10.4% of returns)
81326:
$6,455
State:
$7,710
(% of AGI for various income ranges: 189.0% for AGIs $50k-75k, 185.0% for AGIs $100k-200k)
Earned income credit: $2,060 (reported on 14.2% of returns)
Here:
$2,060
State:
$2,053
(% of AGI for various income ranges: 98.6% for AGIs below $25k, 56.7% for AGIs $25k-50k)
Percentage of individuals using paid preparers for their 2020 taxes: 93.4%
Here:
93%
State:
93%
(% for various income ranges: 90.6% for AGIs below $25k, 92.0% for AGIs $25k-50k, 93.8% for AGIs $50k-75k, 90.0% for AGIs $75k-100k, 100.0% for AGIs $100k-200k, 100.0% for AGIs over 200k)
Averages for the 2012 tax year for zip code 81326, filed in 2013:
Average Adjusted Gross Income (AGI) in 2012: $70,653 (Individual Income Tax Returns)
Here:
$70,653
State:
$69,103
Salary/wage: $53,319 (reported on 80.4% of returns)
Here:
$53,319
State:
$54,794
(% of AGI for various income ranges: 67.5% for AGIs below $25k, 77.7% for AGIs $25k-50k, 70.0% for AGIs $50k-75k, 76.2% for AGIs $75k-100k, 67.9% for AGIs $100k-200k, 37.4% for AGIs over 200k)
Taxable interest for individuals: $1,714 (reported on 40.2% of returns)
This zip code:
$1,714
Colorado:
$1,971
(% of AGI for various income ranges: 1.0% for AGIs below $25k, 0.3% for AGIs $25k-50k, 1.4% for AGIs $50k-75k, 0.9% for AGIs $75k-100k, 0.8% for AGIs $100k-200k, 1.2% for AGIs over 200k)
Ordinary dividends: $8,330 (reported on 25.0% of returns)
Here:
$8,330
State:
$7,140
(% of AGI for various income ranges: 1.6% for AGIs below $25k, 1.0% for AGIs $25k-50k, 2.3% for AGIs $50k-75k, 1.2% for AGIs $75k-100k, 1.6% for AGIs $100k-200k, 5.9% for AGIs over 200k)
Net capital gain/loss in AGI: +$9,905 (reported on 22.8% of returns)
Here:
+$9,905
State:
+$23,009
(% of AGI for various income ranges: 1.0% for AGIs below $25k, 0.2% for AGIs $25k-50k, 2.5% for AGIs $50k-75k, 1.4% for AGIs $75k-100k, 2.2% for AGIs $100k-200k, 6.5% for AGIs over 200k)
Profit/loss from business: +$14,646 (reported on 28.3% of returns)
Here:
+$14,646
State:
+$13,514
(% of AGI for various income ranges: 14.2% for AGIs below $25k, 7.3% for AGIs $25k-50k, 4.2% for AGIs $50k-75k, 4.8% for AGIs $75k-100k, 12.1% for AGIs $100k-200k)
Taxable individual retirement arrangement distribution: $34,833 (reported on 9.8% of returns)
81326:
$34,833
Colorado:
$17,927
(% of AGI for various income ranges: 6.9% for AGIs below $25k, 5.4% for AGIs $50k-75k, 14.4% for AGIs $100k-200k)
Total itemized deductions: $25,661 (21% of AGI, reported on 39.1% of returns)
Here:
$25,661
State:
$24,621
Here:
20.9% of AGI
State:
18.5% of AGI
(% of AGI for various income ranges: 14.3% for AGIs below $25k, 14.5% for AGIs $25k-50k, 13.5% for AGIs $50k-75k, 13.1% for AGIs $75k-100k, 14.9% for AGIs $100k-200k, 14.3% for AGIs over 200k)
Charity contributions: $5,041 (reported on 29.3% of returns)
Here:
$5,041
State:
$4,449
(% of AGI for various income ranges: 2.7% for AGIs $25k-50k, 1.9% for AGIs $50k-75k, 2.1% for AGIs $75k-100k, 2.6% for AGIs $100k-200k, 1.9% for AGIs over 200k)
Taxes paid: $7,364 (reported on 39.1% of returns)
81326:
$7,364
State:
$7,641
(% of AGI for various income ranges: 1.4% for AGIs below $25k, 1.8% for AGIs $25k-50k, 2.4% for AGIs $50k-75k, 2.9% for AGIs $75k-100k, 4.6% for AGIs $100k-200k, 6.2% for AGIs over 200k)
Earned income credit: $2,142 (reported on 13.0% of returns)
Here:
$2,142
State:
$2,095
(% of AGI for various income ranges: 5.2% for AGIs below $25k, 1.0% for AGIs $25k-50k)
Percentage of individuals using paid preparers for their 2012 taxes: 55.4%
Here:
55%
State:
49%
(% for various income ranges: 48.4% for AGIs below $25k, 52.4% for AGIs $25k-50k, 56.2% for AGIs $50k-75k, 62.5% for AGIs $75k-100k, 58.3% for AGIs $100k-200k, 100.0% for AGIs over 200k)
Averages for the 2004 tax year for zip code 81326, filed in 2005:
Average Adjusted Gross Income (AGI) in 2004: $54,008 (Individual Income Tax Returns)
Here:
$54,008
State:
$55,014
Salary/wage: $40,328 (reported on 82.7% of returns)
Here:
$40,328
State:
$46,010
(% of AGI for various income ranges: 335.7% for AGIs below $10k, 72.2% for AGIs $10k-25k, 80.9% for AGIs $25k-50k, 74.2% for AGIs $50k-75k, 82.7% for AGIs $75k-100k, 40.2% for AGIs over 100k)
Taxable interest for individuals: $1,465 (reported on 44.8% of returns)
This zip code:
$1,465
Colorado:
$2,127
(% of AGI for various income ranges: 23.5% for AGIs below $10k, 2.1% for AGIs $10k-25k, 1.2% for AGIs $25k-50k, 0.7% for AGIs $50k-75k, 0.9% for AGIs $75k-100k, 1.1% for AGIs over 100k)
Taxable dividends: $3,769 (reported on 30.7% of returns)
Here:
$3,769
State:
$3,782
(% of AGI for various income ranges: 8.1% for AGIs below $10k, 2.5% for AGIs $10k-25k, 1.6% for AGIs $25k-50k, 0.9% for AGIs $50k-75k, 0.6% for AGIs $75k-100k, 3.1% for AGIs over 100k)
Net capital gain/loss: +$22,508 (reported on 29.9% of returns)
Here:
+$22,508
State:
+$17,882
(% of AGI for various income ranges: -12.7% for AGIs below $10k, 0.3% for AGIs $10k-25k, 0.2% for AGIs $25k-50k, 3.5% for AGIs $50k-75k, 1.7% for AGIs $75k-100k, 25.1% for AGIs over 100k)
Profit/loss from business: +$14,124 (reported on 28.1% of returns)
Here:
+$14,124
State:
+$11,247
(% of AGI for various income ranges: 54.3% for AGIs below $10k, 11.8% for AGIs $10k-25k, 11.5% for AGIs $25k-50k, 7.9% for AGIs $50k-75k, 3.6% for AGIs $75k-100k, 5.4% for AGIs over 100k)
IRA payment deduction: $3,448 (reported on 3.5% of returns)
81326:
$3,448
Colorado:
$2,947
Total itemized deductions: $20,393 (21% of AGI, reported on 39.9% of returns)
Here:
$20,393
State:
$20,560
Here:
20.8% of AGI
State:
21.4% of AGI
(% of AGI for various income ranges: 18.4% for AGIs $10k-25k, 13.5% for AGIs $25k-50k, 17.3% for AGIs $50k-75k, 16.7% for AGIs $75k-100k, 14.1% for AGIs over 100k)
Charity contributions deductions: $4,787 (4% of AGI, reported on 32.2% of returns)
Here:
$4,787
State:
$3,518
Here:
4.5% of AGI
State:
3.4% of AGI
(% of AGI for various income ranges: 1.0% for AGIs $10k-25k, 1.6% for AGIs $25k-50k, 2.8% for AGIs $50k-75k, 2.6% for AGIs $75k-100k, 3.7% for AGIs over 100k)
Total tax: $8,931 (reported on 77.0% of returns)
81326:
$8,931
State:
$9,173
(% of AGI for various income ranges: 11.8% for AGIs below $10k, 5.5% for AGIs $10k-25k, 7.2% for AGIs $25k-50k, 8.9% for AGIs $50k-75k, 10.3% for AGIs $75k-100k, 17.9% for AGIs over 100k)
Earned income credit: $1,634 (reported on 13.5% of returns)
Here:
$1,634
State:
$1,595
Percentage of individuals using paid preparers for their 2004 taxes: 60.2%
Here:
60%
State:
55%
(% for various income ranges: 52.6% for AGIs below $10k, 54.9% for AGIs $10k-25k, 62.1% for AGIs $25k-50k, 64.6% for AGIs $50k-75k, 57.6% for AGIs $75k-100k, 75.6% for AGIs over 100k)
Likely homosexual households (counted as self-reported same-sex unmarried-partner households)
Lesbian couples: 0.2% of all households
Gay men: 0.0% of all households
Household received Food Stamps/SNAP in the past 12 months: 44 Household did not receive Food Stamps/SNAP in the past 12 months: 1,055
Women who had a birth in the past 12 months: 64 (55 now married, 10 unmarried) Women who did not have a birth in the past 12 months: 463 (215 now married, 247 unmarried)
Housing units in zip code 81326 with a mortgage: 524 (46 second mortgage, 49 both second mortgage and home equity loan) Houses without a mortgage: 21
Median monthly owner costs for units with a mortgage: $1,850 Median monthly owner costs for units without a mortgage: $339
Residents with income below the poverty level in 2022:
This zip code:
5.8%
Whole state:
9.4%
Residents with income below 50% of the poverty level in 2022:
This zip code:
4.6%
Whole state:
4.6%
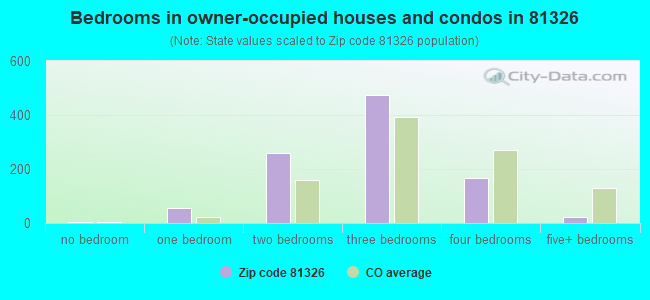
Median number of rooms in houses and condos:
Here:
5.8
State:
6.8
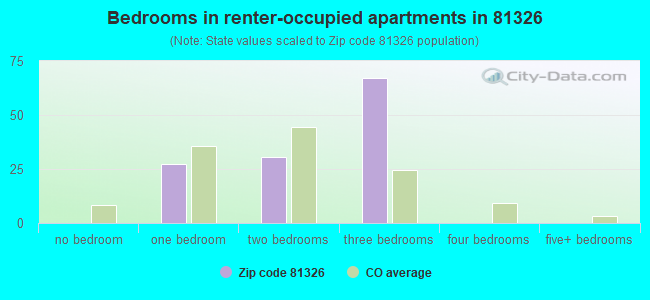
Median number of rooms in apartments:
Here:
4.2
State:
4.0
Notable locations in this zip code not listed on our city pages
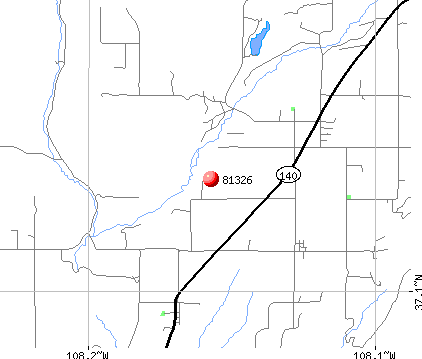
Notable locations in zip code 81326: Kroeger Campground (A), Colorado State University San Juan Basin Branch Agricultural Experimental Station (B), Fort Lewis Mesa Fire Protection District Station 5 (C), Fort Lewis Mesa Fire Protection District Station 4 (D), Fort Lewis Mesa Fire Protection District Station 3 (E), Fort Lewis Mesa Fire Protection District Station 2 (F), Fort Lewis Mesa Fire Protection District Station 1 (G). Display/hide their locations on the map
Streams, rivers, and creeks: Cherry Creek (A), Wheeler Arroyo (B), Johnny Pond Arroyo (C), San Juan Arroyo (D), Basin Creek (E), Neptune Creek (F). Display/hide their locations on the map
In group quarters: 6 (-1 institutionalized population)
Size of family households: 614 2-persons, 125 3-persons, 95 4-persons, 30 5-persons, 22 6-persons, 7 7-or-more-persons
Size of nonfamily households: 174 1-person, 30 2-persons, 4 3-persons
298 married couples with children.
53 single-parent households (24 men, 29 women).
94.9% of residents of 81326 zip code speak English at home.
2.2% of residents speak Spanish at home (69% very well, 31% not at all).
0.4% of residents speak other Indo-European language at home (100% very well).
0.7% of residents speak Asian or Pacific Island language at home (47% very well, 18% well, 35% not well).
2.5% of residents speak other language at home (100% very well).
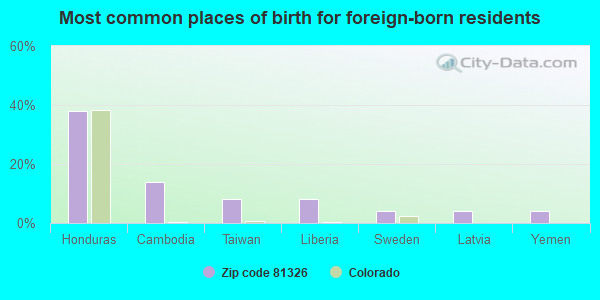
Foreign born population: 50 (1.9%) (22.8% of them are naturalized citizens)
This zip code:
1.9%
Whole state:
9.5%
38%Honduras
14%Cambodia
8%Taiwan
8%Liberia
4%Sweden
4%Latvia
4%Yemen
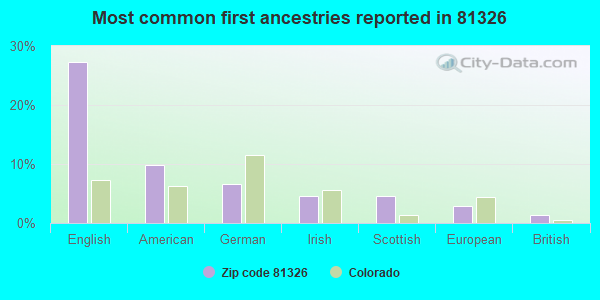
27%English
10%American
7%German
5%Irish
5%Scottish
3%European
1%British
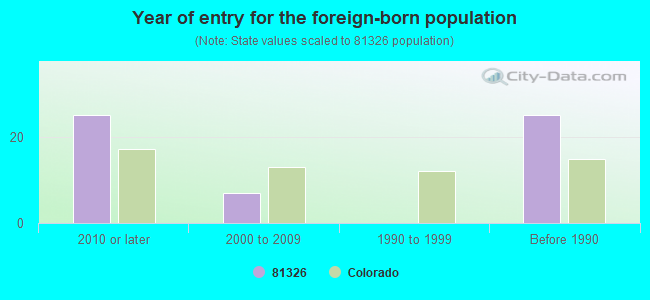
Year of entry for the foreign-born population
252010 or later
72000 to 2009
01990 to 1999
25Before 1990
Public elementary/middle school in in zip code 81326 not listed on the city page:
Facilities with environmental interests located in this zip code:
ADKINS RANCH (8493 COUNTY ROAD 100 in HESPERUS, CO)
(Integrated Compliance Information System) - ICIS-08-1993-0230, FORMAL ENFORCEMENT ACTION COMPLIANCE ACTIVITY (Tracking inspections of insecticide, fungicide, and rodenticide, and toxic substances) Business SIC classification: FORESTRY SERVICES Alternative names: JIM ADKINS
APACHE CORP/BWAB INC-CLOSED AMINE PLANT (3 MI. E OF RED MESA in DURANGO, CO)
AIR MINOR (AIRS/AFS) Business SIC classification: CRUDE PETROLEUM AND NATURAL GAS
C & F COAL HAY GULCH #1 MINE (SEC 32 T35N R11W in DURANGO, 9.5 MI W OF, CO)
AIR MINOR (AIRS/AFS) Business SIC classification: BITUMINOUS COAL AND LIGNITE SURFACE MINING
HADDEN BACKHOE AND WELDING (6701 HIGHWAY 140 in HESPERUS, CO)
ENFORCEMENT/COMPLIANCE ACTIVITY (Integrated Compliance Information System)
Housing units lacking complete plumbing facilities: 2.2% Housing units lacking complete kitchen facilities: 2.4%
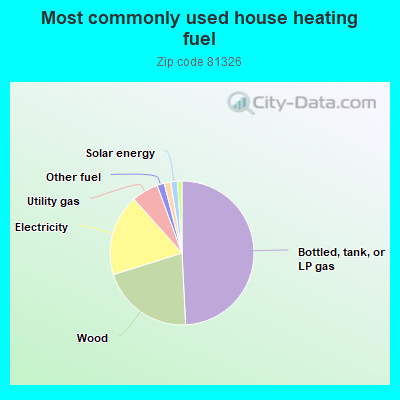
49.3%Bottled, tank, or LP gas
21.0%Wood
18.3%Electricity
6.0%Utility gas
1.6%Other fuel
1.5%Fuel oil, kerosene, etc.
1.5%Solar energy
1.0%No fuel used
Population in 1990: 1,303. Population change in the 1990s: +572 (+43.9%).
Place of birth for U.S.-born residents:
This state: 1,011
Northeast: 156
Midwest: 398
South: 432
West: 584
62% of the 81326 zip code residents lived in the same house 5 years ago. Out of people who lived in different houses, 43% lived in this county. Out of people who lived in different counties, 50% lived in Colorado.
94% of the 81326 zip code residents lived in the same house 1 year ago. Out of people who lived in different houses, 18% moved from this county. Out of people who lived in different houses, 52% moved from different county within same state. Out of people who lived in different houses, 27% moved from different state. Out of people who lived in different houses, 13% moved from abroad.
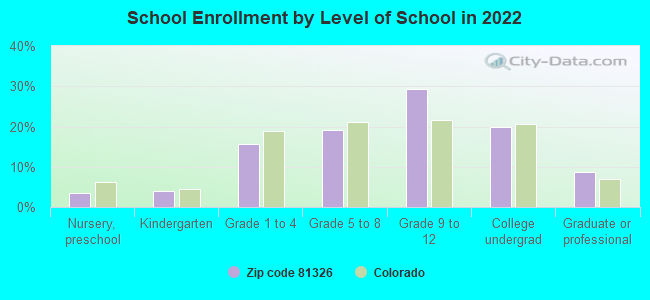
Private vs. public school enrollment:
Students in private schools in grades 1 to 8 (elementary and middle school): 25
Here:
17.8%
Colorado:
11.4%
Students in private schools in grades 9 to 12 (high school): 23
Here:
20.0%
Colorado:
8.5%
Students in private undergraduate colleges: 4
Here:
5.0%
Colorado:
14.0%
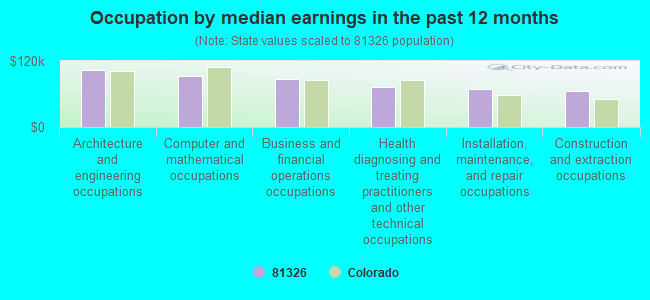
Occupation by median earnings in the past 12 months ($)
104,246Architecture and engineering occupations
92,632Computer and mathematical occupations
87,560Business and financial operations occupations
71,822Health diagnosing and treating practitioners and other technical occupations
69,255Installation, maintenance, and repair occupations
66,051Construction and extraction occupations
Top industries in this zip code by the number of employees in 2005:
Construction: New Single-Family Housing Construction (except Operative Builders) (10-19: 1, 5-9: 1, 1-4: 8)
Accommodation and Food Services: Full-Service Restaurants (20-49: 1, 1-4: 1)
Construction: Drywall and Insulation Contractors (20-49: 1)
Management of Companies and Enterprises: Offices of Other Holding Companies (20-49: 1)
Accommodation and Food Services: Bed-and-Breakfast Inns (10-19: 1)
Construction: Masonry Contractors (1-4: 5)
Accommodation and Food Services: Recreational and Vacation Camps (except Campgrounds) (5-9: 1)
Arts, Entertainment, and Recreation: Skiing Facilities (5-9: 1)
People in group quarters in 2010:
3 people in workers' group living quarters and job corps centers
Fatal accident statistics in 2014:
Fatal accident count: 1
Vehicles involved in fatal accidents: 1
Fatal accidents caused by drunken drivers: 0
Fatalities: 1
Persons involved in fatal accidents: 2
Pedestrians involved in fatal accidents: 0
Fatal accident statistics in 2013:
Fatal accident count: 1
Vehicles involved in fatal accidents: 2
Fatal accidents caused by drunken drivers: 0
Fatalities: 1
Persons involved in fatal accidents: 3
Pedestrians involved in fatal accidents: 0
2002 - 2018 National Fire Incident Reporting System (NFIRS) incidents
Based on the data from the years 2002 - 2018 the average number of fires per year is 20. The highest number of fire incidents - 52 took place in 2007, and the least - 2 in 2002. The data has a growing trend.
When looking into fire subcategories, the most incidents belonged to: Outside Fires (78.4%), and Structure Fires (14.1%).
Fire incident types reported to NFIRS in Zip Code 81326


 Nearest zip codes: 87418, 81328, 81303, 81330, 87415, 87402.


 (Students: 170, Location: 11274 HIGHWAY 140, Grades: PK-5)

 Based on the data from the years 2002 - 2018 the average number of fires per year is 20. The highest number of fire incidents - 52 took place in 2007, and the least - 2 in 2002. The data has a growing trend.
 When looking into fire subcategories, the most incidents belonged to: Outside Fires (78.4%), and Structure Fires (14.1%).