Estimated zip code population in 2022: 1,514 Zip code population in 2010: 2,073 Zip code population in 2000: 1,402
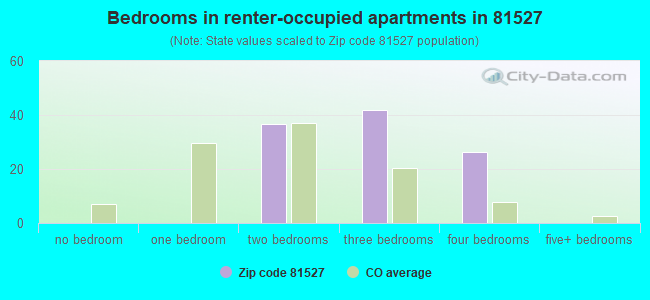
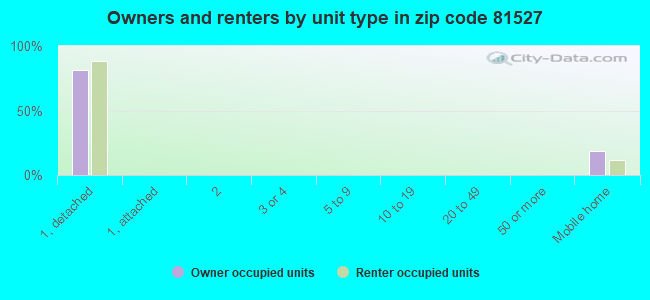
Houses and condos: 887 Renter-occupied apartments: 104
% of renters here:
15%
State:
34%
March 2022 cost of living index in zip code 81527: 94.6 (less than average, U.S. average is 100)
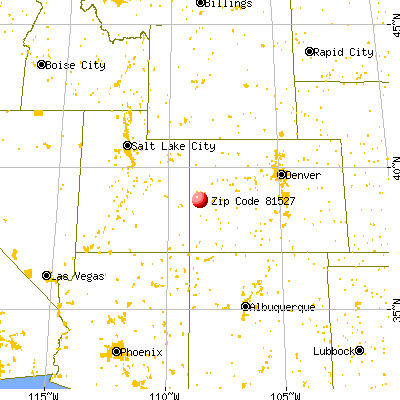
Land area: 777.6 sq. mi. Water area: 1.5 sq. mi.
Population density: 2 people per square mile
(very low).
OSM Map
General Map
Google Map
MSN Map
OSM Map
General Map
Google Map
MSN Map
OSM Map
General Map
Google Map
MSN Map
OSM Map
General Map
Google Map
MSN Map
Please wait while loading the map...
Real estate property taxes paid for housing units in 2022:
This zip code:
0.3% ($1,384)
Colorado:
0.5% ($2,422)
Median real estate property taxes paid for housing units with mortgages in 2022: $1,589 (0.4%) Median real estate property taxes paid for housing units with no mortgage in 2022: $1,049 (0.2%)
Business Search- 14 Million verified businesses
Males: 829
(54.7%)
Females: 685
(45.3%)
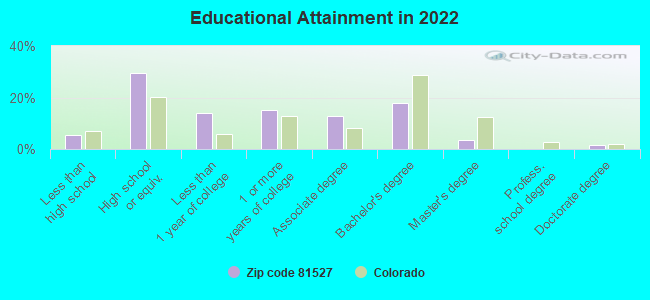
For population 25 years and over in 81527:
High school or higher: 93.7%
Bachelor's degree or higher: 22.9%
Graduate or professional degree: 5.1%
Mean travel time to work (commute): 36.8 minutes
For population 15 years and over in 81527:
Never married: 15.4%
Now married: 72.9%
Separated: 0.0%
Widowed: 5.9%
Divorced: 5.8%
Zip code 81527 compared to state average:
Unemployed percentage significantly below state average.
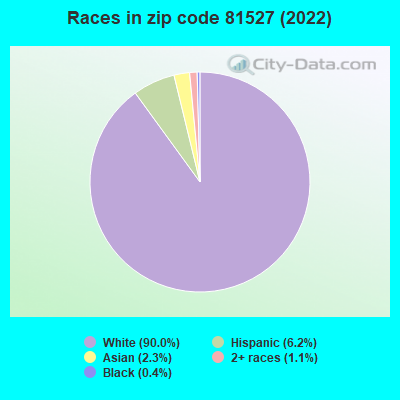
Black race population percentage significantly below state average.
Hispanic race population percentage significantly below state average.
Median age significantly above state average.
Foreign-born population percentage significantly below state average.
Renting percentage below state average.
Length of stay since moving in significantly above state average.
Percentage of population with a bachelor's degree or higher below state average.
Averages for the 2020 tax year for zip code 81527, filed in 2021:
Average Adjusted Gross Income (AGI) in 2020: $77,071 (Individual Income Tax Returns)
Here:
$77,071
State:
$89,260
Salary/wage: $63,099 (reported on 76.0% of returns)
Here:
$63,099
State:
$70,330
(% of AGI for various income ranges: 1199.4% for AGIs below $25k, 3154.0% for AGIs $25k-50k, 6258.0% for AGIs $50k-75k, 10902.9% for AGIs $75k-100k, 19126.7% for AGIs $100k-200k)
Taxable interest for individuals: $784 (reported on 32.3% of returns)
This zip code:
$784
Colorado:
$2,176
(% of AGI for various income ranges: 7.2% for AGIs below $25k, 42.0% for AGIs $25k-50k, 16.0% for AGIs $50k-75k, 60.0% for AGIs $75k-100k, 17.8% for AGIs $100k-200k)
Ordinary dividends: $2,300 (reported on 20.8% of returns)
Here:
$2,300
State:
$8,820
(% of AGI for various income ranges: 31.7% for AGIs below $25k, 50.7% for AGIs $25k-50k, 51.0% for AGIs $50k-75k, 82.9% for AGIs $75k-100k, 242.2% for AGIs $100k-200k)
Net capital gain/loss in AGI: +$22,744 (reported on 18.8% of returns)
Here:
+$22,744
State:
+$37,276
(% of AGI for various income ranges: 46.0% for AGIs $25k-50k, 147.0% for AGIs $50k-75k, 334.3% for AGIs $75k-100k, 891.1% for AGIs $100k-200k)
Profit/loss from business: +$8,522 (reported on 18.8% of returns)
Here:
+$8,522
State:
+$15,295
(% of AGI for various income ranges: 165.6% for AGIs below $25k, 396.0% for AGIs $25k-50k, 149.0% for AGIs $50k-75k, 172.9% for AGIs $75k-100k, 413.3% for AGIs $100k-200k)
Taxable individual retirement arrangement distribution: $19,062 (reported on 13.5% of returns)
81527:
$19,062
Colorado:
$23,785
(% of AGI for various income ranges: 324.7% for AGIs $25k-50k, 780.0% for AGIs $50k-75k, 1345.6% for AGIs $100k-200k)
Total itemized deductions: $33,667 (reported on 9.4% of returns)
Here:
$33,667
State:
$35,141
(% of AGI for various income ranges: 1228.0% for AGIs $50k-75k, 2002.2% for AGIs $100k-200k)
Charity contributions: $11,333 (reported on 6.2% of returns)
Here:
$11,333
State:
$12,103
(% of AGI for various income ranges: 71.3% for AGIs $25k-50k, 636.7% for AGIs $100k-200k)
Taxes paid: $6,556 (reported on 9.4% of returns)
81527:
$6,556
State:
$7,710
(% of AGI for various income ranges: 181.0% for AGIs $50k-75k, 454.4% for AGIs $100k-200k)
Earned income credit: $2,264 (reported on 11.5% of returns)
Here:
$2,264
State:
$2,053
(% of AGI for various income ranges: 96.1% for AGIs below $25k, 50.7% for AGIs $25k-50k)
Percentage of individuals using paid preparers for their 2020 taxes: 93.8%
Here:
94%
State:
93%
(% for various income ranges: 92.3% for AGIs below $25k, 90.5% for AGIs $25k-50k, 92.9% for AGIs $50k-75k, 91.7% for AGIs $75k-100k, 100.0% for AGIs $100k-200k, 100.0% for AGIs over 200k)
Averages for the 2012 tax year for zip code 81527, filed in 2013:
Average Adjusted Gross Income (AGI) in 2012: $65,894 (Individual Income Tax Returns)
Here:
$65,894
State:
$69,103
Salary/wage: $55,375 (reported on 84.3% of returns)
Here:
$55,375
State:
$54,794
(% of AGI for various income ranges: 66.9% for AGIs below $25k, 69.0% for AGIs $25k-50k, 79.9% for AGIs $50k-75k, 79.4% for AGIs $75k-100k, 77.0% for AGIs $100k-200k, 47.7% for AGIs over 200k)
Taxable interest for individuals: $1,227 (reported on 33.7% of returns)
This zip code:
$1,227
Colorado:
$1,971
(% of AGI for various income ranges: 0.5% for AGIs below $25k, 1.1% for AGIs $25k-50k, 0.5% for AGIs $50k-75k, 1.2% for AGIs $75k-100k, 0.2% for AGIs $100k-200k, 0.6% for AGIs over 200k)
Ordinary dividends: $2,688 (reported on 19.1% of returns)
Here:
$2,688
State:
$7,140
(% of AGI for various income ranges: 2.4% for AGIs below $25k, 0.7% for AGIs $25k-50k, 0.5% for AGIs $50k-75k, 0.3% for AGIs $75k-100k, 1.5% for AGIs $100k-200k)
Net capital gain/loss in AGI: +$6,000 (reported on 18.0% of returns)
Here:
+$6,000
State:
+$23,009
(% of AGI for various income ranges: 0.5% for AGIs $25k-50k, 2.9% for AGIs $50k-75k, 4.0% for AGIs $100k-200k)
Profit/loss from business: +$8,106 (reported on 20.2% of returns)
Here:
+$8,106
State:
+$13,514
(% of AGI for various income ranges: 10.1% for AGIs below $25k, 5.3% for AGIs $25k-50k, 2.6% for AGIs $50k-75k, 4.2% for AGIs $75k-100k, 0.1% for AGIs $100k-200k)
Taxable individual retirement arrangement distribution: $11,091 (reported on 12.4% of returns)
81527:
$11,091
Colorado:
$17,927
(% of AGI for various income ranges: 2.7% for AGIs below $25k, 4.8% for AGIs $25k-50k, 4.3% for AGIs $50k-75k, 2.2% for AGIs $100k-200k)
Total itemized deductions: $23,649 (22% of AGI, reported on 41.6% of returns)
Here:
$23,649
State:
$24,621
Here:
21.7% of AGI
State:
18.5% of AGI
(% of AGI for various income ranges: 9.0% for AGIs below $25k, 16.8% for AGIs $25k-50k, 15.7% for AGIs $50k-75k, 18.3% for AGIs $75k-100k, 13.1% for AGIs $100k-200k, 14.2% for AGIs over 200k)
Charity contributions: $3,579 (reported on 31.5% of returns)
Here:
$3,579
State:
$4,449
(% of AGI for various income ranges: 1.5% for AGIs $25k-50k, 1.5% for AGIs $50k-75k, 2.8% for AGIs $75k-100k, 1.6% for AGIs $100k-200k, 1.6% for AGIs over 200k)
Taxes paid: $6,176 (reported on 41.6% of returns)
81527:
$6,176
State:
$7,641
(% of AGI for various income ranges: 1.2% for AGIs below $25k, 3.0% for AGIs $25k-50k, 3.3% for AGIs $50k-75k, 4.0% for AGIs $75k-100k, 3.9% for AGIs $100k-200k, 5.8% for AGIs over 200k)
Earned income credit: $2,040 (reported on 11.2% of returns)
Here:
$2,040
State:
$2,095
(% of AGI for various income ranges: 4.5% for AGIs below $25k, 0.7% for AGIs $25k-50k)
Percentage of individuals using paid preparers for their 2012 taxes: 56.2%
Here:
56%
State:
49%
(% for various income ranges: 46.4% for AGIs below $25k, 55.6% for AGIs $25k-50k, 58.8% for AGIs $50k-75k, 66.7% for AGIs $75k-100k, 58.3% for AGIs $100k-200k, 100.0% for AGIs over 200k)
Averages for the 2004 tax year for zip code 81527, filed in 2005:
Average Adjusted Gross Income (AGI) in 2004: $43,205 (Individual Income Tax Returns)
Here:
$43,205
State:
$55,014
Salary/wage: $39,453 (reported on 84.9% of returns)
Here:
$39,453
State:
$46,010
(% of AGI for various income ranges: 105.0% for AGIs below $10k, 69.7% for AGIs $10k-25k, 82.8% for AGIs $25k-50k, 80.5% for AGIs $50k-75k, 85.8% for AGIs $75k-100k, 59.1% for AGIs over 100k)
Taxable interest for individuals: $1,446 (reported on 42.0% of returns)
This zip code:
$1,446
Colorado:
$2,127
(% of AGI for various income ranges: 10.2% for AGIs below $10k, 1.6% for AGIs $10k-25k, 0.4% for AGIs $25k-50k, 2.8% for AGIs $50k-75k, 0.6% for AGIs $75k-100k, 0.8% for AGIs over 100k)
Taxable dividends: $566 (reported on 20.1% of returns)
Here:
$566
State:
$3,782
(% of AGI for various income ranges: 0.9% for AGIs below $10k, 0.3% for AGIs $10k-25k, 0.3% for AGIs $25k-50k, 0.2% for AGIs $50k-75k, 0.3% for AGIs $75k-100k, 0.1% for AGIs over 100k)
Net capital gain/loss: +$8,625 (reported on 18.9% of returns)
Here:
+$8,625
State:
+$17,882
(% of AGI for various income ranges: -2.8% for AGIs below $10k, -0.7% for AGIs $10k-25k, 1.4% for AGIs $25k-50k, 2.0% for AGIs $50k-75k, 3.9% for AGIs $75k-100k, 11.8% for AGIs over 100k)
Profit/loss from business: +$10,065 (reported on 23.3% of returns)
Here:
+$10,065
State:
+$11,247
(% of AGI for various income ranges: 11.8% for AGIs below $10k, 17.8% for AGIs $10k-25k, 4.9% for AGIs $25k-50k, 7.0% for AGIs $50k-75k, 2.9% for AGIs $75k-100k)
IRA payment deduction: $3,263 (reported on 2.6% of returns)
81527:
$3,263
Colorado:
$2,947
Total itemized deductions: $16,696 (26% of AGI, reported on 43.4% of returns)
Here:
$16,696
State:
$20,560
Here:
26.2% of AGI
State:
21.4% of AGI
(% of AGI for various income ranges: 19.4% for AGIs $10k-25k, 19.5% for AGIs $25k-50k, 16.7% for AGIs $50k-75k, 17.5% for AGIs $75k-100k, 12.7% for AGIs over 100k)
Charity contributions deductions: $2,175 (3% of AGI, reported on 33.3% of returns)
Here:
$2,175
State:
$3,518
Here:
3.4% of AGI
State:
3.4% of AGI
(% of AGI for various income ranges: 2.0% for AGIs $10k-25k, 1.7% for AGIs $25k-50k, 1.7% for AGIs $50k-75k, 1.8% for AGIs $75k-100k, 1.5% for AGIs over 100k)
Total tax: $5,028 (reported on 80.3% of returns)
81527:
$5,028
State:
$9,173
(% of AGI for various income ranges: 4.5% for AGIs below $10k, 6.2% for AGIs $10k-25k, 6.5% for AGIs $25k-50k, 8.4% for AGIs $50k-75k, 9.4% for AGIs $75k-100k, 15.9% for AGIs over 100k)
Earned income credit: $1,779 (reported on 13.2% of returns)
Here:
$1,779
State:
$1,595
Percentage of individuals using paid preparers for their 2004 taxes: 60.5%
Here:
60%
State:
55%
(% for various income ranges: 43.8% for AGIs below $10k, 58.9% for AGIs $10k-25k, 65.8% for AGIs $25k-50k, 65.4% for AGIs $50k-75k, 66.2% for AGIs $75k-100k, 64.3% for AGIs over 100k)
Household received Food Stamps/SNAP in the past 12 months: 39 Household did not receive Food Stamps/SNAP in the past 12 months: 640
Women who had a birth in the past 12 months: 57 (59 now married, 0 unmarried) Women who did not have a birth in the past 12 months: 199 (112 now married, 86 unmarried)
Housing units in zip code 81527 with a mortgage: 335 (11 second mortgage, 11 both second mortgage and home equity loan) Houses without a mortgage: 24
Median monthly owner costs for units with a mortgage: $1,687 Median monthly owner costs for units without a mortgage: $414
Residents with income below the poverty level in 2022:
This zip code:
5.4%
Whole state:
9.4%
Residents with income below 50% of the poverty level in 2022:
This zip code:
0.3%
Whole state:
4.6%
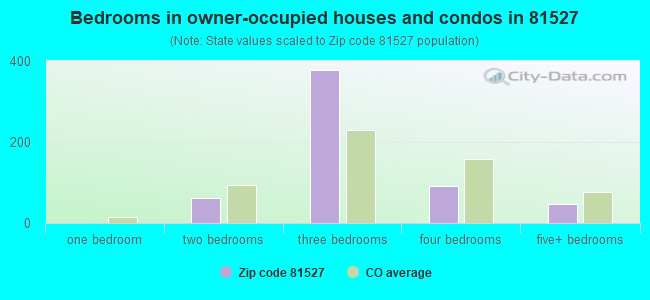
Median number of rooms in houses and condos:
Here:
6.4
State:
6.8
Median number of rooms in apartments:
Here:
5.0
State:
4.0
Notable locations in this zip code not listed on our city pages
Lakes and reservoirs: Big Pond (A), Rim Pond (B), Middle Pond (C), Far Pond (D), Little Bear Lake (E), The Lake (F), Whiskers Pond (G), Love Lake (H). Display/hide their locations on the map
Streams, rivers, and creeks: Juniata Ditch (A), East Fork Escalante Creek (B), Points Creek (C), Middle Fork Escalante Creek (D), Kelso Creek (E), Garvey Branch (F), Beaver Dam Branch North Fork Mesa Creek (G), Barklay Creek (H), U C Creek (I). Display/hide their locations on the map
In group quarters: 18 (-1 institutionalized population)
Size of family households: 335 2-persons, 108 3-persons, 23 4-persons, 44 5-persons
Size of nonfamily households: 138 1-person, 31 2-persons
114 married couples with children.
0 single-parent households ().
100.4% of residents of 81527 zip code speak English at home.
0.3% of residents speak Spanish at home (100% very well).
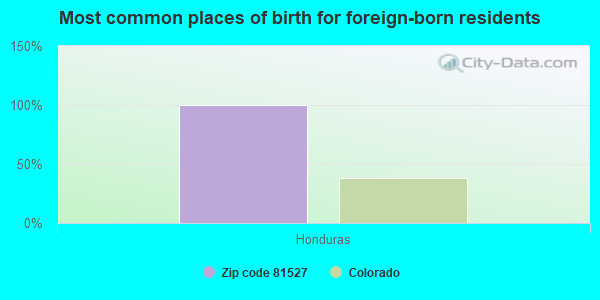
Foreign born population: 2 (0.1%) (51.1% of them are naturalized citizens)
This zip code:
0.1%
Whole state:
9.5%
100%Honduras
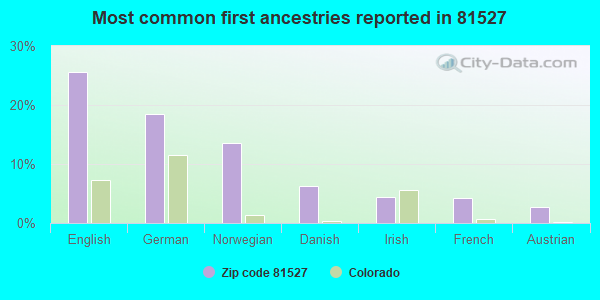
26%English
18%German
14%Norwegian
6%Danish
4%Irish
4%French
3%Austrian
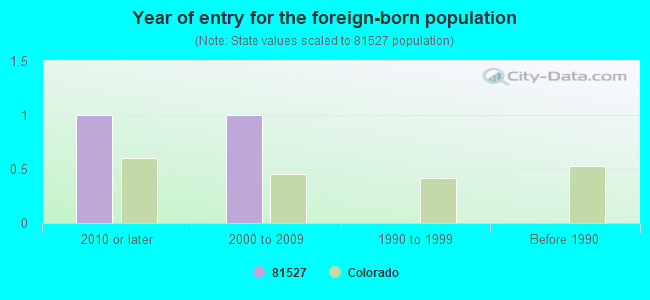
Year of entry for the foreign-born population
12010 or later
12000 to 2009
01990 to 1999
0Before 1990
Facilities with environmental interests located in this zip code:
AMERICAN PIONEER POWDER INC (1475 BLAIR RD in WHITEWATER, CO)
(Resource Conservation and Recovery Act (tracking hazardous waste))
GRAND JUNCTION PIPE & SUPPLY CO. (NE/4 SW/4 SEC 4 T3S R2E in GRAND JUNCTION, 10.0 MI SE OF, CO)
AIR MINOR (AIRS/AFS) CRITERIA AND HAZARDOUS AIR POLLUTANT INVENTORY (Inventory of air pollution sources) Business SIC classification: CONSTRUCTION SAND AND GRAVEL
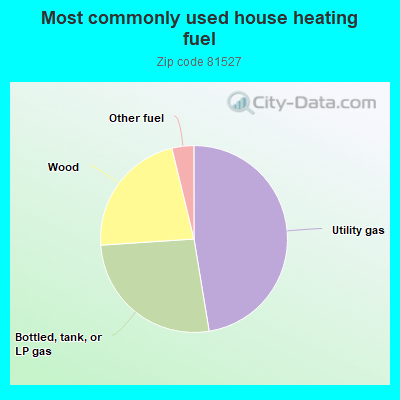
47.5%Utility gas
26.6%Bottled, tank, or LP gas
22.3%Wood
3.8%Other fuel
Population in 1990: 664. Population change in the 1990s: +738 (+111.1%).
Place of birth for U.S.-born residents:
This state: 689
Northeast: 86
Midwest: 367
South: 89
West: 274
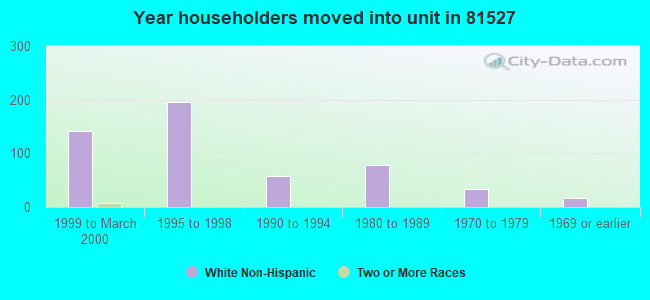
45% of the 81527 zip code residents lived in the same house 5 years ago. Out of people who lived in different houses, 57% lived in this county. Out of people who lived in different counties, 50% lived in Colorado.
94% of the 81527 zip code residents lived in the same house 1 year ago. Out of people who lived in different houses, 43% moved from different state. Out of people who lived in different houses, 73% moved from abroad.
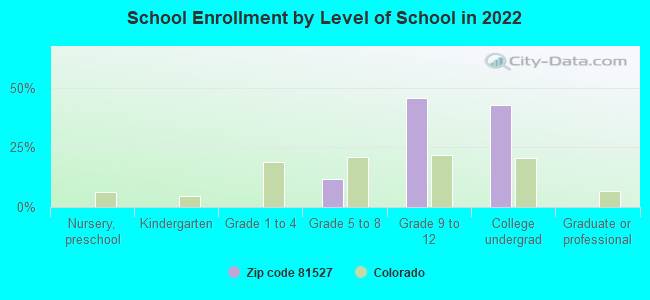
Private vs. public school enrollment:
Students in private schools in grades 1 to 8 (elementary and middle school):
Here:
0.0%
Colorado:
11.4%
Students in private schools in grades 9 to 12 (high school): 4
Here:
8.2%
Colorado:
8.5%
Students in private undergraduate colleges: 35
Here:
72.4%
Colorado:
14.0%
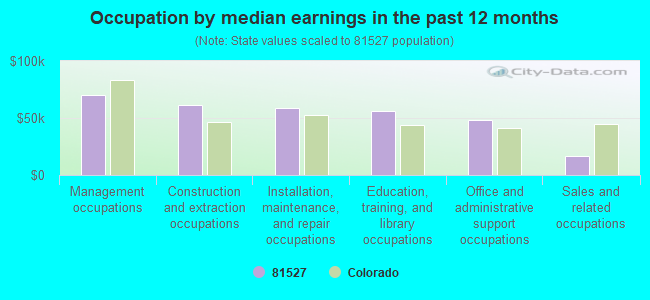
Occupation by median earnings in the past 12 months ($)
70,564Management occupations
61,002Construction and extraction occupations
58,612Installation, maintenance, and repair occupations
56,376Education, training, and library occupations
48,641Office and administrative support occupations
16,652Sales and related occupations
Top industries in this zip code by the number of employees in 2005:
Construction: Water and Sewer Line and Related Structures Construction (10-19 employees: 1 establishment, 1-4 employees: 1 establishment)
Construction: New Single-Family Housing Construction (except Operative Builders) (5-9: 1, 1-4: 3)
Construction: Site Preparation Contractors (5-9: 1, 1-4: 2)
Construction: Poured Concrete Foundation and Structure Contractors (5-9: 1, 1-4: 1)
Other Services (except Public Administration): Other Similar Organizations (except Business, Professional, Labor, and Political Organizations) (5-9: 1)
Construction: Painting and Wall Covering Contractors (5-9: 1)
People in group quarters in 2010:
11 people in residential treatment centers for juveniles (non-correctional)
People in group quarters in 2000:
6 people in other noninstitutional group quarters
2 people in other group homes
Fatal accident statistics in 2013:
Fatal accident count: 3
Vehicles involved in fatal accidents: 3
Fatal accidents caused by drunken drivers: 2
Fatalities: 3
Persons involved in fatal accidents: 3
Pedestrians involved in fatal accidents: 1
Fatal accident statistics in 2012:
Fatal accident count: 2
Vehicles involved in fatal accidents: 3
Fatal accidents caused by drunken drivers: 0
Fatalities: 2
Persons involved in fatal accidents: 3
Pedestrians involved in fatal accidents: 0
Home Mortgage Disclosure Act Aggregated Statistics For Year 2009 (Based on 4 partial tracts)
A) FHA, FSA/RHS & VA Home Purchase Loans
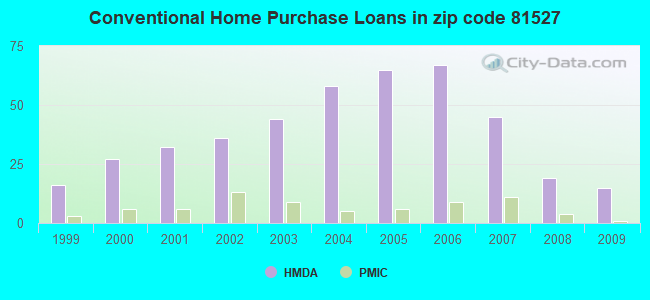
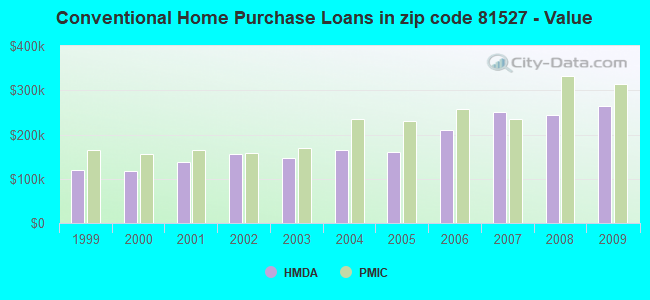
B) Conventional Home Purchase Loans
C) Refinancings
D) Home Improvement Loans
F) Non-occupant Loans on < 5 Family Dwellings (A B C & D)
G) Loans On Manufactured Home Dwelling (A B C & D)
Number
Average Value
Number
Average Value
Number
Average Value
Number
Average Value
Number
Average Value
Number
Average Value
LOANS ORIGINATED
9
$206,477
15
$265,275
138
$233,190
11
$110,917
5
$231,962
16
$178,293
APPLICATIONS APPROVED, NOT ACCEPTED
0
$0
1
$479,270
9
$192,859
1
$369,170
0
$0
1
$224,690
APPLICATIONS DENIED
3
$210,073
4
$212,608
47
$241,468
3
$81,870
2
$162,165
9
$179,462
APPLICATIONS WITHDRAWN
3
$215,553
2
$310,630
26
$227,543
2
$125,545
1
$172,880
6
$176,113
FILES CLOSED FOR INCOMPLETENESS
0
$0
0
$0
6
$212,067
0
$0
0
$0
0
$0
Aggregated Statistics For Year 2008 (Based on 4 partial tracts)
A) FHA, FSA/RHS & VA Home Purchase Loans
B) Conventional Home Purchase Loans
C) Refinancings
D) Home Improvement Loans
F) Non-occupant Loans on < 5 Family Dwellings (A B C & D)
G) Loans On Manufactured Home Dwelling (A B C & D)
Number
Average Value
Number
Average Value
Number
Average Value
Number
Average Value
Number
Average Value
Number
Average Value
LOANS ORIGINATED
12
$256,532
19
$243,751
85
$234,336
10
$87,783
4
$245,240
21
$177,715
APPLICATIONS APPROVED, NOT ACCEPTED
0
$0
5
$299,218
9
$254,636
3
$141,653
1
$242,620
3
$180,680
APPLICATIONS DENIED
2
$240,380
9
$237,752
48
$296,232
8
$104,809
3
$200,110
12
$148,712
APPLICATIONS WITHDRAWN
1
$456,350
3
$179,850
22
$260,151
2
$248,600
1
$120,560
3
$171,880
FILES CLOSED FOR INCOMPLETENESS
0
$0
1
$191,810
3
$264,877
0
$0
0
$0
0
$0
Aggregated Statistics For Year 2007 (Based on 4 partial tracts)
A) FHA, FSA/RHS & VA Home Purchase Loans
B) Conventional Home Purchase Loans
C) Refinancings
D) Home Improvement Loans
F) Non-occupant Loans on < 5 Family Dwellings (A B C & D)
G) Loans On Manufactured Home Dwelling (A B C & D)
Number
Average Value
Number
Average Value
Number
Average Value
Number
Average Value
Number
Average Value
Number
Average Value
LOANS ORIGINATED
7
$220,631
45
$250,606
72
$217,250
12
$85,773
6
$315,610
14
$181,487
APPLICATIONS APPROVED, NOT ACCEPTED
0
$0
8
$229,234
15
$229,371
3
$199,943
2
$104,620
4
$154,690
APPLICATIONS DENIED
1
$364,180
22
$251,591
50
$251,531
8
$90,984
5
$262,850
14
$145,190
APPLICATIONS WITHDRAWN
0
$0
6
$282,397
13
$255,002
1
$157,430
1
$204,760
2
$175,115
FILES CLOSED FOR INCOMPLETENESS
0
$0
1
$196,290
4
$263,422
0
$0
0
$0
0
$0
Aggregated Statistics For Year 2006 (Based on 4 partial tracts)
A) FHA, FSA/RHS & VA Home Purchase Loans
B) Conventional Home Purchase Loans
C) Refinancings
D) Home Improvement Loans
F) Non-occupant Loans on < 5 Family Dwellings (A B C & D)
G) Loans On Manufactured Home Dwelling (A B C & D)
Number
Average Value
Number
Average Value
Number
Average Value
Number
Average Value
Number
Average Value
Number
Average Value
LOANS ORIGINATED
6
$179,352
67
$211,267
82
$178,659
10
$46,382
11
$172,151
21
$143,481
APPLICATIONS APPROVED, NOT ACCEPTED
0
$0
10
$193,601
15
$205,790
1
$56,300
0
$0
1
$110,600
APPLICATIONS DENIED
1
$222,700
29
$211,306
45
$235,350
6
$112,178
4
$202,145
9
$146,416
APPLICATIONS WITHDRAWN
0
$0
12
$204,469
29
$201,651
1
$128,040
2
$178,355
5
$202,170
FILES CLOSED FOR INCOMPLETENESS
0
$0
1
$383,610
3
$217,880
0
$0
0
$0
0
$0
Aggregated Statistics For Year 2005 (Based on 4 partial tracts)
A) FHA, FSA/RHS & VA Home Purchase Loans
B) Conventional Home Purchase Loans
C) Refinancings
D) Home Improvement Loans
F) Non-occupant Loans on < 5 Family Dwellings (A B C & D)
G) Loans On Manufactured Home Dwelling (A B C & D)
Number
Average Value
Number
Average Value
Number
Average Value
Number
Average Value
Number
Average Value
Number
Average Value
LOANS ORIGINATED
7
$155,510
65
$159,508
77
$178,388
12
$57,044
8
$170,072
13
$137,005
APPLICATIONS APPROVED, NOT ACCEPTED
0
$0
5
$177,858
13
$214,839
0
$0
1
$68,750
2
$219,705
APPLICATIONS DENIED
1
$209,740
11
$155,665
51
$172,866
9
$94,104
3
$179,683
10
$151,503
APPLICATIONS WITHDRAWN
0
$0
9
$157,099
32
$179,726
3
$106,780
2
$219,955
2
$132,520
FILES CLOSED FOR INCOMPLETENESS
0
$0
1
$215,720
5
$212,234
0
$0
0
$0
0
$0
Aggregated Statistics For Year 2004 (Based on 4 partial tracts)
A) FHA, FSA/RHS & VA Home Purchase Loans
B) Conventional Home Purchase Loans
C) Refinancings
D) Home Improvement Loans
F) Non-occupant Loans on < 5 Family Dwellings (A B C & D)
G) Loans On Manufactured Home Dwelling (A B C & D)
Number
Average Value
Number
Average Value
Number
Average Value
Number
Average Value
Number
Average Value
Number
Average Value
LOANS ORIGINATED
9
$154,608
58
$166,098
85
$152,326
7
$118,714
10
$159,474
15
$133,318
APPLICATIONS APPROVED, NOT ACCEPTED
0
$0
6
$169,970
18
$144,644
1
$67,260
0
$0
5
$124,052
APPLICATIONS DENIED
1
$209,240
11
$163,047
42
$168,570
11
$69,748
0
$0
10
$130,678
APPLICATIONS WITHDRAWN
1
$258,570
6
$175,948
44
$163,817
2
$133,270
0
$0
6
$138,085
FILES CLOSED FOR INCOMPLETENESS
0
$0
0
$0
5
$186,526
0
$0
0
$0
0
$0
Aggregated Statistics For Year 2003 (Based on 4 partial tracts)
A) FHA, FSA/RHS & VA Home Purchase Loans
B) Conventional Home Purchase Loans
C) Refinancings
D) Home Improvement Loans
F) Non-occupant Loans on < 5 Family Dwellings (A B C & D)
Number
Average Value
Number
Average Value
Number
Average Value
Number
Average Value
Number
Average Value
LOANS ORIGINATED
12
$136,798
44
$147,830
191
$145,302
5
$55,500
13
$131,372
APPLICATIONS APPROVED, NOT ACCEPTED
0
$0
5
$141,390
31
$143,787
2
$24,910
3
$144,313
APPLICATIONS DENIED
2
$146,720
9
$186,050
58
$155,181
6
$48,823
3
$170,220
APPLICATIONS WITHDRAWN
1
$113,090
4
$155,812
33
$138,409
0
$0
0
$0
FILES CLOSED FOR INCOMPLETENESS
0
$0
0
$0
6
$154,442
0
$0
0
$0
Aggregated Statistics For Year 2002 (Based on 4 partial tracts)
A) FHA, FSA/RHS & VA Home Purchase Loans
B) Conventional Home Purchase Loans
C) Refinancings
D) Home Improvement Loans
F) Non-occupant Loans on < 5 Family Dwellings (A B C & D)
Number
Average Value
Number
Average Value
Number
Average Value
Number
Average Value
Number
Average Value
LOANS ORIGINATED
4
$139,248
36
$156,822
122
$132,305
11
$31,205
4
$127,540
APPLICATIONS APPROVED, NOT ACCEPTED
1
$122,060
6
$157,432
13
$118,840
1
$27,400
0
$0
APPLICATIONS DENIED
0
$0
7
$98,929
37
$125,843
3
$43,010
2
$90,425
APPLICATIONS WITHDRAWN
1
$222,200
2
$214,725
28
$150,563
1
$17,440
1
$298,420
FILES CLOSED FOR INCOMPLETENESS
0
$0
0
$0
7
$173,160
0
$0
0
$0
Aggregated Statistics For Year 2001 (Based on 4 partial tracts)
A) FHA, FSA/RHS & VA Home Purchase Loans
B) Conventional Home Purchase Loans
C) Refinancings
D) Home Improvement Loans
F) Non-occupant Loans on < 5 Family Dwellings (A B C & D)
Number
Average Value
Number
Average Value
Number
Average Value
Number
Average Value
Number
Average Value
LOANS ORIGINATED
7
$123,340
32
$138,064
108
$121,141
5
$26,504
9
$119,789
APPLICATIONS APPROVED, NOT ACCEPTED
1
$88,180
10
$91,320
11
$108,245
0
$0
1
$152,450
APPLICATIONS DENIED
0
$0
11
$63,543
42
$101,253
2
$17,935
1
$91,170
APPLICATIONS WITHDRAWN
0
$0
7
$128,037
39
$124,218
2
$16,440
2
$49,320
FILES CLOSED FOR INCOMPLETENESS
0
$0
1
$139,500
5
$119,270
0
$0
0
$0
Aggregated Statistics For Year 2000 (Based on 4 partial tracts)
A) FHA, FSA/RHS & VA Home Purchase Loans
B) Conventional Home Purchase Loans
C) Refinancings
D) Home Improvement Loans
F) Non-occupant Loans on < 5 Family Dwellings (A B C & D)
Number
Average Value
Number
Average Value
Number
Average Value
Number
Average Value
Number
Average Value
LOANS ORIGINATED
4
$95,155
27
$118,479
38
$105,330
11
$29,892
2
$144,480
APPLICATIONS APPROVED, NOT ACCEPTED
0
$0
8
$141,614
7
$100,423
0
$0
1
$134,510
APPLICATIONS DENIED
1
$73,240
18
$98,754
31
$107,049
6
$29,643
1
$176,360
APPLICATIONS WITHDRAWN
1
$105,620
3
$108,110
13
$74,998
0
$0
0
$0
FILES CLOSED FOR INCOMPLETENESS
0
$0
1
$155,440
5
$103,924
0
$0
0
$0
Aggregated Statistics For Year 1999 (Based on 2 partial tracts)
A) FHA, FSA/RHS & VA Home Purchase Loans
B) Conventional Home Purchase Loans
C) Refinancings
D) Home Improvement Loans
F) Non-occupant Loans on < 5 Family Dwellings (A B C & D)
Detailed PMIC statistics for the following Tracts:0019.00
2002 - 2018 National Fire Incident Reporting System (NFIRS) incidents
According to the data from the years 2002 - 2018 the average number of fires per year is 13. The highest number of reported fires - 32 took place in 2016, and the least - 0 in 2007. The data has a rising trend.
When looking into fire subcategories, the most incidents belonged to: Outside Fires (50.4%), and Structure Fires (25.4%).
Fire incident types reported to NFIRS in Zip Code 81527


 Nearest zip codes: 81503, 81507, 81501, 81504, 81520, 81506.


 According to the data from the years 2002 - 2018 the average number of fires per year is 13. The highest number of reported fires - 32 took place in 2016, and the least - 0 in 2007. The data has a rising trend.
 When looking into fire subcategories, the most incidents belonged to: Outside Fires (50.4%), and Structure Fires (25.4%).