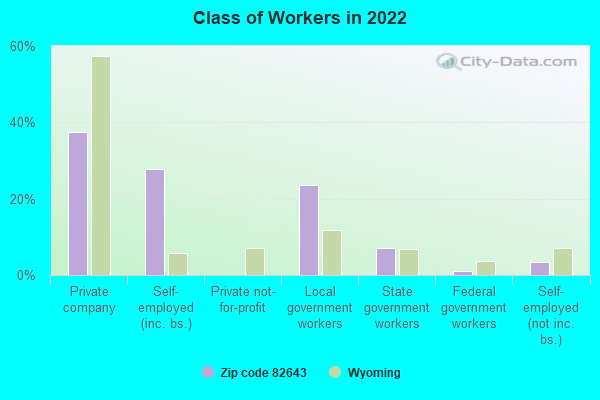
Estimated zip code population in 2022: 206 Zip code population in 2010: 469 Zip code population in 2000: 435
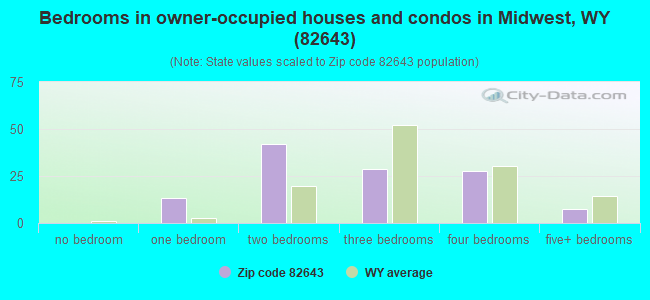
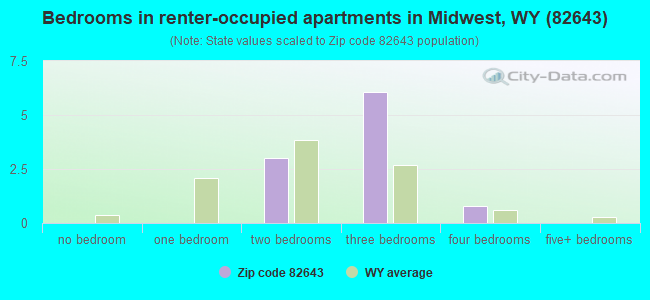
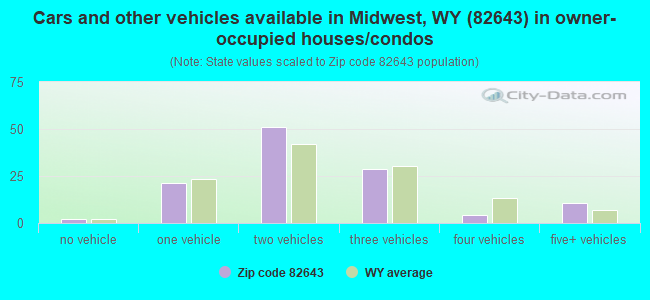
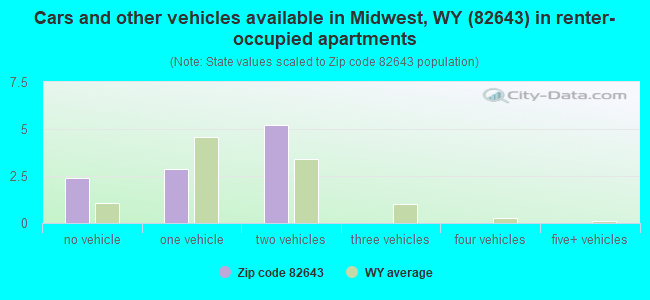
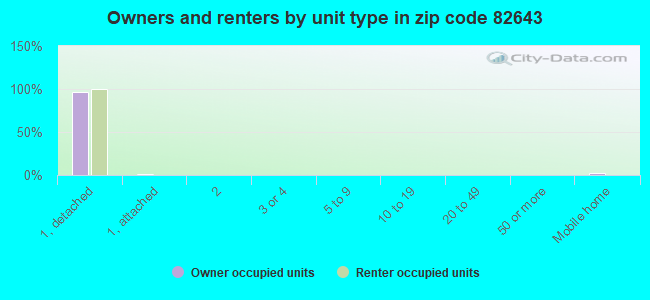
Houses and condos: 196 Renter-occupied apartments: 10
% of renters here:
8%
State:
27%
March 2022 cost of living index in zip code 82643: 76.7 (low, U.S. average is 100)
Land area: 29.8 sq. mi. Water area: 0.1 sq. mi.
Population density: 7 people per square mile
(very low).
OSM Map
General Map
Google Map
MSN Map
OSM Map
General Map
Google Map
MSN Map
OSM Map
General Map
Google Map
MSN Map
OSM Map
General Map
Google Map
MSN Map
Please wait while loading the map...
Real estate property taxes paid for housing units in 2022:
This zip code:
0.7% ($431)
Wyoming:
0.6% ($1,609)
Median real estate property taxes paid for housing units with mortgages in 2022: $456 (1.1%) Median real estate property taxes paid for housing units with no mortgage in 2022: $412 (0.6%)
Business Search- 14 Million verified businesses
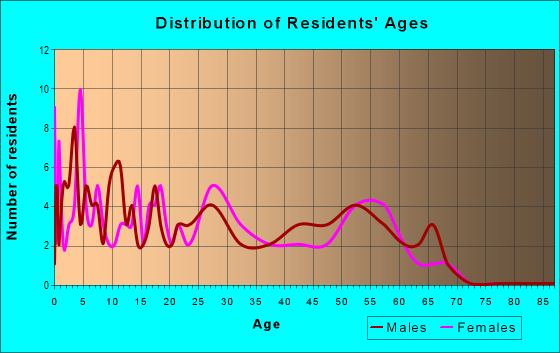
Males: 117
(57.1%)
Females: 88
(42.9%)
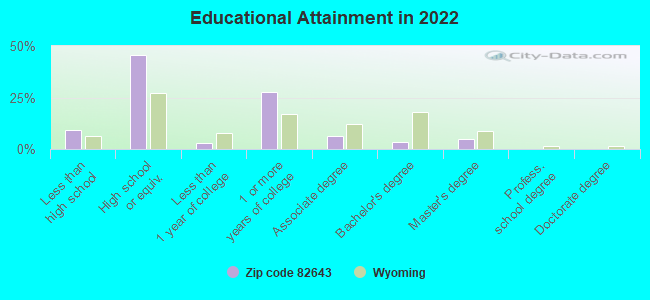
For population 25 years and over in 82643:
High school or higher: 89.1%
Bachelor's degree or higher: 8.6%
Graduate or professional degree: 5.3%
Unemployed: 1.2%
Mean travel time to work (commute): 19.6 minutes
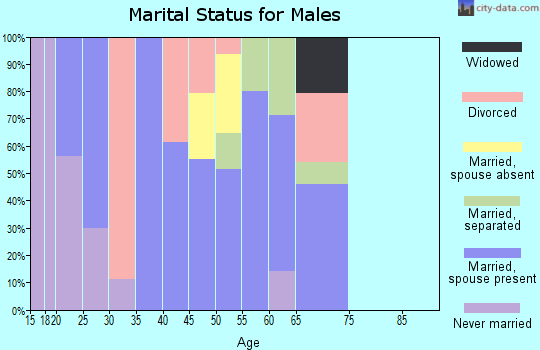
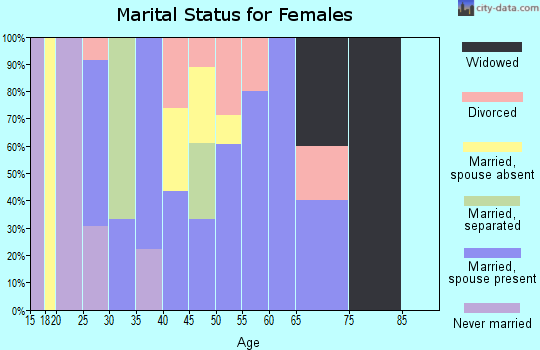
For population 15 years and over in 82643:
Never married: 13.8%
Now married: 56.9%
Separated: 0.0%
Widowed: 7.8%
Divorced: 21.5%
Zip code 82643 compared to state average:
Median house value significantly below state average.
Unemployed percentage significantly below state average.
Black race population percentage significantly below state average.
Hispanic race population percentage significantly below state average.
Median age significantly above state average.
Foreign-born population percentage significantly below state average.
Renting percentage significantly below state average.
Length of stay since moving in significantly above state average.
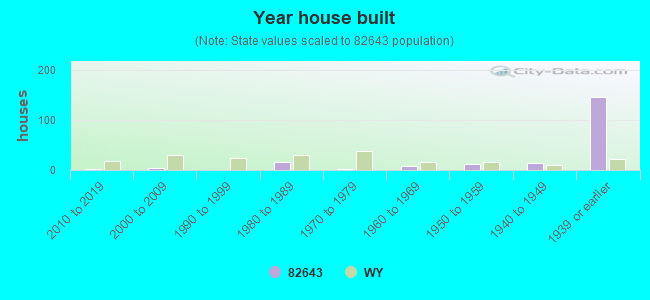
House age significantly above state average.
Percentage of population with a bachelor's degree or higher significantly below state average.
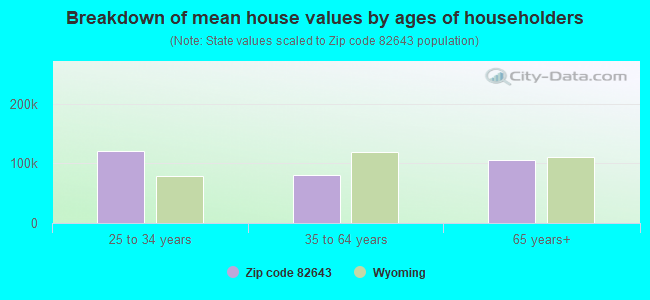
Estimated median house/condo value in 2022: $58,807
82643:
$58,807
Wyoming:
$292,300
According to our research of Wyoming and other state lists, there was 1 registered sex offender living in 82643 zip code as of April 25, 2024. The ratio of all residents to sex offenders in zip code 82643 is 613 to 1. The ratio of registered sex offenders to all residents in this zip code is much lower than the state average.
Median resident age:
This zip code:
52.6 years
Wyoming median age:
39.1 years
Average household size:
This zip code:
1.6 people
Wyoming:
2.3 people
Averages for the 2020 tax year for zip code 82643, filed in 2021:
Average Adjusted Gross Income (AGI) in 2020: $52,627 (Individual Income Tax Returns)
Here:
$52,627
State:
$93,756
Salary/wage: $39,929 (reported on 93.3% of returns)
Here:
$39,929
State:
$58,022
(% of AGI for various income ranges: 1016.7% for AGIs below $25k, 4035.0% for AGIs $25k-50k, 7120.0% for AGIs $50k-75k, 11235.0% for AGIs $75k-100k)
Taxable interest for individuals: $450 (reported on 26.7% of returns)
This zip code:
$450
Wyoming:
$3,185
(% of AGI for various income ranges: 45.0% for AGIs $25k-50k)
Earned income credit: $2,200 (reported on 20.0% of returns)
Here:
$2,200
State:
$2,106
(% of AGI for various income ranges: 220.0% for AGIs below $25k)
Percentage of individuals using paid preparers for their 2020 taxes: 93.3%
Here:
93%
State:
94%
(% for various income ranges: 100.0% for AGIs below $25k, 83.3% for AGIs $25k-50k, 100.0% for AGIs $50k-75k, 100.0% for AGIs $75k-100k)
Averages for the 2012 tax year for zip code 82643, filed in 2013:
Average Adjusted Gross Income (AGI) in 2012: $57,642 (Individual Income Tax Returns)
Here:
$57,642
State:
$69,135
Salary/wage: $45,800 (reported on 73.1% of returns)
Here:
$45,800
State:
$48,877
(% of AGI for various income ranges: 51.6% for AGIs below $25k, 51.6% for AGIs $25k-50k, 125.2% for AGIs $50k-75k, 45.1% for AGIs $100k-200k)
Taxable interest for individuals: $400 (reported on 15.4% of returns)
This zip code:
$400
Wyoming:
$3,063
Ordinary dividends: $13,600 (reported on 30.8% of returns)
Here:
$13,600
State:
$14,293
(% of AGI for various income ranges: 35.5% for AGIs below $25k, 22.2% for AGIs $25k-50k, 2.4% for AGIs $50k-75k)
Net capital gain/loss in AGI: +$12,420 (reported on 19.2% of returns)
Here:
+$12,420
State:
+$37,851
Earned income credit: $2,225 (reported on 15.4% of returns)
Here:
$2,225
State:
$1,989
(% of AGI for various income ranges: 6.6% for AGIs below $25k)
Percentage of individuals using paid preparers for their 2012 taxes: 53.8%
Here:
54%
State:
50%
(% for various income ranges: 33.3% for AGIs below $25k, 57.1% for AGIs $25k-50k, 80.0% for AGIs $50k-75k, 100.0% for AGIs $100k-200k)
Averages for the 2004 tax year for zip code 82643, filed in 2005:
Average Adjusted Gross Income (AGI) in 2004: $41,886 (Individual Income Tax Returns)
Here:
$41,886
State:
$50,131
Salary/wage: $35,072 (reported on 89.7% of returns)
Here:
$35,072
State:
$37,659
(% of AGI for various income ranges: 94.4% for AGIs below $10k, 79.9% for AGIs $10k-25k, 78.4% for AGIs $25k-50k, 92.6% for AGIs $50k-75k, 73.6% for AGIs $75k-100k, 55.2% for AGIs over 100k)
Taxable interest for individuals: $357 (reported on 30.3% of returns)
This zip code:
$357
Wyoming:
$2,408
Taxable dividends: $471 (reported on 9.2% of returns)
Here:
$471
State:
$6,819
Net capital gain/loss: +$48 (reported on 11.4% of returns)
Here:
+$48
State:
+$23,705
Total tax: $6,642 (reported on 74.1% of returns)
82643:
$6,642
State:
$8,551
(% of AGI for various income ranges: 4.2% for AGIs $10k-25k, 8.0% for AGIs $25k-50k, 10.2% for AGIs $50k-75k, 10.5% for AGIs $75k-100k, 20.8% for AGIs over 100k)
Earned income credit: $1,605 (reported on 20.5% of returns)
Here:
$1,605
State:
$1,544
Percentage of individuals using paid preparers for their 2004 taxes: 67.6%
Here:
68%
State:
59%
(% for various income ranges: 53.1% for AGIs below $10k, 68.3% for AGIs $10k-25k, 66.7% for AGIs $25k-50k, 103.4% for AGIs $50k-75k, 90.9% for AGIs over 100k)
Household received Food Stamps/SNAP in the past 12 months: 6 Household did not receive Food Stamps/SNAP in the past 12 months: 122
Women who did not have a birth in the past 12 months: 33 (17 now married, 16 unmarried)
Housing units in zip code 82643 with a mortgage: 20 Median monthly owner costs for units with a mortgage: $723 Median monthly owner costs for units without a mortgage: $321
Residents with income below the poverty level in 2022:
This zip code:
11.0%
Whole state:
11.8%
Residents with income below 50% of the poverty level in 2022:
This zip code:
8.0%
Whole state:
6.8%
Median number of rooms in houses and condos:
Here:
5.1
State:
6.7
Median number of rooms in apartments:
Here:
6.4
State:
4.4
Notable locations in this zip code not listed on our city pages
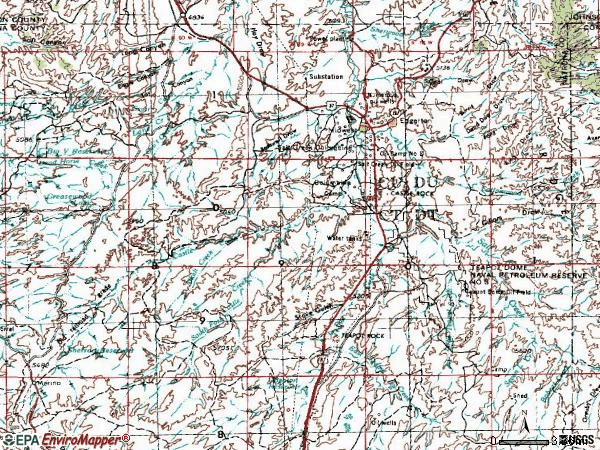
Reservoirs: Lower Salt Creek Reservoir (A), Midwest Number 23 Reservoir (B), C B Richardson Number 1 Reservoir (C), MacReas Reservoir (D), Wyoming Associated Reservoir Number 17 (E), Midwest Number 12 Reservoir (F). Display/hide their locations on the map
Size of family households: 34 2-persons, 25 3-persons, 1 4-persons
Size of nonfamily households: 68 1-person
13 married couples with children.
3 single-parent households (3 women).
97.1% of residents of 82643 zip code speak English at home.
2.4% of residents speak Spanish at home (100% very well).
Foreign born population: 0 (0.0%)
:
0.0%
Whole state:
3.1%
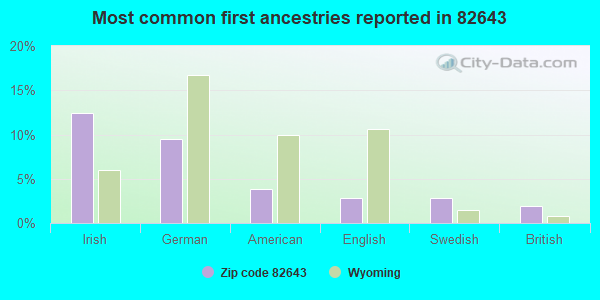
12%Irish
10%German
4%American
3%English
3%Swedish
2%British
Facilities with environmental interests located in this zip code:
MIDWEST SCHOOL (245 LEWIS in MIDWEST, WY)
(Geographic Names Information System) (National Center for Education Statistics) - STATE ID-1301049 Organizations: NATRONA #1 (SCHOOL DISTRICT)
HOWELL PETROLEUM CORPORATION (PO BOX 10, 1/2 MILE SOUTH OF MIDWEST in MIDWEST, WY)
ENFORCEMENT/COMPLIANCE ACTIVITY (Integrated Compliance Information System) (Integrated Compliance Information System) - ICIS-08-2001-0005, FORMAL ENFORCEMENT ACTION
AMOCO PRODUCTION CO (1/2 MILE WEST MIDWEST JUNCTION in MIDWEST, WY)
(Integrated Compliance Information System) - ICIS-08-1996-0149, FORMAL ENFORCEMENT ACTION Business SIC classification: PETROLEUM REFINING
AMOCO PRODUCTION CO (SECTION 34, T40N, R79W in MIDWEST, WY)
(Integrated Compliance Information System) - ICIS-08-1995-0160, FORMAL ENFORCEMENT ACTION
HOWELL PETROLEUM SALT CREEK GAS PLANT (ONE MILE SOUTH OF MIDWEST in MIDWEST, WY)
AIR MINOR (AIRS/AFS) Business SIC classification: CRUDE PETROLEUM AND NATURAL GAS
AMOCO PRODUCTION CO (WY971158) ( in MIDWEST, WY)
National Pollutant Discharge Elimination System NON-MAJOR (Tracking pollutant discharge elimination systems) - permit Business SIC classification: CRUDE PETROLEUM AND NATURAL GAS Alternative names: AMOCO PRODUCTION COMPANY
EMPIRE SAND (CT-304) (NATRONA COUNTY in MIDWEST, WY)
AIR MINOR (AIRS/AFS) Business SIC classification: ASPHALT PAVING MIXTURES AND BLOCKS
MIDWEST FACILITY (FITZHUGH AVENUE, MIDWEST in MIDWEST, WY)
National Pollutant Discharge Elimination System NON-MAJOR (Tracking pollutant discharge elimination systems) - permit Business SIC classification: SPECIAL WAREHOUSING AND STORAGE Alternative names: M-I, LLC
MIDWEST WASTEWATER LAGOON (T40N R78W in MIDWEST, WY)
National Pollutant Discharge Elimination System NON-MAJOR (Tracking pollutant discharge elimination systems) - permit Business SIC classification: SEWERAGE SYSTEMS Alternative names: MIDWEST, TOWN OF
Housing units lacking complete plumbing facilities: 6.2% Housing units lacking complete kitchen facilities: 2.0%
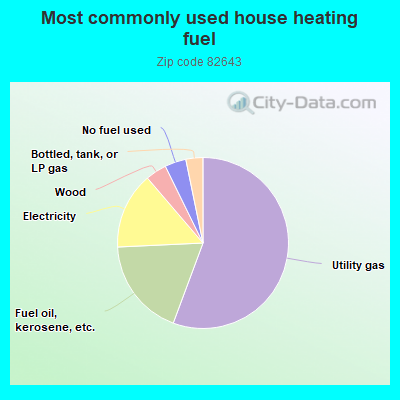
56.9%Utility gas
19.0%Fuel oil, kerosene, etc.
14.8%Electricity
4.1%Wood
4.1%No fuel used
3.3%Bottled, tank, or LP gas
Population in 1990: 756.
Place of birth for U.S.-born residents:
This state: 94
Northeast: 12
Midwest: 31
South: 19
West: 50
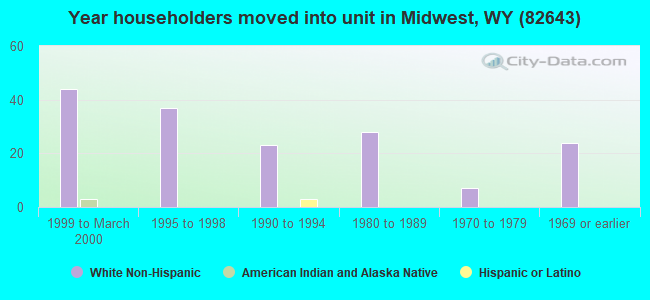
50% of the 82643 zip code residents lived in the same house 5 years ago. Out of people who lived in different houses, 40% lived in this county. Out of people who lived in different counties, 50% lived in Wyoming.
96% of the 82643 zip code residents lived in the same house 1 year ago. Out of people who lived in different houses, 71% moved from this county. Out of people who lived in different houses, 29% moved from different county within same state.
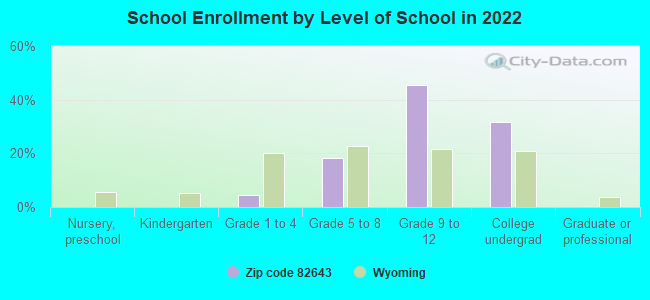
Private vs. public school enrollment:
Students in private schools in grades 1 to 8 (elementary and middle school):
Here:
7.8%
Wyoming:
7.3%
Students in private schools in grades 9 to 12 (high school):
Here:
0.0%
Wyoming:
6.0%
Students in private undergraduate colleges: 1
Here:
13.2%
Wyoming:
9.2%
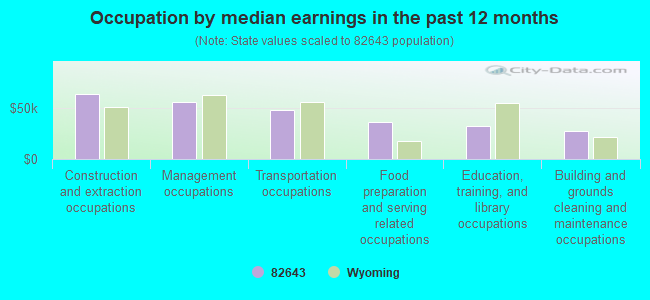
Occupation by median earnings in the past 12 months ($)
63,484Construction and extraction occupations
55,321Management occupations
47,914Transportation occupations
35,892Food preparation and serving related occupations
31,907Education, training, and library occupations
27,072Building and grounds cleaning and maintenance occupations
Top industries in this zip code by the number of employees in 2005:
Mining: Crude Petroleum and Natural Gas Extraction (50-99 employees: 1 establishment)
Mining: Support Activities for Oil and Gas Operations (5-9: 1, 1-4: 2)
Other Services (except Public Administration): Civic and Social Organizations (5-9: 1)
Accommodation and Food Services: Rooming and Boarding Houses (5-9: 1)
Professional, Scientific, and Technical Services: Marketing Consulting Services (1-4: 1)
Construction: All Other Specialty Trade Contractors (1-4: 1)
Construction: Site Preparation Contractors (1-4: 1)
Other Services (except Public Administration): Commercial and Industrial Machinery and Equipment (except Automotive and Electronic) Repair and Maintenance (1-4: 1)
Home Mortgage Disclosure Act Aggregated Statistics For Year 2009 (Based on 2 partial tracts)
A) FHA, FSA/RHS & VA Home Purchase Loans
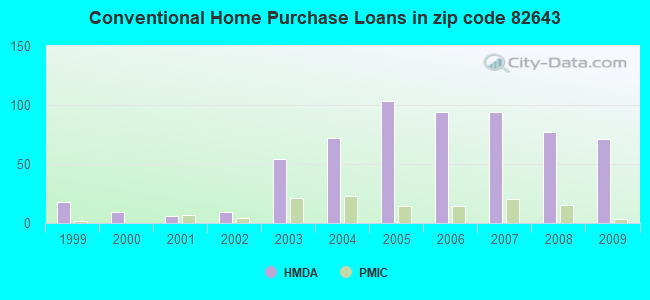
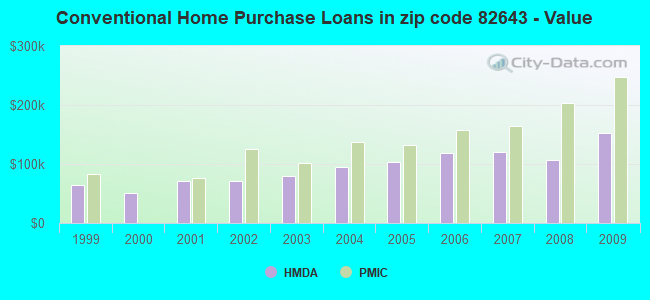
B) Conventional Home Purchase Loans
C) Refinancings
D) Home Improvement Loans
F) Non-occupant Loans on < 5 Family Dwellings (A B C & D)
G) Loans On Manufactured Home Dwelling (A B C & D)
Number
Average Value
Number
Average Value
Number
Average Value
Number
Average Value
Number
Average Value
Number
Average Value
LOANS ORIGINATED
77
$174,931
71
$152,857
108
$168,053
11
$108,700
6
$108,737
15
$112,108
APPLICATIONS APPROVED, NOT ACCEPTED
1
$144,980
2
$162,905
16
$176,198
1
$55,760
0
$0
6
$175,252
APPLICATIONS DENIED
8
$164,399
7
$130,414
29
$140,559
7
$44,951
2
$102,760
12
$116,038
APPLICATIONS WITHDRAWN
5
$164,100
1
$317,050
33
$197,436
4
$71,295
1
$164,900
5
$158,204
FILES CLOSED FOR INCOMPLETENESS
0
$0
0
$0
3
$198,353
1
$7,970
0
$0
0
$0
Aggregated Statistics For Year 2008 (Based on 2 partial tracts)
A) FHA, FSA/RHS & VA Home Purchase Loans
B) Conventional Home Purchase Loans
C) Refinancings
D) Home Improvement Loans
F) Non-occupant Loans on < 5 Family Dwellings (A B C & D)
G) Loans On Manufactured Home Dwelling (A B C & D)
Number
Average Value
Number
Average Value
Number
Average Value
Number
Average Value
Number
Average Value
Number
Average Value
LOANS ORIGINATED
39
$169,880
77
$106,641
76
$162,496
12
$65,985
8
$114,511
26
$103,160
APPLICATIONS APPROVED, NOT ACCEPTED
4
$114,710
6
$104,885
11
$130,063
2
$17,925
1
$99,580
7
$71,807
APPLICATIONS DENIED
3
$155,867
16
$159,270
52
$181,334
19
$76,683
2
$452,865
22
$101,603
APPLICATIONS WITHDRAWN
2
$132,235
4
$106,745
20
$181,346
4
$45,208
0
$0
6
$121,615
FILES CLOSED FOR INCOMPLETENESS
1
$156,930
0
$0
5
$185,608
0
$0
0
$0
0
$0
Aggregated Statistics For Year 2007 (Based on 2 partial tracts)
A) FHA, FSA/RHS & VA Home Purchase Loans
B) Conventional Home Purchase Loans
C) Refinancings
D) Home Improvement Loans
E) Loans on Dwellings For 5+ Families
F) Non-occupant Loans on < 5 Family Dwellings (A B C & D)
G) Loans On Manufactured Home Dwelling (A B C & D)
Number
Average Value
Number
Average Value
Number
Average Value
Number
Average Value
Number
Average Value
Number
Average Value
Number
Average Value
LOANS ORIGINATED
16
$176,646
94
$119,999
69
$141,275
24
$53,240
1
$869,890
5
$64,366
32
$81,353
APPLICATIONS APPROVED, NOT ACCEPTED
1
$151,350
17
$132,376
10
$143,468
2
$126,260
0
$0
0
$0
6
$132,502
APPLICATIONS DENIED
5
$110,886
30
$149,150
53
$128,989
29
$71,117
0
$0
3
$117,367
22
$89,436
APPLICATIONS WITHDRAWN
2
$48,195
16
$145,728
20
$135,860
2
$71,295
0
$0
1
$38,240
3
$195,433
FILES CLOSED FOR INCOMPLETENESS
0
$0
1
$155,340
5
$158,364
2
$25,095
0
$0
0
$0
2
$152,550
Aggregated Statistics For Year 2006 (Based on 2 partial tracts)
A) FHA, FSA/RHS & VA Home Purchase Loans
B) Conventional Home Purchase Loans
C) Refinancings
D) Home Improvement Loans
F) Non-occupant Loans on < 5 Family Dwellings (A B C & D)
G) Loans On Manufactured Home Dwelling (A B C & D)
Number
Average Value
Number
Average Value
Number
Average Value
Number
Average Value
Number
Average Value
Number
Average Value
LOANS ORIGINATED
11
$140,419
94
$119,143
65
$111,610
22
$36,064
5
$101,646
23
$97,843
APPLICATIONS APPROVED, NOT ACCEPTED
0
$0
10
$101,487
14
$132,349
7
$15,931
0
$0
4
$88,422
APPLICATIONS DENIED
1
$131,440
25
$116,272
53
$113,388
20
$50,704
2
$110,725
18
$76,076
APPLICATIONS WITHDRAWN
2
$127,855
6
$246,415
26
$122,615
7
$69,646
3
$339,883
1
$112,320
FILES CLOSED FOR INCOMPLETENESS
0
$0
2
$86,830
6
$140,865
1
$19,910
0
$0
0
$0
Aggregated Statistics For Year 2005 (Based on 2 partial tracts)
A) FHA, FSA/RHS & VA Home Purchase Loans
B) Conventional Home Purchase Loans
C) Refinancings
D) Home Improvement Loans
F) Non-occupant Loans on < 5 Family Dwellings (A B C & D)
G) Loans On Manufactured Home Dwelling (A B C & D)
Number
Average Value
Number
Average Value
Number
Average Value
Number
Average Value
Number
Average Value
Number
Average Value
LOANS ORIGINATED
11
$125,718
103
$103,751
71
$102,301
11
$27,446
6
$89,750
22
$81,253
APPLICATIONS APPROVED, NOT ACCEPTED
1
$97,980
18
$88,290
15
$94,211
2
$21,905
5
$110,728
6
$73,155
APPLICATIONS DENIED
1
$94,000
28
$92,434
68
$94,784
16
$40,129
2
$112,320
14
$61,850
APPLICATIONS WITHDRAWN
2
$137,015
23
$109,965
24
$107,541
3
$87,890
0
$0
3
$97,983
FILES CLOSED FOR INCOMPLETENESS
0
$0
5
$80,298
4
$101,965
0
$0
0
$0
1
$55,760
Aggregated Statistics For Year 2004 (Based on 2 partial tracts)
A) FHA, FSA/RHS & VA Home Purchase Loans
B) Conventional Home Purchase Loans
C) Refinancings
D) Home Improvement Loans
F) Non-occupant Loans on < 5 Family Dwellings (A B C & D)
G) Loans On Manufactured Home Dwelling (A B C & D)
Number
Average Value
Number
Average Value
Number
Average Value
Number
Average Value
Number
Average Value
Number
Average Value
LOANS ORIGINATED
9
$111,259
72
$95,636
68
$86,525
10
$28,598
6
$63,595
23
$95,003
APPLICATIONS APPROVED, NOT ACCEPTED
0
$0
10
$68,030
12
$111,723
2
$35,845
0
$0
4
$80,655
APPLICATIONS DENIED
0
$0
20
$94,556
67
$93,868
10
$39,830
1
$186,400
24
$85,037
APPLICATIONS WITHDRAWN
0
$0
10
$99,336
29
$85,758
3
$72,757
0
$0
6
$79,128
FILES CLOSED FOR INCOMPLETENESS
0
$0
2
$158,525
5
$159,638
1
$19,910
1
$43,810
0
$0
Aggregated Statistics For Year 2003 (Based on 2 partial tracts)
A) FHA, FSA/RHS & VA Home Purchase Loans
B) Conventional Home Purchase Loans
C) Refinancings
D) Home Improvement Loans
E) Loans on Dwellings For 5+ Families
F) Non-occupant Loans on < 5 Family Dwellings (A B C & D)
Number
Average Value
Number
Average Value
Number
Average Value
Number
Average Value
Number
Average Value
Number
Average Value
LOANS ORIGINATED
12
$116,636
54
$78,981
87
$75,723
8
$23,699
1
$23,900
2
$86,035
APPLICATIONS APPROVED, NOT ACCEPTED
1
$121,880
10
$82,209
12
$79,926
3
$32,130
0
$0
0
$0
APPLICATIONS DENIED
1
$79,660
16
$56,210
57
$74,741
8
$14,040
0
$0
2
$10,355
APPLICATIONS WITHDRAWN
3
$125,333
5
$93,362
44
$80,348
0
$0
0
$0
0
$0
FILES CLOSED FOR INCOMPLETENESS
0
$0
1
$80,460
4
$71,295
0
$0
0
$0
0
$0
Aggregated Statistics For Year 2002 (Based on 2 partial tracts)
A) FHA, FSA/RHS & VA Home Purchase Loans
B) Conventional Home Purchase Loans
C) Refinancings
D) Home Improvement Loans
F) Non-occupant Loans on < 5 Family Dwellings (A B C & D)
Number
Average Value
Number
Average Value
Number
Average Value
Number
Average Value
Number
Average Value
LOANS ORIGINATED
2
$111,125
9
$71,871
28
$85,236
2
$2,390
2
$82,845
APPLICATIONS APPROVED, NOT ACCEPTED
0
$0
4
$84,042
8
$76,772
2
$8,765
0
$0
APPLICATIONS DENIED
0
$0
9
$46,557
13
$68,262
1
$124,270
0
$0
APPLICATIONS WITHDRAWN
1
$27,080
0
$0
11
$87,698
1
$15,930
0
$0
FILES CLOSED FOR INCOMPLETENESS
0
$0
1
$64,520
2
$64,525
0
$0
0
$0
Aggregated Statistics For Year 2001 (Based on 2 partial tracts)
A) FHA, FSA/RHS & VA Home Purchase Loans
B) Conventional Home Purchase Loans
C) Refinancings
D) Home Improvement Loans
F) Non-occupant Loans on < 5 Family Dwellings (A B C & D)
Number
Average Value
Number
Average Value
Number
Average Value
Number
Average Value
Number
Average Value
LOANS ORIGINATED
1
$47,000
6
$71,428
20
$71,455
2
$26,685
1
$20,710
APPLICATIONS APPROVED, NOT ACCEPTED
0
$0
2
$60,940
6
$89,750
1
$23,900
0
$0
APPLICATIONS DENIED
0
$0
6
$54,965
22
$89,002
0
$0
1
$63,730
APPLICATIONS WITHDRAWN
0
$0
2
$68,905
12
$63,993
0
$0
0
$0
FILES CLOSED FOR INCOMPLETENESS
0
$0
0
$0
2
$97,980
0
$0
0
$0
Aggregated Statistics For Year 2000 (Based on 2 partial tracts)
A) FHA, FSA/RHS & VA Home Purchase Loans
B) Conventional Home Purchase Loans
C) Refinancings
D) Home Improvement Loans
F) Non-occupant Loans on < 5 Family Dwellings (A B C & D)
Number
Average Value
Number
Average Value
Number
Average Value
Number
Average Value
Number
Average Value
LOANS ORIGINATED
1
$73,290
9
$51,071
10
$124,987
3
$10,620
1
$39,830
APPLICATIONS APPROVED, NOT ACCEPTED
0
$0
3
$52,310
1
$15,930
2
$19,915
0
$0
APPLICATIONS DENIED
1
$47,000
8
$60,242
10
$56,160
3
$16,993
2
$66,120
APPLICATIONS WITHDRAWN
0
$0
2
$130,245
5
$48,274
0
$0
0
$0
FILES CLOSED FOR INCOMPLETENESS
0
$0
0
$0
1
$39,830
0
$0
0
$0
Aggregated Statistics For Year 1999 (Based on 2 partial tracts)
A) FHA, FSA/RHS & VA Home Purchase Loans
B) Conventional Home Purchase Loans
C) Refinancings
D) Home Improvement Loans
F) Non-occupant Loans on < 5 Family Dwellings (A B C & D)


 Nearest zip codes: 82635, 82640, 82601, 82639, 82636, 82644.