Estimated zip code population in 2022: 11,078 Zip code population in 2010: 9,246 Zip code population in 2000: 8,194
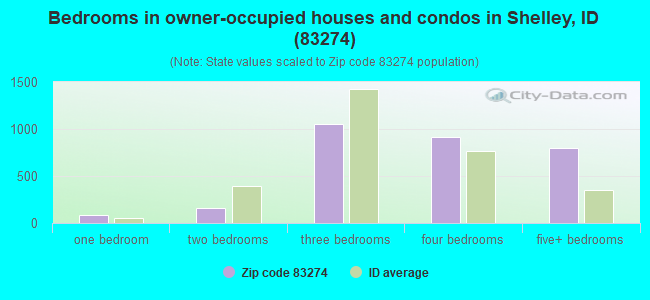
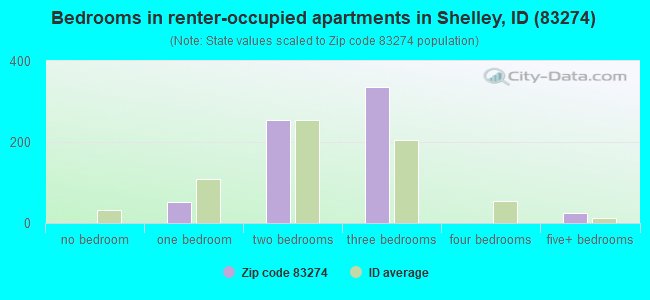
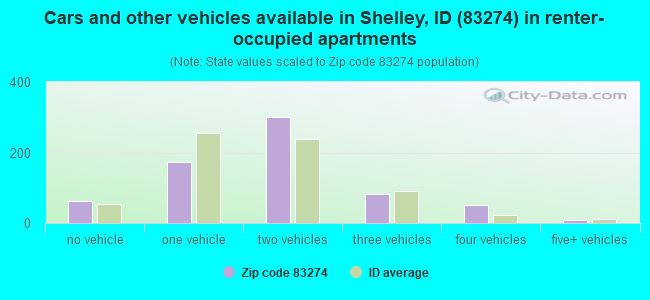
Houses and condos: 3,873 Renter-occupied apartments: 672
% of renters here:
18%
State:
28%
March 2022 cost of living index in zip code 83274: 88.2 (less than average, U.S. average is 100)
Land area: 91.1 sq. mi. Water area: 0.6 sq. mi.
Population density: 122 people per square mile
(very low).
OSM Map
General Map
Google Map
MSN Map
OSM Map
General Map
Google Map
MSN Map
OSM Map
General Map
Google Map
MSN Map
OSM Map
General Map
Google Map
MSN Map
Please wait while loading the map...
Real estate property taxes paid for housing units in 2022:
This zip code:
0.4% ($1,409)
Idaho:
0.5% ($1,995)
Median real estate property taxes paid for housing units with mortgages in 2022: $1,521 (0.4%) Median real estate property taxes paid for housing units with no mortgage in 2022: $1,161 (0.3%)
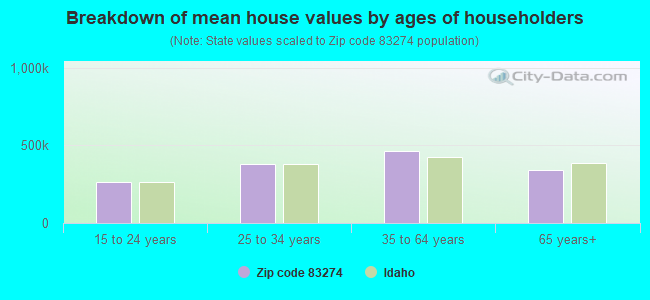
Estimated median house/condo value in 2022: $395,980
83274:
$395,980
Idaho:
$432,500
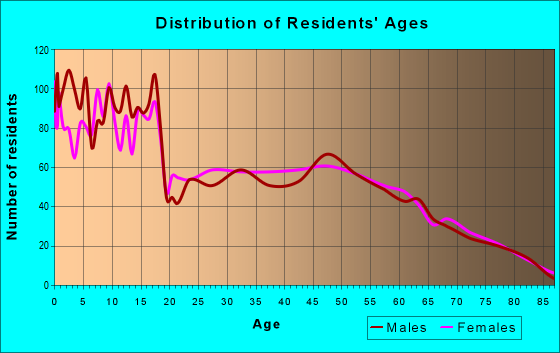
Median resident age:
This zip code:
36.7 years
Idaho median age:
37.5 years
Average household size:
This zip code:
3.0 people
Idaho:
2.6 people
Averages for the 2020 tax year for zip code 83274, filed in 2021:
Average Adjusted Gross Income (AGI) in 2020: $66,559 (Individual Income Tax Returns)
Here:
$66,559
State:
$73,627
Salary/wage: $54,950 (reported on 85.2% of returns)
Here:
$54,950
State:
$55,245
(% of AGI for various income ranges: 1297.3% for AGIs below $25k, 3935.3% for AGIs $25k-50k, 6988.1% for AGIs $50k-75k, 10291.5% for AGIs $75k-100k, 17677.4% for AGIs $100k-200k, 63198.0% for AGIs over 200k)
Taxable interest for individuals: $1,827 (reported on 26.5% of returns)
This zip code:
$1,827
Idaho:
$2,230
(% of AGI for various income ranges: 12.1% for AGIs below $25k, 22.2% for AGIs $25k-50k, 36.4% for AGIs $50k-75k, 69.4% for AGIs $75k-100k, 126.8% for AGIs $100k-200k, 1992.0% for AGIs over 200k)
Ordinary dividends: $4,865 (reported on 13.7% of returns)
Here:
$4,865
State:
$7,088
(% of AGI for various income ranges: 11.3% for AGIs below $25k, 19.1% for AGIs $25k-50k, 31.1% for AGIs $50k-75k, 41.5% for AGIs $75k-100k, 70.0% for AGIs $100k-200k, 4378.0% for AGIs over 200k)
Net capital gain/loss in AGI: +$21,193 (reported on 14.8% of returns)
Here:
+$21,193
State:
+$37,284
(% of AGI for various income ranges: 5.6% for AGIs below $25k, 25.7% for AGIs $25k-50k, 54.5% for AGIs $50k-75k, 232.4% for AGIs $75k-100k, 517.4% for AGIs $100k-200k, 21840.0% for AGIs over 200k)
Profit/loss from business: +$6,450 (reported on 17.7% of returns)
Here:
+$6,450
State:
+$12,955
(% of AGI for various income ranges: 76.6% for AGIs below $25k, 141.0% for AGIs $25k-50k, 270.0% for AGIs $50k-75k, 215.0% for AGIs $75k-100k, 274.2% for AGIs $100k-200k, 344.0% for AGIs over 200k)
Taxable individual retirement arrangement distribution: $15,439 (reported on 7.3% of returns)
83274:
$15,439
Idaho:
$20,110
(% of AGI for various income ranges: 47.3% for AGIs below $25k, 89.4% for AGIs $25k-50k, 95.5% for AGIs $50k-75k, 225.0% for AGIs $75k-100k, 531.1% for AGIs $100k-200k, 1284.0% for AGIs over 200k)
Total itemized deductions: $38,817 (reported on 9.3% of returns)
Here:
$38,817
State:
$38,402
(% of AGI for various income ranges: 73.0% for AGIs below $25k, 210.6% for AGIs $50k-75k, 474.1% for AGIs $75k-100k, 1543.2% for AGIs $100k-200k, 14140.0% for AGIs over 200k)
Charity contributions: $20,182 (reported on 8.6% of returns)
Here:
$20,182
State:
$18,314
(% of AGI for various income ranges: 96.4% for AGIs $50k-75k, 192.9% for AGIs $75k-100k, 696.8% for AGIs $100k-200k, 8228.0% for AGIs over 200k)
Taxes paid: $7,500 (reported on 9.3% of returns)
83274:
$7,500
State:
$7,596
(% of AGI for various income ranges: 7.5% for AGIs below $25k, 35.3% for AGIs $50k-75k, 80.3% for AGIs $75k-100k, 396.6% for AGIs $100k-200k, 2250.0% for AGIs over 200k)
Earned income credit: $2,382 (reported on 16.1% of returns)
Here:
$2,382
State:
$2,195
(% of AGI for various income ranges: 87.0% for AGIs below $25k, 98.3% for AGIs $25k-50k, 6.2% for AGIs $50k-75k)
Percentage of individuals using paid preparers for their 2020 taxes: 94.0%
Here:
94%
State:
94%
(% for various income ranges: 93.2% for AGIs below $25k, 92.5% for AGIs $25k-50k, 95.5% for AGIs $50k-75k, 94.0% for AGIs $75k-100k, 95.4% for AGIs $100k-200k, 100.0% for AGIs over 200k)
Averages for the 2012 tax year for zip code 83274, filed in 2013:
Average Adjusted Gross Income (AGI) in 2012: $50,251 (Individual Income Tax Returns)
Here:
$50,251
State:
$52,536
Salary/wage: $40,959 (reported on 87.7% of returns)
Here:
$40,959
State:
$41,938
(% of AGI for various income ranges: 79.7% for AGIs below $25k, 80.5% for AGIs $25k-50k, 81.6% for AGIs $50k-75k, 79.9% for AGIs $75k-100k, 72.9% for AGIs $100k-200k, 29.0% for AGIs over 200k)
Taxable interest for individuals: $1,248 (reported on 30.1% of returns)
This zip code:
$1,248
Idaho:
$1,874
(% of AGI for various income ranges: 1.0% for AGIs below $25k, 0.5% for AGIs $25k-50k, 0.4% for AGIs $50k-75k, 1.0% for AGIs $75k-100k, 1.0% for AGIs $100k-200k, 0.6% for AGIs over 200k)
Ordinary dividends: $1,927 (reported on 13.1% of returns)
Here:
$1,927
State:
$5,706
(% of AGI for various income ranges: 1.0% for AGIs below $25k, 0.3% for AGIs $25k-50k, 0.3% for AGIs $50k-75k, 0.4% for AGIs $75k-100k, 0.5% for AGIs $100k-200k, 0.8% for AGIs over 200k)
Net capital gain/loss in AGI: +$6,020 (reported on 12.3% of returns)
Here:
+$6,020
State:
+$14,571
(% of AGI for various income ranges: 0.1% for AGIs below $25k, 0.4% for AGIs $25k-50k, 0.6% for AGIs $50k-75k, 1.2% for AGIs $75k-100k, 2.7% for AGIs $100k-200k, 3.4% for AGIs over 200k)
Profit/loss from business: +$6,995 (reported on 16.7% of returns)
Here:
+$6,995
State:
+$10,113
(% of AGI for various income ranges: 4.1% for AGIs below $25k, 3.2% for AGIs $25k-50k, 1.5% for AGIs $50k-75k, 1.0% for AGIs $75k-100k, 4.2% for AGIs $100k-200k)
Taxable individual retirement arrangement distribution: $10,507 (reported on 8.2% of returns)
83274:
$10,507
Idaho:
$14,642
(% of AGI for various income ranges: 2.4% for AGIs below $25k, 2.1% for AGIs $25k-50k, 2.1% for AGIs $50k-75k, 1.8% for AGIs $75k-100k, 1.9% for AGIs $100k-200k)
Total itemized deductions: $21,273 (23% of AGI, reported on 33.3% of returns)
Here:
$21,273
State:
$22,697
Here:
23.0% of AGI
State:
22.0% of AGI
(% of AGI for various income ranges: 8.1% for AGIs below $25k, 10.4% for AGIs $25k-50k, 15.3% for AGIs $50k-75k, 17.1% for AGIs $75k-100k, 18.5% for AGIs $100k-200k, 11.1% for AGIs over 200k)
Charity contributions: $7,455 (reported on 29.5% of returns)
Here:
$7,455
State:
$5,246
(% of AGI for various income ranges: 1.7% for AGIs below $25k, 2.5% for AGIs $25k-50k, 4.5% for AGIs $50k-75k, 5.7% for AGIs $75k-100k, 6.1% for AGIs $100k-200k, 4.3% for AGIs over 200k)
Taxes paid: $5,552 (reported on 33.3% of returns)
83274:
$5,552
State:
$7,139
(% of AGI for various income ranges: 1.2% for AGIs below $25k, 1.8% for AGIs $25k-50k, 3.0% for AGIs $50k-75k, 4.1% for AGIs $75k-100k, 5.6% for AGIs $100k-200k, 5.4% for AGIs over 200k)
Earned income credit: $2,439 (reported on 22.4% of returns)
Here:
$2,439
State:
$2,213
(% of AGI for various income ranges: 7.6% for AGIs below $25k, 2.1% for AGIs $25k-50k)
Percentage of individuals using paid preparers for their 2012 taxes: 51.1%
Here:
51%
State:
52%
(% for various income ranges: 45.1% for AGIs below $25k, 50.5% for AGIs $25k-50k, 55.0% for AGIs $50k-75k, 57.1% for AGIs $75k-100k, 58.1% for AGIs $100k-200k, 100.0% for AGIs over 200k)
Averages for the 2004 tax year for zip code 83274, filed in 2005:
Average Adjusted Gross Income (AGI) in 2004: $37,634 (Individual Income Tax Returns)
Here:
$37,634
State:
$42,679
Salary/wage: $33,348 (reported on 88.6% of returns)
Here:
$33,348
State:
$35,636
(% of AGI for various income ranges: 119.9% for AGIs below $10k, 80.5% for AGIs $10k-25k, 84.3% for AGIs $25k-50k, 87.5% for AGIs $50k-75k, 84.8% for AGIs $75k-100k, 49.5% for AGIs over 100k)
Taxable interest for individuals: $1,276 (reported on 38.0% of returns)
This zip code:
$1,276
Idaho:
$2,024
(% of AGI for various income ranges: 7.9% for AGIs below $10k, 1.5% for AGIs $10k-25k, 1.0% for AGIs $25k-50k, 0.6% for AGIs $50k-75k, 0.3% for AGIs $75k-100k, 2.3% for AGIs over 100k)
Taxable dividends: $1,153 (reported on 16.0% of returns)
Here:
$1,153
State:
$2,917
(% of AGI for various income ranges: 2.0% for AGIs below $10k, 0.5% for AGIs $10k-25k, 0.3% for AGIs $25k-50k, 0.4% for AGIs $50k-75k, 0.3% for AGIs $75k-100k, 0.8% for AGIs over 100k)
Net capital gain/loss: +$6,985 (reported on 16.2% of returns)
Here:
+$6,985
State:
+$13,146
(% of AGI for various income ranges: 1.0% for AGIs below $10k, 1.0% for AGIs $10k-25k, 0.9% for AGIs $25k-50k, 0.8% for AGIs $50k-75k, 1.2% for AGIs $75k-100k, 11.2% for AGIs over 100k)
Profit/loss from business: +$4,666 (reported on 18.2% of returns)
Here:
+$4,666
State:
+$8,765
(% of AGI for various income ranges: 4.0% for AGIs below $10k, 4.5% for AGIs $10k-25k, 1.7% for AGIs $25k-50k, 0.5% for AGIs $50k-75k, 3.4% for AGIs $75k-100k, 2.8% for AGIs over 100k)
IRA payment deduction: $2,940 (reported on 2.0% of returns)
83274:
$2,940
Idaho:
$3,020
Self-employed pension: $8,545 (reported on 0.3% of returns)
Here:
$8,545
Idaho:
$14,427
Total itemized deductions: $16,846 (25% of AGI, reported on 33.6% of returns)
Here:
$16,846
State:
$18,385
Here:
24.7% of AGI
State:
23.1% of AGI
(% of AGI for various income ranges: 11.7% for AGIs below $10k, 9.5% for AGIs $10k-25k, 14.3% for AGIs $25k-50k, 17.8% for AGIs $50k-75k, 18.7% for AGIs $75k-100k, 13.4% for AGIs over 100k)
Charity contributions deductions: $5,616 (8% of AGI, reported on 31.0% of returns)
Here:
$5,616
State:
$3,875
Here:
8.0% of AGI
State:
4.6% of AGI
(% of AGI for various income ranges: 2.0% for AGIs below $10k, 1.9% for AGIs $10k-25k, 3.8% for AGIs $25k-50k, 5.3% for AGIs $50k-75k, 6.4% for AGIs $75k-100k, 5.3% for AGIs over 100k)
Total tax: $4,621 (reported on 67.2% of returns)
83274:
$4,621
State:
$6,282
(% of AGI for various income ranges: 2.8% for AGIs below $10k, 3.6% for AGIs $10k-25k, 4.4% for AGIs $25k-50k, 6.2% for AGIs $50k-75k, 8.9% for AGIs $75k-100k, 18.4% for AGIs over 100k)
Earned income credit: $1,817 (reported on 17.7% of returns)
Here:
$1,817
State:
$1,660
Percentage of individuals using paid preparers for their 2004 taxes: 56.4%
Here:
56%
State:
59%
(% for various income ranges: 44.3% for AGIs below $10k, 56.5% for AGIs $10k-25k, 61.0% for AGIs $25k-50k, 61.9% for AGIs $50k-75k, 57.3% for AGIs $75k-100k, 69.4% for AGIs over 100k)
Household received Food Stamps/SNAP in the past 12 months: 387 Household did not receive Food Stamps/SNAP in the past 12 months: 3,268
Women who had a birth in the past 12 months: 175 (126 now married, 50 unmarried) Women who did not have a birth in the past 12 months: 2,569 (1,516 now married, 1,064 unmarried)
Housing units in zip code 83274 with a mortgage: 1,967 (269 second mortgage, 217 both second mortgage and home equity loan) Houses without a mortgage: 97
Median monthly owner costs for units with a mortgage: $1,403 Median monthly owner costs for units without a mortgage: $381
Residents with income below the poverty level in 2022:
This zip code:
5.6%
Whole state:
10.7%
Residents with income below 50% of the poverty level in 2022:
This zip code:
3.1%
Whole state:
6.1%
Median number of rooms in houses and condos:
Here:
7.3
State:
6.5
Median number of rooms in apartments:
Here:
5.4
State:
4.4
Notable locations in this zip code not listed on our city pages
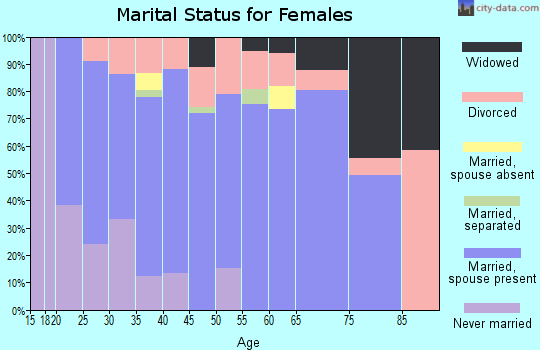
2,350 married couples with children.
257 single-parent households (106 men, 151 women).
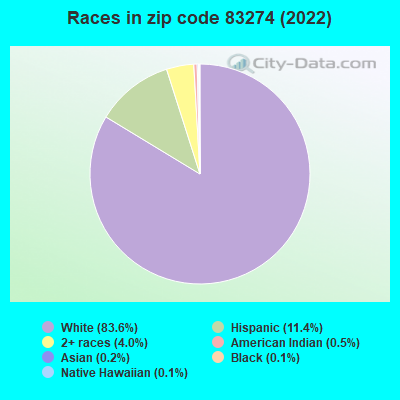
87.8% of residents of 83274 zip code speak English at home.
10.0% of residents speak Spanish at home (61% very well, 20% well, 5% not well, 14% not at all).
0.8% of residents speak other Indo-European language at home (42% very well, 58% not well).
0.9% of residents speak Asian or Pacific Island language at home (100% very well).
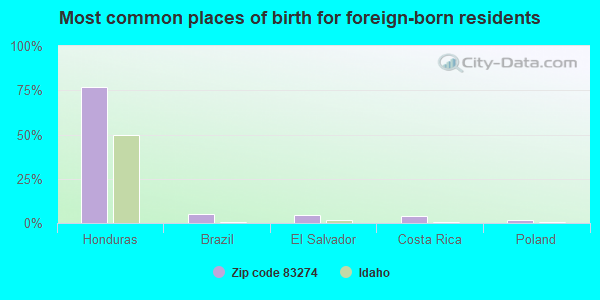
Foreign born population: 582 (5.3%) (35.9% of them are naturalized citizens)
This zip code:
5.3%
Whole state:
6.0%
77%Honduras
5%Brazil
4%El Salvador
4%Costa Rica
1%Poland
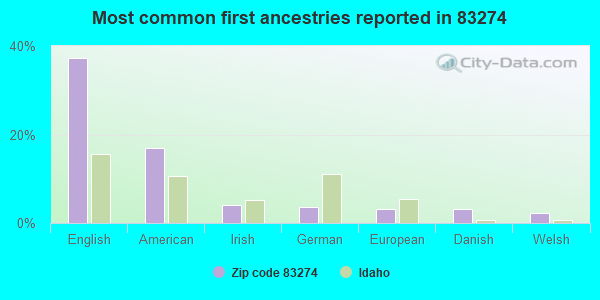
37%English
17%American
4%Irish
4%German
3%European
3%Danish
2%Welsh
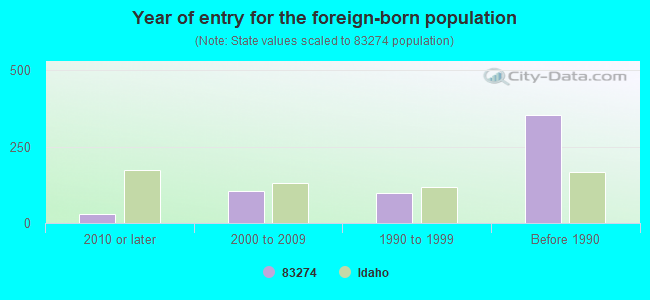
Year of entry for the foreign-born population
282010 or later
1062000 to 2009
991990 to 1999
354Before 1990
Major facilities with environmental interests located in this zip code:
DEAN GOODSELL PRIMARY SCHOOL (185 WEST CENTER STREET in SHELLEY, ID)
(Geographic Names Information System) (National Center for Education Statistics) - STATE ID-060 103 Organizations: SHELLEY JOINT SCHOOL DISTRICT 60 (SCHOOL DISTRICT)
DONALD J HOBBS MIDDLE SCHOOL (350 EAST PINE STREET in SHELLEY, ID)
(Geographic Names Information System) (National Center for Education Statistics) - STATE ID-060 601 Organizations: SHELLEY JOINT SCHOOL DISTRICT 60 (SCHOOL DISTRICT)
HAZEL STUART ELEMENTARY SCHOOL (475 WEST CENTER STREET in SHELLEY, ID)
(Geographic Names Information System) (National Center for Education Statistics) - STATE ID-060 104 Organizations: SHELLEY JOINT SCHOOL DISTRICT 60 (SCHOOL DISTRICT)
SHELLEY JUNIOR HIGH SCHOOL (200 EAST FIR STREET in SHELLEY, ID)
(Geographic Names Information System) (National Center for Education Statistics) - STATE ID-060 201 Organizations: SHELLEY JOINT SCHOOL DISTRICT 60 (SCHOOL DISTRICT)
SHELLEY SENIOR HIGH SCHOOL (570 WEST FIR STREET in SHELLEY, ID)
(Geographic Names Information System) (National Center for Education Statistics) - STATE ID-060 301 Organizations: SHELLEY JOINT SCHOOL DISTRICT 60 (SCHOOL DISTRICT)
SOUTH PARK WATER AND SEWER (1449 N 1880 EAST in SHELLEY, ID)
(Integrated Compliance Information System) - ICIS-10-1995-0133, FORMAL ENFORCEMENT ACTION COMMUNITY WATER SYSTEM (SDWIS)
BASIC AMERICAN FOODS (434 SOUTH EMERSON AVENUE in SHELLEY, ID)
AIR MAJOR (AIRS/AFS) COMPLIANCE ACTIVITY (Tracking inspections of insecticide, fungicide, and rodenticide, and toxic substances) CRITERIA AND HAZARDOUS AIR POLLUTANT INVENTORY (Inventory of air pollution sources) Conditionally Exempt Small Quantity Generators, less than 100 kg/month of hazardous waste (Resource Conservation and Recovery Act (tracking hazardous waste)) - notification TRI REPORTER (Tracking of toxic chemicals releasing facilities) Business SIC classification: DRIED AND DEHYDRATED FRUITS, VEGETABLES, AND SOUP MIXES Organizations: THE PILLSBURY COMPANY (CONTACT/OWNER)
Alternative names: PILLSBURY CO., PILLSBURY CO SHELLEY
LENT'S SINCLAIR (648 S STATE ST in SHELLEY, ID)
(Integrated Compliance Information System) - ICIS-10-1999-0013, FORMAL ENFORCEMENT ACTION
JESS DYE (202 W FIR in SHELLEY, ID)
AIR MINOR (AIRS/AFS) Business SIC classification: FARM MACHINERY AND EQUIPMENT
KRIS KELLEY PROPERTY (1275 N 0.2 MI E OF I-15 in SHELLEY, ID)
AIR MINOR (AIRS/AFS) Business SIC classification: CASH GRAINS
SHELLEY JT SD (545 SEMINARY AVE in SHELLEY, ID)
COMPLIANCE ACTIVITY (Tracking inspections of insecticide, fungicide, and rodenticide, and toxic substances) Alternative names: SHELLEY JT SD 60
SIEMS ENTERPRISES (178 S EMERSON AVE in SHELLEY, ID)
AIR MINOR (AIRS/AFS) Business SIC classification: TRUCK TRAILERS
SIMPLOT SOILBUILDERS SHELLEY (1400 N 864 E in SHELLEY, ID)
Conditionally Exempt Small Quantity Generators, less than 100 kg/month of hazardous waste (Resource Conservation and Recovery Act (tracking hazardous waste)) - notification HAZARDOUS WASTE BIENNIAL REPORTER (Resource Conservation and Recovery Act (tracking hazardous waste)) Organizations: JR SIMPLOT COMPANY (CONTACT/OWNER)
Alternative names: SIMPLOT SOILBUILDERS SHELLEY SITE
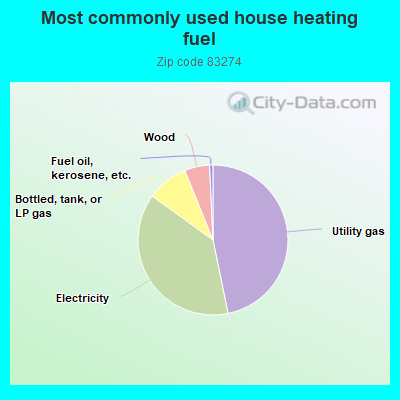
46.7%Utility gas
38.1%Electricity
8.9%Bottled, tank, or LP gas
5.4%Wood
0.7%Fuel oil, kerosene, etc.
Population in 1990: 6,164. Population change in the 1990s: +2,030 (+32.9%).
Place of birth for U.S.-born residents:
This state: 7,323
Northeast: 194
Midwest: 385
South: 443
West: 1,953
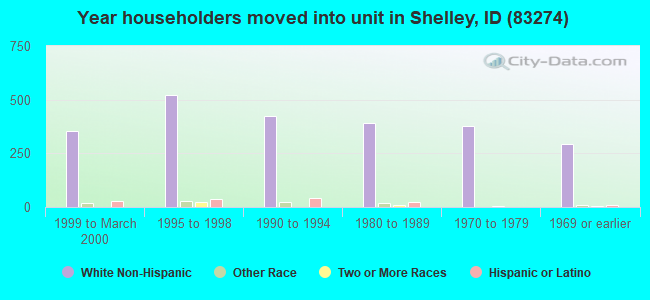
65% of the 83274 zip code residents lived in the same house 5 years ago. Out of people who lived in different houses, 51% lived in this county. Out of people who lived in different counties, 50% lived in Idaho.
91% of the 83274 zip code residents lived in the same house 1 year ago. Out of people who lived in different houses, 64% moved from this county. Out of people who lived in different houses, 18% moved from different county within same state. Out of people who lived in different houses, 18% moved from different state.
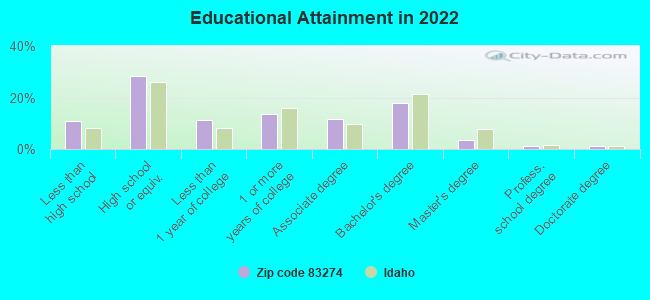
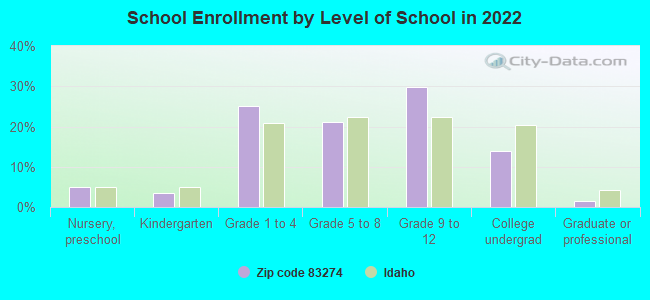
Private vs. public school enrollment:
Students in private schools in grades 1 to 8 (elementary and middle school): 88
Here:
7.1%
Idaho:
13.5%
Students in private schools in grades 9 to 12 (high school): 47
Here:
5.8%
Idaho:
8.5%
Students in private undergraduate colleges: 5
Here:
1.5%
Idaho:
30.0%
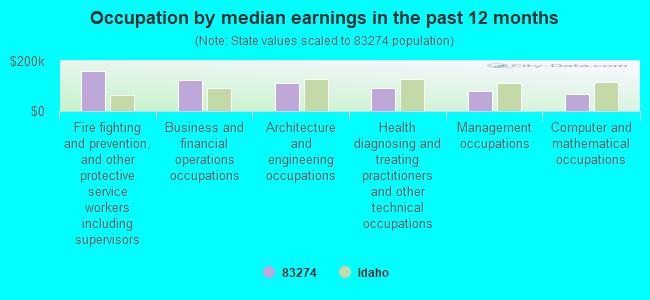
Occupation by median earnings in the past 12 months ($)
161,713Fire fighting and prevention, and other protective service workers including supervisors
122,117Business and financial operations occupations
113,677Architecture and engineering occupations
92,542Health diagnosing and treating practitioners and other technical occupations
79,810Management occupations
68,414Computer and mathematical occupations
Top industries in this zip code by the number of employees in 2005:
Wholesale Trade: Fresh Fruit and Vegetable Merchant Wholesalers (100-249 employees: 1 establishment)
Construction: Poured Concrete Foundation and Structure Contractors (10-19: 2, 1-4: 3)
Utilities: Electric Power Distribution (20-49: 1)
People in group quarters in 2000:
42 people in other noninstitutional group quarters
3 people in homes for the mentally ill
Fatal accident statistics in 2014:
Fatal accident count: 2
Vehicles involved in fatal accidents: 3
Fatal accidents caused by drunken drivers: 1
Fatalities: 3
Persons involved in fatal accidents: 3
Pedestrians involved in fatal accidents: 0
Fatal accident statistics in 2011:
Fatal accident count: 1
Vehicles involved in fatal accidents: 1
Fatal accidents caused by drunken drivers: 0
Fatalities: 1
Persons involved in fatal accidents: 2
Pedestrians involved in fatal accidents: 0
2002 - 2018 National Fire Incident Reporting System (NFIRS) incidents
According to the data from the years 2002 - 2018 the average number of fires per year is 27. The highest number of fire incidents - 43 took place in 2012, and the least - 8 in 2010. The data has a growing trend.
When looking into fire subcategories, the most reports belonged to: Outside Fires (53.2%), and Structure Fires (30.5%).
Fire incident types reported to NFIRS in Zip Code 83274
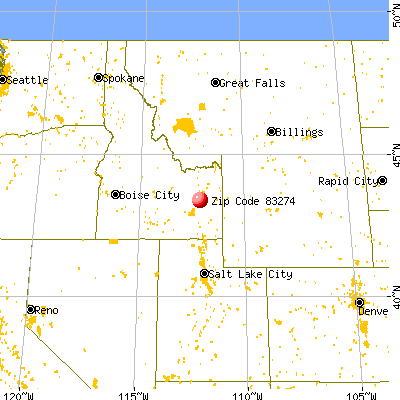


 Nearest zip codes: 83218, 83404, 83402, 83427, 83236, 83454.


 According to the data from the years 2002 - 2018 the average number of fires per year is 27. The highest number of fire incidents - 43 took place in 2012, and the least - 8 in 2010. The data has a growing trend.
 When looking into fire subcategories, the most reports belonged to: Outside Fires (53.2%), and Structure Fires (30.5%).