Estimated zip code population in 2022: 7,166 Zip code population in 2010: 6,599 Zip code population in 2000: 5,962
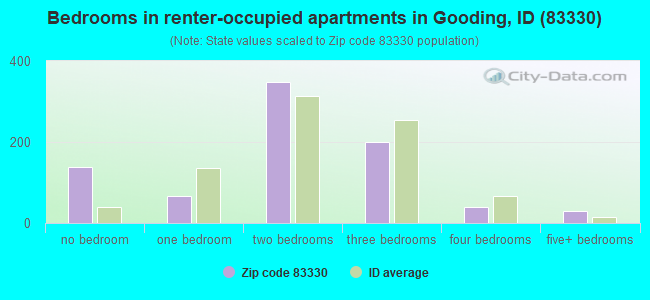
Houses and condos: 2,723 Renter-occupied apartments: 829
% of renters here:
32%
State:
28%
March 2022 cost of living index in zip code 83330: 86.1 (less than average, U.S. average is 100)
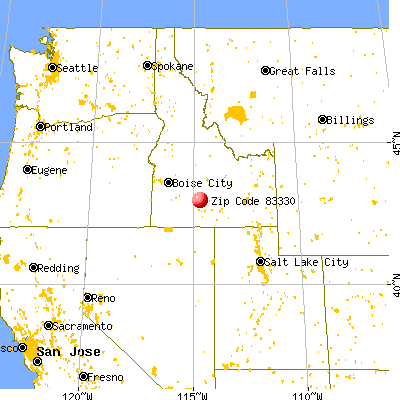
Land area: 117.5 sq. mi. Water area: 0.8 sq. mi.
Population density: 61 people per square mile
(very low).
OSM Map
General Map
Google Map
MSN Map
OSM Map
General Map
Google Map
MSN Map
OSM Map
General Map
Google Map
MSN Map
OSM Map
General Map
Google Map
MSN Map
Please wait while loading the map...
Real estate property taxes paid for housing units in 2022:
This zip code:
0.5% ($1,169)
Idaho:
0.5% ($1,995)
Median real estate property taxes paid for housing units with mortgages in 2022: $1,234 (0.5%) Median real estate property taxes paid for housing units with no mortgage in 2022: $1,027 (0.5%)
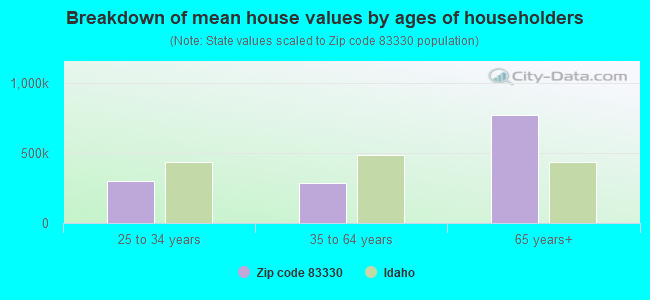
Estimated median house/condo value in 2022: $233,988
83330:
$233,988
Idaho:
$432,500
According to our research of Idaho and other state lists, there were 2 registered sex offenders living in 83330 zip code as of April 19, 2024. The ratio of all residents to sex offenders in zip code 83330 is 3,353 to 1. The ratio of registered sex offenders to all residents in this zip code is much lower than the state average.
Median resident age:
This zip code:
40.8 years
Idaho median age:
37.5 years
Average household size:
This zip code:
2.8 people
Idaho:
2.6 people
Averages for the 2020 tax year for zip code 83330, filed in 2021:
Average Adjusted Gross Income (AGI) in 2020: $52,362 (Individual Income Tax Returns)
Here:
$52,362
State:
$73,627
Salary/wage: $44,591 (reported on 85.1% of returns)
Here:
$44,591
State:
$55,245
(% of AGI for various income ranges: 1449.4% for AGIs below $25k, 4431.0% for AGIs $25k-50k, 7558.1% for AGIs $50k-75k, 11554.4% for AGIs $75k-100k, 16142.9% for AGIs $100k-200k)
Taxable interest for individuals: $1,615 (reported on 22.5% of returns)
This zip code:
$1,615
Idaho:
$2,230
(% of AGI for various income ranges: 24.1% for AGIs below $25k, 20.0% for AGIs $25k-50k, 57.7% for AGIs $50k-75k, 61.3% for AGIs $75k-100k, 229.3% for AGIs $100k-200k)
Ordinary dividends: $3,623 (reported on 10.4% of returns)
Here:
$3,623
State:
$7,088
(% of AGI for various income ranges: 12.7% for AGIs below $25k, 16.5% for AGIs $25k-50k, 40.6% for AGIs $50k-75k, 86.9% for AGIs $75k-100k, 328.6% for AGIs $100k-200k)
Net capital gain/loss in AGI: +$18,171 (reported on 12.1% of returns)
Here:
+$18,171
State:
+$37,284
(% of AGI for various income ranges: 7.5% for AGIs below $25k, 23.7% for AGIs $25k-50k, 91.0% for AGIs $50k-75k, 247.5% for AGIs $75k-100k, 1489.3% for AGIs $100k-200k)
Profit/loss from business: +$8,729 (reported on 13.1% of returns)
Here:
+$8,729
State:
+$12,955
(% of AGI for various income ranges: 78.1% for AGIs below $25k, 124.0% for AGIs $25k-50k, 223.5% for AGIs $50k-75k, 453.1% for AGIs $75k-100k, 455.7% for AGIs $100k-200k)
Taxable individual retirement arrangement distribution: $13,094 (reported on 6.2% of returns)
83330:
$13,094
Idaho:
$20,110
(% of AGI for various income ranges: 47.6% for AGIs below $25k, 61.6% for AGIs $25k-50k, 152.6% for AGIs $50k-75k, 145.6% for AGIs $75k-100k, 692.1% for AGIs $100k-200k)
Total itemized deductions: $32,712 (reported on 2.8% of returns)
Here:
$32,712
State:
$38,402
(% of AGI for various income ranges: 350.0% for AGIs $50k-75k, 1094.3% for AGIs $100k-200k)
Charity contributions: $12,800 (reported on 2.1% of returns)
Here:
$12,800
State:
$18,314
(% of AGI for various income ranges: 21.6% for AGIs below $25k, 451.4% for AGIs $100k-200k)
Taxes paid: $6,562 (reported on 2.8% of returns)
83330:
$6,562
State:
$7,596
(% of AGI for various income ranges: 58.4% for AGIs $50k-75k, 245.7% for AGIs $100k-200k)
Earned income credit: $2,236 (reported on 17.3% of returns)
Here:
$2,236
State:
$2,195
(% of AGI for various income ranges: 100.3% for AGIs below $25k, 78.4% for AGIs $25k-50k)
Percentage of individuals using paid preparers for their 2020 taxes: 91.3%
Here:
91%
State:
94%
(% for various income ranges: 89.2% for AGIs below $25k, 90.9% for AGIs $25k-50k, 91.8% for AGIs $50k-75k, 96.3% for AGIs $75k-100k, 92.3% for AGIs $100k-200k, 100.0% for AGIs over 200k)
Averages for the 2012 tax year for zip code 83330, filed in 2013:
Average Adjusted Gross Income (AGI) in 2012: $42,272 (Individual Income Tax Returns)
Here:
$42,272
State:
$52,536
Salary/wage: $34,666 (reported on 85.2% of returns)
Here:
$34,666
State:
$41,938
(% of AGI for various income ranges: 74.4% for AGIs below $25k, 82.7% for AGIs $25k-50k, 76.6% for AGIs $50k-75k, 79.3% for AGIs $75k-100k, 58.2% for AGIs $100k-200k, 30.8% for AGIs over 200k)
Taxable interest for individuals: $2,131 (reported on 27.3% of returns)
This zip code:
$2,131
Idaho:
$1,874
(% of AGI for various income ranges: 1.3% for AGIs below $25k, 1.0% for AGIs $25k-50k, 1.2% for AGIs $50k-75k, 1.1% for AGIs $75k-100k, 1.3% for AGIs $100k-200k, 3.0% for AGIs over 200k)
Ordinary dividends: $4,271 (reported on 11.7% of returns)
Here:
$4,271
State:
$5,706
(% of AGI for various income ranges: 1.4% for AGIs below $25k, 0.8% for AGIs $25k-50k, 1.4% for AGIs $50k-75k, 0.9% for AGIs $75k-100k, 2.4% for AGIs $100k-200k)
Net capital gain/loss in AGI: +$13,964 (reported on 12.5% of returns)
Here:
+$13,964
State:
+$14,571
(% of AGI for various income ranges: 0.8% for AGIs $25k-50k, 0.9% for AGIs $50k-75k, 2.4% for AGIs $75k-100k, 3.8% for AGIs $100k-200k, 25.2% for AGIs over 200k)
Profit/loss from business: +$6,917 (reported on 13.6% of returns)
Here:
+$6,917
State:
+$10,113
(% of AGI for various income ranges: 5.2% for AGIs below $25k, 2.3% for AGIs $25k-50k, 2.4% for AGIs $50k-75k, 1.9% for AGIs $75k-100k, 1.4% for AGIs $100k-200k)
Taxable individual retirement arrangement distribution: $8,171 (reported on 8.0% of returns)
83330:
$8,171
Idaho:
$14,642
(% of AGI for various income ranges: 2.2% for AGIs below $25k, 1.2% for AGIs $25k-50k, 1.0% for AGIs $50k-75k, 1.6% for AGIs $75k-100k, 3.2% for AGIs $100k-200k)
Total itemized deductions: $19,020 (22% of AGI, reported on 19.3% of returns)
Here:
$19,020
State:
$22,697
Here:
22.0% of AGI
State:
22.0% of AGI
(% of AGI for various income ranges: 6.7% for AGIs below $25k, 6.3% for AGIs $25k-50k, 7.9% for AGIs $50k-75k, 10.4% for AGIs $75k-100k, 10.6% for AGIs $100k-200k, 12.9% for AGIs over 200k)
Charity contributions: $4,679 (reported on 14.4% of returns)
Here:
$4,679
State:
$5,246
(% of AGI for various income ranges: 0.9% for AGIs below $25k, 0.8% for AGIs $25k-50k, 1.3% for AGIs $50k-75k, 1.9% for AGIs $75k-100k, 2.2% for AGIs $100k-200k, 3.6% for AGIs over 200k)
Taxes paid: $5,582 (reported on 18.9% of returns)
83330:
$5,582
State:
$7,139
(% of AGI for various income ranges: 0.7% for AGIs below $25k, 1.2% for AGIs $25k-50k, 1.8% for AGIs $50k-75k, 3.1% for AGIs $75k-100k, 3.8% for AGIs $100k-200k, 5.8% for AGIs over 200k)
Earned income credit: $2,240 (reported on 22.7% of returns)
Here:
$2,240
State:
$2,213
(% of AGI for various income ranges: 6.6% for AGIs below $25k, 1.5% for AGIs $25k-50k)
Percentage of individuals using paid preparers for their 2012 taxes: 61.4%
Here:
61%
State:
52%
(% for various income ranges: 53.6% for AGIs below $25k, 65.0% for AGIs $25k-50k, 63.2% for AGIs $50k-75k, 70.6% for AGIs $75k-100k, 80.0% for AGIs $100k-200k, 75.0% for AGIs over 200k)
Averages for the 2004 tax year for zip code 83330, filed in 2005:
Average Adjusted Gross Income (AGI) in 2004: $31,559 (Individual Income Tax Returns)
Here:
$31,559
State:
$42,679
Salary/wage: $29,482 (reported on 83.9% of returns)
Here:
$29,482
State:
$35,636
(% of AGI for various income ranges: 76.8% for AGIs $10k-25k, 81.6% for AGIs $25k-50k, 79.1% for AGIs $50k-75k, 76.0% for AGIs $75k-100k, 30.8% for AGIs over 100k)
Taxable interest for individuals: $2,039 (reported on 39.0% of returns)
This zip code:
$2,039
Idaho:
$2,024
(% of AGI for various income ranges: 2.2% for AGIs $10k-25k, 1.6% for AGIs $25k-50k, 1.7% for AGIs $50k-75k, 1.8% for AGIs $75k-100k, 2.6% for AGIs over 100k)
Taxable dividends: $1,795 (reported on 17.1% of returns)
Here:
$1,795
State:
$2,917
(% of AGI for various income ranges: 1.0% for AGIs $10k-25k, 0.7% for AGIs $25k-50k, 0.5% for AGIs $50k-75k, 0.9% for AGIs $75k-100k, 1.1% for AGIs over 100k)
Net capital gain/loss: +$23,233 (reported on 18.9% of returns)
Here:
+$23,233
State:
+$13,146
(% of AGI for various income ranges: 2.0% for AGIs $10k-25k, 2.0% for AGIs $25k-50k, 3.2% for AGIs $50k-75k, 5.8% for AGIs $75k-100k, 47.9% for AGIs over 100k)
Profit/loss from business: +$7,837 (reported on 14.8% of returns)
Here:
+$7,837
State:
+$8,765
(% of AGI for various income ranges: 4.0% for AGIs $10k-25k, 2.8% for AGIs $25k-50k, 4.4% for AGIs $50k-75k, 3.2% for AGIs $75k-100k, 1.6% for AGIs over 100k)
IRA payment deduction: $3,297 (reported on 2.7% of returns)
83330:
$3,297
Idaho:
$3,020
Total itemized deductions: $15,063 (23% of AGI, reported on 22.8% of returns)
Here:
$15,063
State:
$18,385
Here:
22.6% of AGI
State:
23.1% of AGI
(% of AGI for various income ranges: 6.1% for AGIs $10k-25k, 9.4% for AGIs $25k-50k, 12.2% for AGIs $50k-75k, 13.7% for AGIs $75k-100k, 7.6% for AGIs over 100k)
Charity contributions deductions: $3,846 (5% of AGI, reported on 17.0% of returns)
Here:
$3,846
State:
$3,875
Here:
5.1% of AGI
State:
4.6% of AGI
(% of AGI for various income ranges: 0.8% for AGIs $10k-25k, 1.3% for AGIs $25k-50k, 2.1% for AGIs $50k-75k, 3.1% for AGIs $75k-100k, 2.6% for AGIs over 100k)
Total tax: $4,322 (reported on 67.3% of returns)
83330:
$4,322
State:
$6,282
(% of AGI for various income ranges: 3.7% for AGIs $10k-25k, 5.4% for AGIs $25k-50k, 7.6% for AGIs $50k-75k, 10.2% for AGIs $75k-100k, 15.8% for AGIs over 100k)
Earned income credit: $1,662 (reported on 20.0% of returns)
Here:
$1,662
State:
$1,660
Percentage of individuals using paid preparers for their 2004 taxes: 65.2%
Here:
65%
State:
59%
(% for various income ranges: 58.9% for AGIs below $10k, 64.1% for AGIs $10k-25k, 68.0% for AGIs $25k-50k, 66.1% for AGIs $50k-75k, 69.4% for AGIs $75k-100k, 84.2% for AGIs over 100k)
Household received Food Stamps/SNAP in the past 12 months: 160 Household did not receive Food Stamps/SNAP in the past 12 months: 2,403
Women who had a birth in the past 12 months: 131 (112 now married, 15 unmarried) Women who did not have a birth in the past 12 months: 1,472 (670 now married, 799 unmarried)
Housing units in zip code 83330 with a mortgage: 1,087 (77 second mortgage, 41 both second mortgage and home equity loan) Houses without a mortgage: 170
Median monthly owner costs for units with a mortgage: $1,146 Median monthly owner costs for units without a mortgage: $393
Residents with income below the poverty level in 2022:
This zip code:
12.2%
Whole state:
10.7%
Residents with income below 50% of the poverty level in 2022:
This zip code:
8.2%
Whole state:
6.1%
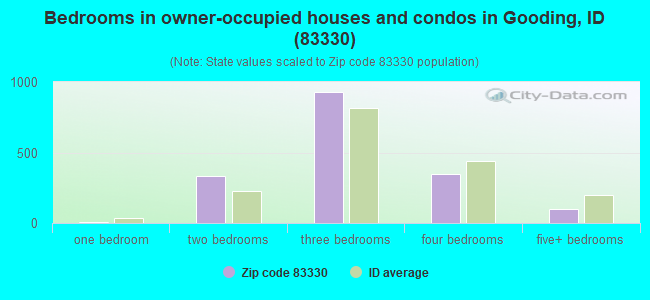
Median number of rooms in houses and condos:
Here:
5.8
State:
6.5
Median number of rooms in apartments:
Here:
4.3
State:
4.4
Notable locations in this zip code not listed on our city pages
Notable locations in zip code 83330: Dog Creek Reservoir Public Fishing Area (A), Randolf Pipe (B), Gooding County Fairgrounds (C), Gooding County Emergency Medical Services (D), Gooding City Rural Fire Department (E). Display/hide their locations on the map
Rivers and creeks: Black Canyon Creek (A), Fourmile Creek (B), Portuguese Creek (C), Preacher Creek (D), Thorn Creek (E), Turkey Creek (F), Big Wood River (G). Display/hide their locations on the map
1,333 married couples with children.
320 single-parent households (164 men, 156 women).
82.3% of residents of 83330 zip code speak English at home.
16.5% of residents speak Spanish at home (54% very well, 20% well, 22% not well, 5% not at all).
1.4% of residents speak other Indo-European language at home (100% very well).
0.2% of residents speak Asian or Pacific Island language at home (100% not well).
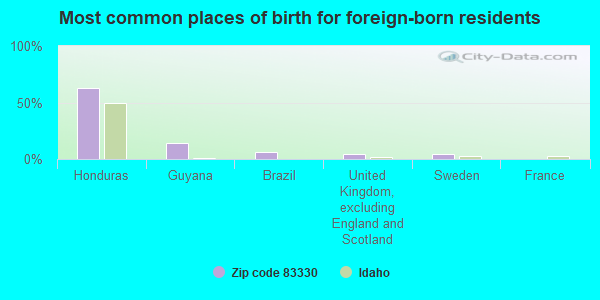
Foreign born population: 636 (8.9%) (58.4% of them are naturalized citizens)
This zip code:
8.9%
Whole state:
6.0%
63%Honduras
14%Guyana
6%Brazil
5%United Kingdom, excluding England and Scotland
5%Sweden
0%France
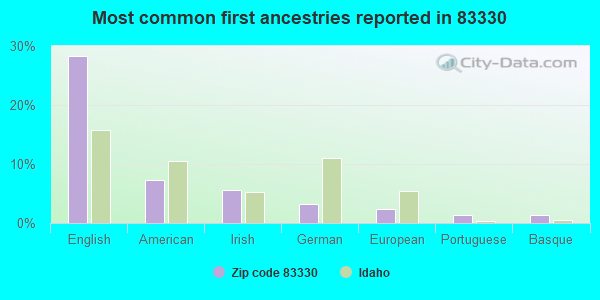
28%English
7%American
6%Irish
3%German
2%European
1%Portuguese
1%Basque
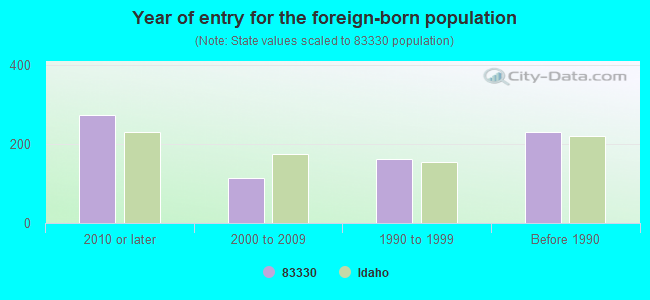
Year of entry for the foreign-born population
2742010 or later
1132000 to 2009
1631990 to 1999
231Before 1990
Major facilities with environmental interests located in this zip code:
DARYL HILT DAIRY (2163 SOUTH 1700 EAST in GOODING, ID)
(Integrated Compliance Information System) - ICIS-10-1993-0166, FORMAL ENFORCEMENT ACTION National Pollutant Discharge Elimination System NON-MAJOR (Tracking pollutant discharge elimination systems) - permit Business SIC classification: DAIRY FARMS
GOODING HIGH SCHOOL (1050 7TH AVENUE WEST in GOODING, ID)
(Geographic Names Information System) (National Center for Education Statistics) - STATE ID-231 401 Organizations: GOODING JOINT SCHOOL DISTRICT 231 (SCHOOL DISTRICT)
GOODING MIDDLE SCHOOL (1045 7TH AVENUE WEST in GOODING, ID)
(National Center for Education Statistics) - STATE ID-231 601 Organizations: GOODING JOINT SCHOOL DISTRICT 231 (SCHOOL DISTRICT)
STEVE'S QUIK SERVICE (601 MAIN STREET in GOODING, ID)
ENFORCEMENT/COMPLIANCE ACTIVITY (Integrated Compliance Information System) FORMAL ENFORCEMENT ACTION (Integrated Compliance Information System) - ICIS-10-2006-0058, ENFORCEMENT/COMPLIANCE ACTIVITY Alternative names: STEVE'S QUICK STOP
GOODING ACCLRTED LEARNING CNTR (906 MAIN STREET in GOODING, ID)
(National Center for Education Statistics) - STATE ID-231 491 Organizations: GOODING JOINT SCHOOL DISTRICT 231 (SCHOOL DISTRICT)
IDAHO SCHOOL FOR THE DEAF AND BLIND (1450 MAIN STREET in GOODING, ID)
(National Center for Education Statistics) - STATE ID-596 701
GOODING ELEMENTARY SCHOOL (1045 7TH AVENUE WEST in GOODING, ID)
(National Center for Education Statistics) - STATE ID-231 101 Organizations: GOODING JOINT SCHOOL DISTRICT 231 (SCHOOL DISTRICT)
GLANBIA FOODS INC. (1728 SOUTH 2300 EAST in GOODING, ID)
AIR SYNTHETIC MINOR (AIRS/AFS) National Pollutant Discharge Elimination System NON-MAJOR (Tracking pollutant discharge elimination systems) - permit Conditionally Exempt Small Quantity Generators, less than 100 kg/month of hazardous waste (Resource Conservation and Recovery Act (tracking hazardous waste)) - notification TRI REPORTER (Tracking of toxic chemicals releasing facilities) Business SIC classification: NATURAL, PROCESSED, AND IMITATION CHEESE; DRY, CONDENSED, AND EVAPORATED DAIRY PRODUCTS Alternative names: AVONMORE WEST INC, GLANBIA FOODS INC GOODING, GOODING PLANT, LAND O LAKES FARMLAND FEED
ID AGRI GOODING (2189 E 1375 S in GOODING, ID)
HAZARDOUS WASTE BIENNIAL REPORTER (Resource Conservation and Recovery Act (tracking hazardous waste)) (Resource Conservation and Recovery Act (tracking hazardous waste)) Organizations: A FITZGERALD (CONTACT/OWNER)
Alternative names: ID SAINT DEPT OF AG GOODING
BIG SKY DAIRY NORTH (1660 EAST 2400 SOUTH in GOODING, ID)
National Pollutant Discharge Elimination System NON-MAJOR (Tracking pollutant discharge elimination systems) - permit Business SIC classification: DAIRY FARMS
BIG SKY DAIRY SOUTH (3550 SOUTH 1950 EAST in GOODING, ID)
National Pollutant Discharge Elimination System NON-MAJOR (Tracking pollutant discharge elimination systems) - permit Business SIC classification: DAIRY FARMS
BIG SKY DAIRY WEST (2395 SOUTH 1500 EAST in GOODING, ID)
National Pollutant Discharge Elimination System NON-MAJOR (Tracking pollutant discharge elimination systems) - permit Business SIC classification: DAIRY FARMS
BIG SKY HEIFER RANCH (2050 EAST 1500 SOUTH in GOODING, ID)
National Pollutant Discharge Elimination System NON-MAJOR (Tracking pollutant discharge elimination systems) - permit Business SIC classification: DAIRY FARMS Organizations: BIG SKY DAIRY (CONTACT/OPERATOR)
Alternative names: BIG SKY DAIRY
Housing units lacking complete kitchen facilities: 1.4%
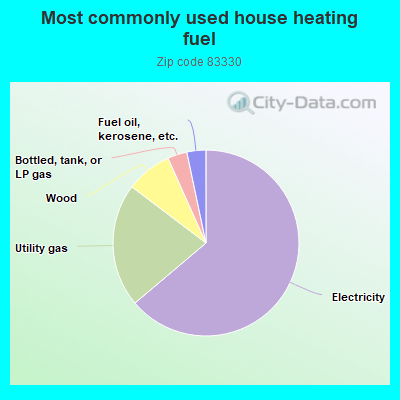
63.9%Electricity
21.5%Utility gas
8.0%Wood
3.4%Bottled, tank, or LP gas
3.3%Fuel oil, kerosene, etc.
Population in 1990: 4,846. Population change in the 1990s: +1,116 (+23.0%).
Place of birth for U.S.-born residents:
This state: 3,632
Northeast: 77
Midwest: 247
South: 357
West: 2,065
50% of the 83330 zip code residents lived in the same house 5 years ago. Out of people who lived in different houses, 55% lived in this county. Out of people who lived in different counties, 50% lived in Idaho.
92% of the 83330 zip code residents lived in the same house 1 year ago. Out of people who lived in different houses, 38% moved from this county. Out of people who lived in different houses, 26% moved from different county within same state. Out of people who lived in different houses, 39% moved from different state. Out of people who lived in different houses, 2% moved from abroad.
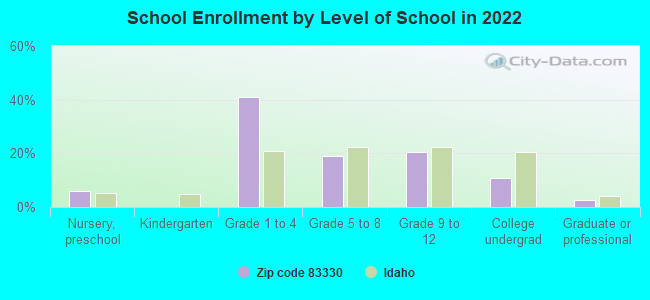
Private vs. public school enrollment:
Students in private schools in grades 1 to 8 (elementary and middle school): 371
Here:
30.4%
Idaho:
13.5%
Students in private schools in grades 9 to 12 (high school): 83
Here:
22.2%
Idaho:
8.5%
Students in private undergraduate colleges: 43
Here:
19.9%
Idaho:
30.0%
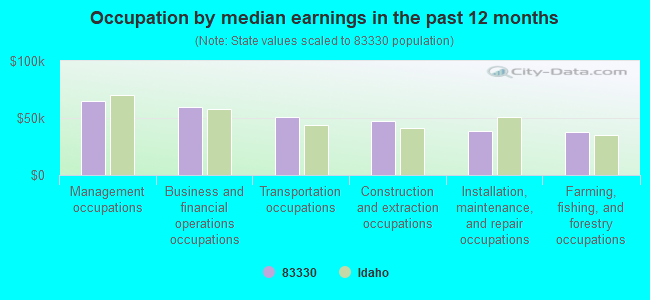
Occupation by median earnings in the past 12 months ($)
64,943Management occupations
59,498Business and financial operations occupations
50,510Transportation occupations
47,543Construction and extraction occupations
38,816Installation, maintenance, and repair occupations
38,106Farming, fishing, and forestry occupations
Top industries in this zip code by the number of employees in 2005:
Health Care and Social Assistance: Nursing Care Facilities (100-249 employees: 1 establishment)
Health Care and Social Assistance: General Medical and Surgical Hospitals (50-99: 1)
Administrative and Support and Waste Management and Remediation Services: Professional Employer Organizations (50-99: 1)
Health Care and Social Assistance: Offices of Physicians (except Mental Health Specialists) (20-49: 1, 10-19: 1, 1-4: 1)
Construction: Site Preparation Contractors (20-49: 1, 1-4: 1)
People in group quarters in 2010:
35 people in local jails and other municipal confinement facilities
People in group quarters in 2000:
72 people in nursing homes
32 people in training schools for juvenile delinquents
21 people in local jails and other confinement facilities (including police lockups)
18 people in hospitals or wards for drug/alcohol abuse
13 people in other noninstitutional group quarters
Fatal accident statistics in 2013:
Fatal accident count: 1
Vehicles involved in fatal accidents: 2
Fatal accidents caused by drunken drivers: 0
Fatalities: 1
Persons involved in fatal accidents: 2
Pedestrians involved in fatal accidents: 0
Fatal accident statistics in 2010:
Fatal accident count: 1
Vehicles involved in fatal accidents: 2
Fatal accidents caused by drunken drivers: 0
Fatalities: 1
Persons involved in fatal accidents: 4
Pedestrians involved in fatal accidents: 0
2002 - 2018 National Fire Incident Reporting System (NFIRS) incidents
According to the data from the years 2002 - 2018 the average number of fires per year is 57. The highest number of reported fires - 75 took place in 2018, and the least - 38 in 2016. The data has a growing trend.
When looking into fire subcategories, the most reports belonged to: Outside Fires (63.0%), and Structure Fires (28.6%).
Fire incident types reported to NFIRS in Zip Code 83330


 Nearest zip codes: 83355, 83314, 83332, 83352, 83338, 83316.


 According to the data from the years 2002 - 2018 the average number of fires per year is 57. The highest number of reported fires - 75 took place in 2018, and the least - 38 in 2016. The data has a growing trend.
 When looking into fire subcategories, the most reports belonged to: Outside Fires (63.0%), and Structure Fires (28.6%).