Estimated zip code population in 2022: 48,419 Zip code population in 2010: 44,821 Zip code population in 2000: 43,685
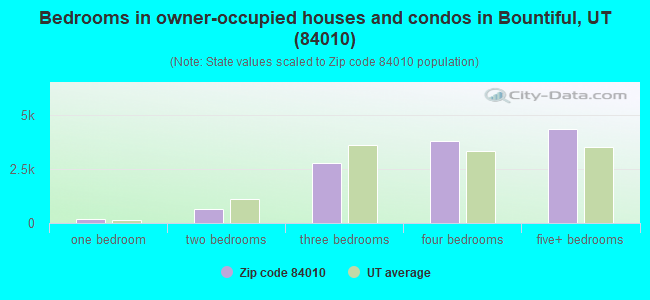
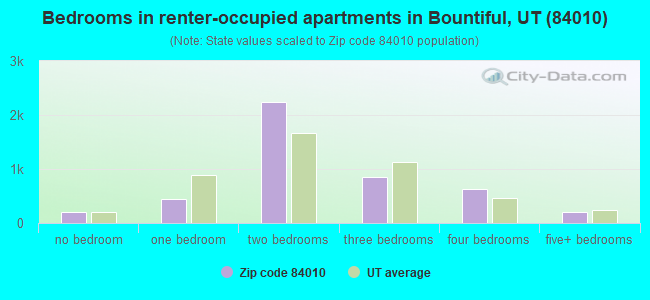
Houses and condos: 17,369 Renter-occupied apartments: 4,572
% of renters here:
28%
State:
29%
March 2022 cost of living index in zip code 84010: 90.0 (less than average, U.S. average is 100)
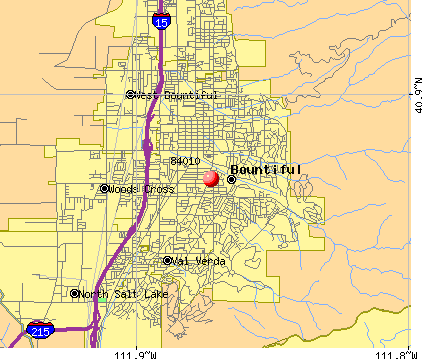
Land area: 15.1 sq. mi. Water area: 0.0 sq. mi.
Population density: 3,217 people per square mile
(average).
OSM Map
General Map
Google Map
MSN Map
OSM Map
General Map
Google Map
MSN Map
OSM Map
General Map
Google Map
MSN Map
OSM Map
General Map
Google Map
MSN Map
Please wait while loading the map...
Real estate property taxes paid for housing units in 2022:
This zip code:
0.5% ($2,732)
Utah:
0.5% ($2,376)
Median real estate property taxes paid for housing units with mortgages in 2022: $2,640 (0.5%) Median real estate property taxes paid for housing units with no mortgage in 2022: $2,906 (0.5%)
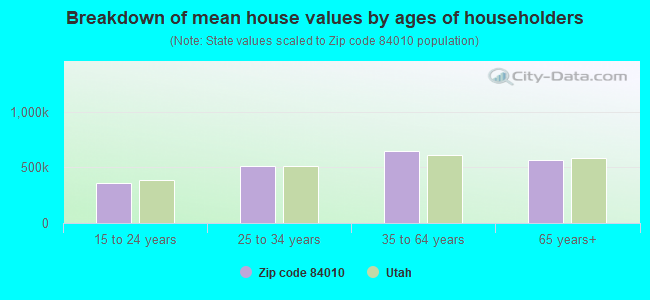
Estimated median house/condo value in 2022: $540,829
84010:
$540,829
Utah:
$499,500
According to our research of Utah and other state lists, there were 66 registered sex offenders living in 84010 zip code as of April 25, 2024. The ratio of all residents to sex offenders in zip code 84010 is 704 to 1. The ratio of registered sex offenders to all residents in this zip code is lower than the state average.
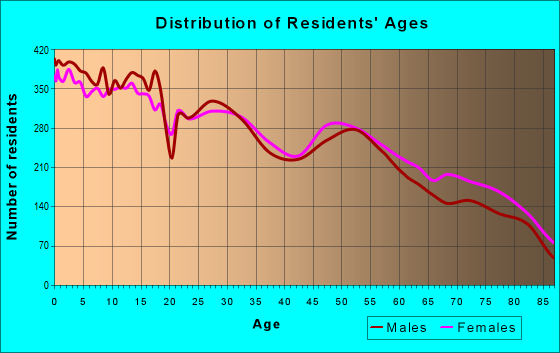
Median resident age:
This zip code:
32.7 years
Utah median age:
32.1 years
Average household size:
This zip code:
3.0 people
Utah:
3.0 people
Averages for the 2020 tax year for zip code 84010, filed in 2021:
Average Adjusted Gross Income (AGI) in 2020: $95,141 (Individual Income Tax Returns)
Here:
$95,141
State:
$81,660
Salary/wage: $70,781 (reported on 82.4% of returns)
Here:
$70,781
State:
$63,027
(% of AGI for various income ranges: 1225.2% for AGIs below $25k, 3832.4% for AGIs $25k-50k, 6764.6% for AGIs $50k-75k, 9665.6% for AGIs $75k-100k, 19089.4% for AGIs $100k-200k, 78277.2% for AGIs over 200k)
Taxable interest for individuals: $3,545 (reported on 36.8% of returns)
This zip code:
$3,545
Utah:
$2,255
(% of AGI for various income ranges: 21.3% for AGIs below $25k, 37.0% for AGIs $25k-50k, 47.5% for AGIs $50k-75k, 131.3% for AGIs $75k-100k, 236.6% for AGIs $100k-200k, 3751.7% for AGIs over 200k)
Ordinary dividends: $8,129 (reported on 22.2% of returns)
Here:
$8,129
State:
$7,362
(% of AGI for various income ranges: 26.7% for AGIs below $25k, 39.2% for AGIs $25k-50k, 79.2% for AGIs $50k-75k, 139.2% for AGIs $75k-100k, 310.5% for AGIs $100k-200k, 5437.0% for AGIs over 200k)
Net capital gain/loss in AGI: +$53,461 (reported on 21.6% of returns)
Here:
+$53,461
State:
+$43,433
(% of AGI for various income ranges: 16.5% for AGIs below $25k, 36.6% for AGIs $25k-50k, 92.1% for AGIs $50k-75k, 183.9% for AGIs $75k-100k, 639.4% for AGIs $100k-200k, 47955.5% for AGIs over 200k)
Profit/loss from business: +$10,487 (reported on 16.1% of returns)
Here:
+$10,487
State:
+$9,957
(% of AGI for various income ranges: 94.2% for AGIs below $25k, 134.2% for AGIs $25k-50k, 137.7% for AGIs $50k-75k, 342.7% for AGIs $75k-100k, 371.7% for AGIs $100k-200k, 2454.9% for AGIs over 200k)
Taxable individual retirement arrangement distribution: $22,092 (reported on 9.4% of returns)
84010:
$22,092
Utah:
$21,167
(% of AGI for various income ranges: 52.0% for AGIs below $25k, 107.3% for AGIs $25k-50k, 219.6% for AGIs $50k-75k, 433.9% for AGIs $75k-100k, 749.0% for AGIs $100k-200k, 2430.2% for AGIs over 200k)
Self-employed (Keogh) retirement plans: $25,567 (reported on 0.3% of returns)
84010:
$25,567
Utah:
$29,069
(% of AGI for various income ranges: 12.3% for AGIs $50k-75k, 269.1% for AGIs over 200k)
Total itemized deductions: $46,245 (reported on 18.2% of returns)
Here:
$46,245
State:
$41,056
(% of AGI for various income ranges: 51.2% for AGIs below $25k, 135.2% for AGIs $25k-50k, 480.4% for AGIs $50k-75k, 892.4% for AGIs $75k-100k, 2642.4% for AGIs $100k-200k, 19867.0% for AGIs over 200k)
Charity contributions: $27,386 (reported on 16.6% of returns)
Here:
$27,386
State:
$22,261
(% of AGI for various income ranges: 6.5% for AGIs below $25k, 31.8% for AGIs $25k-50k, 136.5% for AGIs $50k-75k, 275.8% for AGIs $75k-100k, 1125.7% for AGIs $100k-200k, 13789.6% for AGIs over 200k)
Taxes paid: $8,153 (reported on 18.1% of returns)
84010:
$8,153
State:
$7,985
(% of AGI for various income ranges: 6.6% for AGIs below $25k, 24.8% for AGIs $25k-50k, 108.4% for AGIs $50k-75k, 211.7% for AGIs $75k-100k, 693.3% for AGIs $100k-200k, 2192.8% for AGIs over 200k)
Earned income credit: $2,019 (reported on 9.9% of returns)
Here:
$2,019
State:
$2,169
(% of AGI for various income ranges: 57.2% for AGIs below $25k, 53.5% for AGIs $25k-50k, 1.9% for AGIs $50k-75k)
Percentage of individuals using paid preparers for their 2020 taxes: 92.5%
Here:
93%
State:
94%
(% for various income ranges: 90.3% for AGIs below $25k, 93.1% for AGIs $25k-50k, 93.7% for AGIs $50k-75k, 93.7% for AGIs $75k-100k, 93.3% for AGIs $100k-200k, 93.4% for AGIs over 200k)
Averages for the 2012 tax year for zip code 84010, filed in 2013:
Average Adjusted Gross Income (AGI) in 2012: $72,312 (Individual Income Tax Returns)
Here:
$72,312
State:
$60,327
Salary/wage: $55,621 (reported on 81.8% of returns)
Here:
$55,621
State:
$48,762
(% of AGI for various income ranges: 76.9% for AGIs below $25k, 76.7% for AGIs $25k-50k, 72.5% for AGIs $50k-75k, 71.8% for AGIs $75k-100k, 72.1% for AGIs $100k-200k, 43.0% for AGIs over 200k)
Taxable interest for individuals: $2,233 (reported on 46.4% of returns)
This zip code:
$2,233
Utah:
$1,534
(% of AGI for various income ranges: 1.3% for AGIs below $25k, 0.9% for AGIs $25k-50k, 1.0% for AGIs $50k-75k, 0.9% for AGIs $75k-100k, 1.0% for AGIs $100k-200k, 2.3% for AGIs over 200k)
Ordinary dividends: $5,024 (reported on 22.4% of returns)
Here:
$5,024
State:
$5,711
(% of AGI for various income ranges: 1.5% for AGIs below $25k, 1.1% for AGIs $25k-50k, 1.1% for AGIs $50k-75k, 1.2% for AGIs $75k-100k, 1.4% for AGIs $100k-200k, 2.2% for AGIs over 200k)
Net capital gain/loss in AGI: +$24,955 (reported on 19.0% of returns)
Here:
+$24,955
State:
+$23,734
(% of AGI for various income ranges: 0.1% for AGIs $25k-50k, 0.4% for AGIs $50k-75k, 0.8% for AGIs $75k-100k, 1.3% for AGIs $100k-200k, 17.8% for AGIs over 200k)
Profit/loss from business: +$10,398 (reported on 15.4% of returns)
Here:
+$10,398
State:
+$8,845
(% of AGI for various income ranges: 4.8% for AGIs below $25k, 2.0% for AGIs $25k-50k, 2.0% for AGIs $50k-75k, 1.6% for AGIs $75k-100k, 3.0% for AGIs $100k-200k, 1.7% for AGIs over 200k)
Taxable individual retirement arrangement distribution: $16,330 (reported on 12.2% of returns)
84010:
$16,330
Utah:
$15,565
(% of AGI for various income ranges: 3.8% for AGIs below $25k, 3.1% for AGIs $25k-50k, 3.1% for AGIs $50k-75k, 3.4% for AGIs $75k-100k, 3.6% for AGIs $100k-200k, 1.6% for AGIs over 200k)
Self-employment retirement plans: $26,789 (reported on 0.5% of returns)
84010:
$26,789
Utah:
$22,655
Total itemized deductions: $28,284 (22% of AGI, reported on 44.1% of returns)
Here:
$28,284
State:
$25,197
Here:
22.1% of AGI
State:
22.4% of AGI
(% of AGI for various income ranges: 11.7% for AGIs below $25k, 13.9% for AGIs $25k-50k, 19.6% for AGIs $50k-75k, 21.2% for AGIs $75k-100k, 20.4% for AGIs $100k-200k, 14.8% for AGIs over 200k)
Charity contributions: $10,637 (reported on 40.7% of returns)
Here:
$10,637
State:
$8,502
(% of AGI for various income ranges: 2.1% for AGIs below $25k, 3.4% for AGIs $25k-50k, 5.8% for AGIs $50k-75k, 7.1% for AGIs $75k-100k, 7.6% for AGIs $100k-200k, 6.0% for AGIs over 200k)
Taxes paid: $7,922 (reported on 43.9% of returns)
84010:
$7,922
State:
$7,001
(% of AGI for various income ranges: 1.8% for AGIs below $25k, 2.7% for AGIs $25k-50k, 4.5% for AGIs $50k-75k, 5.4% for AGIs $75k-100k, 6.1% for AGIs $100k-200k, 5.0% for AGIs over 200k)
Earned income credit: $2,111 (reported on 13.5% of returns)
Here:
$2,111
State:
$2,259
(% of AGI for various income ranges: 4.7% for AGIs below $25k, 1.1% for AGIs $25k-50k)
Percentage of individuals using paid preparers for their 2012 taxes: 46.0%
Here:
46%
State:
51%
(% for various income ranges: 39.9% for AGIs below $25k, 45.3% for AGIs $25k-50k, 46.5% for AGIs $50k-75k, 48.5% for AGIs $75k-100k, 52.0% for AGIs $100k-200k, 72.7% for AGIs over 200k)
Averages for the 2004 tax year for zip code 84010, filed in 2005:
Average Adjusted Gross Income (AGI) in 2004: $56,261 (Individual Income Tax Returns)
Here:
$56,261
State:
$45,498
Salary/wage: $45,163 (reported on 81.0% of returns)
Here:
$45,163
State:
$38,975
(% of AGI for various income ranges: 181.2% for AGIs below $10k, 71.3% for AGIs $10k-25k, 73.4% for AGIs $25k-50k, 72.6% for AGIs $50k-75k, 74.1% for AGIs $75k-100k, 54.6% for AGIs over 100k)
Taxable interest for individuals: $1,967 (reported on 59.4% of returns)
This zip code:
$1,967
Utah:
$1,445
(% of AGI for various income ranges: 14.1% for AGIs below $10k, 3.0% for AGIs $10k-25k, 1.7% for AGIs $25k-50k, 1.7% for AGIs $50k-75k, 1.7% for AGIs $75k-100k, 2.1% for AGIs over 100k)
Taxable dividends: $3,236 (reported on 26.5% of returns)
Here:
$3,236
State:
$3,152
(% of AGI for various income ranges: 7.6% for AGIs below $10k, 1.6% for AGIs $10k-25k, 1.1% for AGIs $25k-50k, 1.0% for AGIs $50k-75k, 1.2% for AGIs $75k-100k, 1.8% for AGIs over 100k)
Net capital gain/loss: +$20,671 (reported on 23.0% of returns)
Here:
+$20,671
State:
+$14,059
(% of AGI for various income ranges: 3.9% for AGIs below $10k, 0.3% for AGIs $10k-25k, 0.7% for AGIs $25k-50k, 1.1% for AGIs $50k-75k, 1.6% for AGIs $75k-100k, 16.2% for AGIs over 100k)
Profit/loss from business: +$9,313 (reported on 16.5% of returns)
Here:
+$9,313
State:
+$6,903
(% of AGI for various income ranges: 11.8% for AGIs below $10k, 3.8% for AGIs $10k-25k, 2.6% for AGIs $25k-50k, 2.1% for AGIs $50k-75k, 2.5% for AGIs $75k-100k, 2.7% for AGIs over 100k)
IRA payment deduction: $3,329 (reported on 2.4% of returns)
84010:
$3,329
Utah:
$2,970
(% of AGI for various income ranges: 0.1% for AGIs $10k-25k, 0.2% for AGIs $25k-50k, 0.2% for AGIs $50k-75k, 0.2% for AGIs $75k-100k, 0.1% for AGIs over 100k)
Self-employed pension: $15,069 (reported on 0.8% of returns)
Here:
$15,069
Utah:
$14,916
(% of AGI for various income ranges: 0.0% for AGIs $25k-50k, 0.1% for AGIs $50k-75k, 0.1% for AGIs $75k-100k, 0.3% for AGIs over 100k)
Total itemized deductions: $23,496 (24% of AGI, reported on 44.9% of returns)
Here:
$23,496
State:
$20,312
Here:
23.6% of AGI
State:
24.9% of AGI
(% of AGI for various income ranges: 23.2% for AGIs below $10k, 13.4% for AGIs $10k-25k, 18.0% for AGIs $25k-50k, 22.1% for AGIs $50k-75k, 22.6% for AGIs $75k-100k, 17.5% for AGIs over 100k)
Charity contributions deductions: $9,257 (9% of AGI, reported on 42.7% of returns)
Here:
$9,257
State:
$6,250
Here:
9.1% of AGI
State:
7.4% of AGI
(% of AGI for various income ranges: 2.9% for AGIs below $10k, 3.0% for AGIs $10k-25k, 4.9% for AGIs $25k-50k, 7.3% for AGIs $50k-75k, 7.8% for AGIs $75k-100k, 8.1% for AGIs over 100k)
Total tax: $8,939 (reported on 75.5% of returns)
84010:
$8,939
State:
$6,523
(% of AGI for various income ranges: 4.9% for AGIs below $10k, 3.9% for AGIs $10k-25k, 5.8% for AGIs $25k-50k, 7.3% for AGIs $50k-75k, 8.6% for AGIs $75k-100k, 17.6% for AGIs over 100k)
Earned income credit: $1,576 (reported on 10.0% of returns)
Here:
$1,576
State:
$1,703
Percentage of individuals using paid preparers for their 2004 taxes: 48.4%
Here:
48%
State:
53%
(% for various income ranges: 39.6% for AGIs below $10k, 48.1% for AGIs $10k-25k, 48.9% for AGIs $25k-50k, 50.5% for AGIs $50k-75k, 47.6% for AGIs $75k-100k, 60.7% for AGIs over 100k)
Likely homosexual households (counted as self-reported same-sex unmarried-partner households)
Lesbian couples: 0.1% of all households
Gay men: 0.1% of all households
Household received Food Stamps/SNAP in the past 12 months: 594 Household did not receive Food Stamps/SNAP in the past 12 months: 15,663
Women who had a birth in the past 12 months: 712 (726 now married, 0 unmarried) Women who did not have a birth in the past 12 months: 10,910 (5,556 now married, 5,347 unmarried)
Housing units in zip code 84010 with a mortgage: 7,455 (1,123 second mortgage, 78 home equity loan, 821 both second mortgage and home equity loan) Houses without a mortgage: 153
Median monthly owner costs for units with a mortgage: $1,978 Median monthly owner costs for units without a mortgage: $574
Residents with income below the poverty level in 2022:
This zip code:
6.6%
Whole state:
8.2%
Residents with income below 50% of the poverty level in 2022:
This zip code:
3.2%
Whole state:
4.3%
Median number of rooms in houses and condos:
Here:
10.0
State:
7.6
Median number of rooms in apartments:
Here:
4.7
State:
4.3
Notable locations in this zip code not listed on our city pages
Notable locations in zip code 84010: Colonial Square (A), Thomas Warehousing Subdivision (B), D and M Warehousing Units 1-3 (C), Beehive Acres Commercial Subdivision (D), Main Street Professional Plaza (E), Fordham Commercial Park (F), South Davis Metro Fire Agency Station 81 (G), South Davis Metro Fire Agency Station 84 (H). Display/hide their locations on the map
Shopping Centers: Renaissance Towne Center Shopping Center (1), Gateway Crossings Shopping Center (2), Pages Lane Shopping Center (3), Hayward Interests Shopping Center (4), Five Points Shopping Center (5). Display/hide their locations on the map
Churches in zip code 84010 include: The Church of Jesus Christ of Latter Day Saints (A), Bountiful Christian Church (B), Bountiful Community Church (C), Cross of Christ Lutheran Church (D), Faith Baptist Church (E), First Baptist Church (F), First Southern Baptist Church (G), Grace Baptist Church (H), Pilgrim Christian Fellowship (I). Display/hide their locations on the map
10,910 married couples with children.
1,682 single-parent households (429 men, 1,253 women).
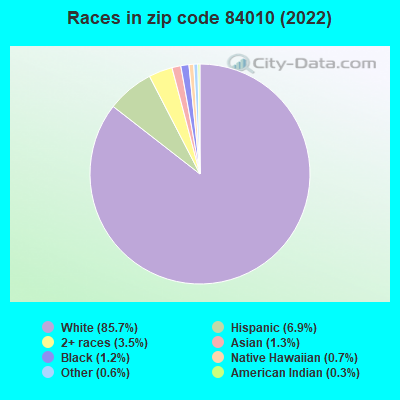
90.5% of residents of 84010 zip code speak English at home.
4.8% of residents speak Spanish at home (83% very well, 12% well, 5% not well).
2.2% of residents speak other Indo-European language at home (93% very well, 6% well, 1% not well).
2.1% of residents speak Asian or Pacific Island language at home (80% very well, 15% well, 5% not well).
0.4% of residents speak other language at home (100% very well).
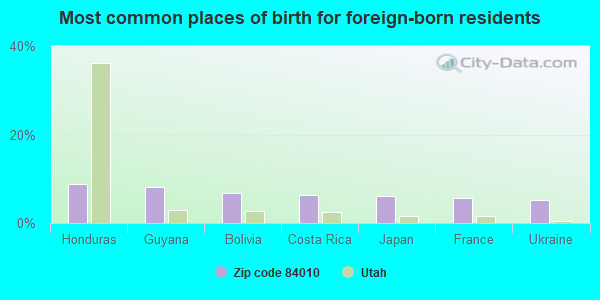
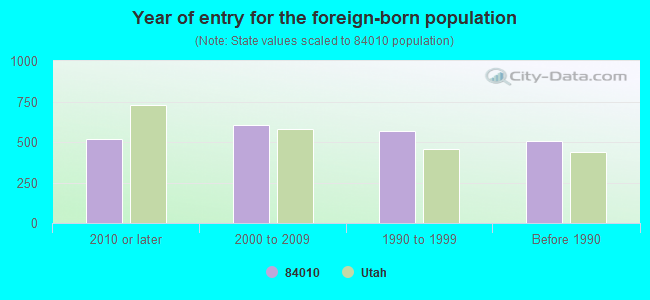
Foreign born population: 1,935 (4.0%) (57.7% of them are naturalized citizens)
Major facilities with environmental interests located in this zip code:
BOUNTIFUL HIGH SCHOOL (695 SOUTH ORCHARD DRIVE in BOUNTIFUL, UT)
AIR MINOR (AIRS/AFS) STATE MASTER (Utah compliance and permitting operations) - AQ CORE-1, , UST DATABASE-4, UNDERGROUND STORAGE TANK PROGRAM (National Center for Education Statistics) - STATE ID-07 704 Business SIC classification: ELEMENTARY AND SECONDARY SCHOOLS Organizations: DAVIS SCHOOL DISTRICT (SCHOOL DISTRICT)
KEN GARFF BOUNTIFUL MOTORS (2773 S MAIN ST in BOUNTIFUL, UT)
STATE MASTER (Utah compliance and permitting operations) - UST DATABASE-4, UNDERGROUND STORAGE TANK PROGRAM Small Quantity Generators, between 100 kg and 1000 kg of hazardous waste/month (Resource Conservation and Recovery Act (tracking hazardous waste)) - notification Organizations: KOURLIS, GEORGE (CONTACT/OWNER)
Alternative names: BOUNTIFUL MOTOR SALES
HK SYSTEMS (525 WEST 350 NORTH in BOUNTIFUL, UT)
AIR MINOR (AIRS/AFS) STATE MASTER (Utah compliance and permitting operations) - AQ CORE-1, , GROUND WATER DATABAS-10, GROUND WATER PROGRAM CRITERIA AND HAZARDOUS AIR POLLUTANT INVENTORY (Inventory of air pollution sources) Small Quantity Generators, between 100 kg and 1000 kg of hazardous waste/month (Resource Conservation and Recovery Act (tracking hazardous waste)) - notification TRI REPORTER (Tracking of toxic chemicals releasing facilities) Business SIC classification: INDUSTRIAL TRUCKS, TRACTORS, TRAILERS, AND STACKERS; GENERAL INDUSTRIAL MACHINERY AND EQUIPMENT Business NAICS classification: INDUSTRIAL TRUCK, TRACTOR, TRAILER, AND STACKER MACHINERY MANUFACTURING. Organizations: HK SYSTEMS (PREV. EATON KENWAY) (CONTACT/OWNER)
Alternative names: HK SYSTEMS - BOUNTIFUL PLANT, HK SYSTEMS LIFTING MACHINERY, LIFTING MACHINERY MFG PLANT
BOUNTIFUL CITY (790 S 100 E in BOUNTIFUL, UT)
STATE MASTER (Utah compliance and permitting operations) - UST DATABASE-4, UNDERGROUND STORAGE TANK PROGRAM (Integrated Compliance Information System) - ICIS-08-1992-0256, FORMAL ENFORCEMENT ACTION
LAKEVIEW HOSPITAL (630 MEDICAL DRIVE in BOUNTIFUL, UT)
AIR MINOR (AIRS/AFS) STATE MASTER (Utah compliance and permitting operations) - AQ CORE-1, , UST DATABASE-4, UNDERGROUND STORAGE TANK PROGRAM Business SIC classification: GENERAL MEDICAL AND SURGICAL HOSPITALS
MENLOVE DODGE TOYOTA (2380 S HWY 91 in BOUNTIFUL, UT)
STATE MASTER (Utah compliance and permitting operations) - UST DATABASE-4, UNDERGROUND STORAGE TANK PROGRAM Small Quantity Generators, between 100 kg and 1000 kg of hazardous waste/month (Resource Conservation and Recovery Act (tracking hazardous waste)) - notification Organizations: BILL JOHNSON (CONTACT/OWNER)
MURDOCK CHEVROLET INCORPORATED (2375 S 625 W in WOODS CROSS, UT)
STATE MASTER (Utah compliance and permitting operations) - UST DATABASE-4, UNDERGROUND STORAGE TANK PROGRAM Small Quantity Generators, between 100 kg and 1000 kg of hazardous waste/month (Resource Conservation and Recovery Act (tracking hazardous waste)) - notification Organizations: KENT MURDOCK (CONTACT/OWNER)
BOUNTIFUL CLEANERS INCORPORATED (344 S 500 W in BOUNTIFUL, UT)
STATE MASTER (Utah compliance and permitting operations) - RADIOACTIVE MATERIAL-11, RADIOACTIVE WASTE, UST DATABASE-4, UNDERGROUND STORAGE TANK PROGRAM Small Quantity Generators, between 100 kg and 1000 kg of hazardous waste/month (Resource Conservation and Recovery Act (tracking hazardous waste)) - notification Organizations: JAY BANGETER (CONTACT/OWNER)
HENRIES DRY CLEANERS (2459 S MAIN ST in BOUNTIFUL, UT)
STATE MASTER (Utah compliance and permitting operations) - SQG DATABASE-7, CESQG Small Quantity Generators, between 100 kg and 1000 kg of hazardous waste/month (Resource Conservation and Recovery Act (tracking hazardous waste)) - notification Organizations: BOYD HENRIE (CONTACT/OWNER)
Alternative names: HENRIE S DRY CLEANERS, HENRIES CLEANERS
HORIZON PUBLISHERS (50 S 500 W in BOUNTIFUL, UT)
STATE MASTER (Utah compliance and permitting operations) - UST DATABASE-4, UNDERGROUND STORAGE TANK PROGRAM Conditionally Exempt Small Quantity Generators, less than 100 kg/month of hazardous waste (Resource Conservation and Recovery Act (tracking hazardous waste)) - notification Organizations: DUANE CROWTHER (CONTACT/OWNER)
FOSS LEWIS & SONS CONSTRUCTION INCORPORATED (2842 S 400 E in BOUNTIFUL, UT)
STATE MASTER (Utah compliance and permitting operations) - UST DATABASE-4, UNDERGROUND STORAGE TANK PROGRAM TRANSPORTER (Resource Conservation and Recovery Act (tracking hazardous waste)) Organizations: DAVID LEWIS (CONTACT/OWNER)
MARION WILLEY & SON FORD (1800 S MAIN ST in BOUNTIFUL, UT)
STATE MASTER (Utah compliance and permitting operations) - UST DATABASE-4, UNDERGROUND STORAGE TANK PROGRAM Small Quantity Generators, between 100 kg and 1000 kg of hazardous waste/month (Resource Conservation and Recovery Act (tracking hazardous waste)) - notification Organizations: DON WILLEY (CONTACT/OWNER)
MARQUE BODY & PAINT (530 W 600 S in BOUNTIFUL, UT)
STATE MASTER (Utah compliance and permitting operations) - UST DATABASE-4, UNDERGROUND STORAGE TANK PROGRAM Small Quantity Generators, between 100 kg and 1000 kg of hazardous waste/month (Resource Conservation and Recovery Act (tracking hazardous waste)) - notification Organizations: JAYSON EIG (CONTACT/OWNER)
Housing units lacking complete plumbing facilities: 0.3% Housing units lacking complete kitchen facilities: 3.3%
88.4%Utility gas
9.6%Electricity
1.4%Bottled, tank, or LP gas
Population in 1990: 41,077. Population change in the 1990s: +2,608 (+6.3%).
Place of birth for U.S.-born residents:
This state: 33,107
Northeast: 1,375
Midwest: 2,092
South: 1,555
West: 7,979
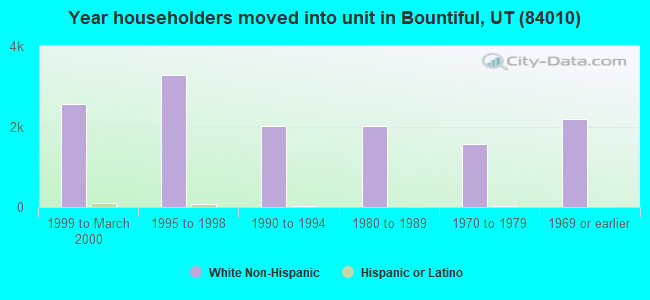
59% of the 84010 zip code residents lived in the same house 5 years ago. Out of people who lived in different houses, 52% lived in this county. Out of people who lived in different counties, 50% lived in Utah.
88% of the 84010 zip code residents lived in the same house 1 year ago. Out of people who lived in different houses, 46% moved from this county. Out of people who lived in different houses, 41% moved from different county within same state. Out of people who lived in different houses, 12% moved from different state. Out of people who lived in different houses, 3% moved from abroad.
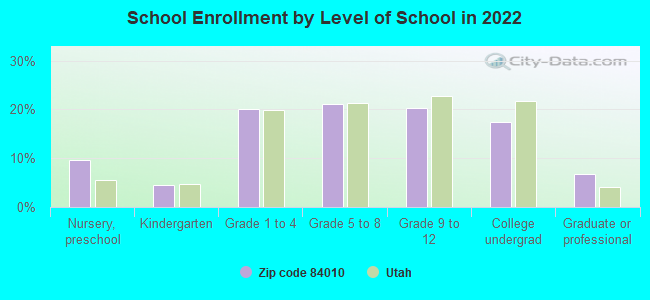
Private vs. public school enrollment:
Students in private schools in grades 1 to 8 (elementary and middle school): 609
Here:
10.7%
Utah:
7.2%
Students in private schools in grades 9 to 12 (high school): 92
Here:
3.3%
Utah:
5.3%
Students in private undergraduate colleges: 404
Here:
16.7%
Utah:
26.7%
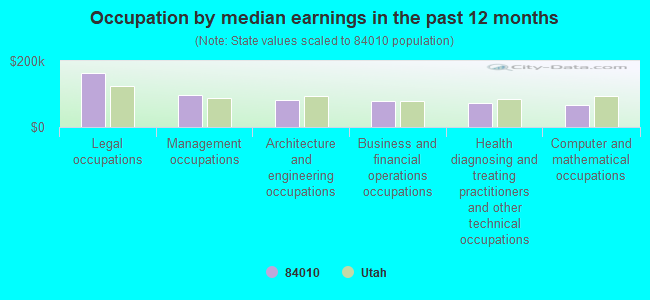
Occupation by median earnings in the past 12 months ($)
162,527Legal occupations
97,950Management occupations
81,983Architecture and engineering occupations
79,208Business and financial operations occupations
73,916Health diagnosing and treating practitioners and other technical occupations
67,464Computer and mathematical occupations
Companies with biggest federal contracts located in this zip code (BOUNTIFUL, UT):
SHIPLEY COMMUNICATION (265 S MAIN STE B; small business) : $460,280 in 4 contractsfrom 2005 to 2006
$440,000 with Air Force for Other Professional Services. Taking place in DC. Signed on 2005-09-30. Completion date: 2006-09-29.
$10,200 with Air Force for Books and Pamphlets. Signed on 2006-03-31. Completion date: 2006-04-05.
$7,200, same as above.Signed on 2005-09-29. Completion date: 2005-10-31.
$2,880 with Army for Books and Pamphlets. Signed on 2006-05-04. Completion date: 2006-06-03.
LIFE CARE CENTER BOUNTIFUL (2600 S 460 W) : $365,953 in 6 contractsfrom 2002 to 2003
Contracts for Nursing Home Care Contracts by Department of Veterans Affairs Signed by year:2000: $0; 2001: $0; 2002: $139,000; 2003: $226,953; 2004: $0; 2005: $0; 2006: $0.
Biggest contracts:
$130,252 with Department of Veterans Affairs for Nursing Home Care Contracts. Signed on 2003-09-15. Completion date: 2006-07-15.
$96,701, same as above.Signed on 2003-03-15. Completion date: 2006-07-15.
$88,000, same as above.Signed on 2002-01-15. Completion date: 2003-07-15.
$51,000, same as above.Signed on 2002-01-15. Completion date: 2002-07-15.
NETWORK CONSULTING SERVICES, I (535 W 500 S STE 3; small business) : $230,014 in 10 contractsfrom 2005 to 2006
Contracts for ADP Software, Packaging and Packing Bulk Materials, ADP Components, ADP Systems Analysis Services by Bureau of Reclamation, Army, Defense Logistics Agency, Air Force, and others Signed by year:2000: $0; 2001: $0; 2002: $0; 2003: $0; 2004: $0; 2005: $102,693; 2006: $127,321.
Biggest contracts:
$68,940 with Bureau of Reclamation for ADP Software. Signed on 2006-09-26. Completion date: 2006-09-27.
$40,975, same as above.Signed on 2005-05-11. Completion date: 2005-06-10.
$30,731, same as above.Signed on 2006-09-06. Completion date: 2006-09-27.
$25,724 with Army for ADP Software. Signed on 2005-01-25. Completion date: 2005-02-24.
THOMAS ENGINEERING INC (380 N 200 W STE 207; small business) : $198,858 in 7 contractsin 2004
Contracts for Architect - Engineer Services (including landscaping, interior layout, and designing), Administrative and Service Buildings by Air Force Signed by year:2000: $0; 2001: $0; 2002: $0; 2003: $0; 2004: $198,858; 2005: $0; 2006: $0.
Biggest contracts:
$48,631 with Air Force for Architect - Engineer Services (including landscaping, interior layout, and designing). Signed on 2004-09-29. Completion date: 2004-12-13.
$35,653, same as above.Signed on 2004-06-07. Completion date: 2004-10-05.
$33,464, same as above.Signed on 2004-09-30. Completion date: 2005-01-17.
$24,939 with Air Force for Administrative and Service Buildings. Signed on 2004-03-17. Completion date: 2004-05-19.
TELOS CORPORATION (CALIFORNIA) (530 E 1500 S) : $182,000 in 3 contractsfrom 1999 to 2001
$75,312 with Navy for Maintenance, Repair and Rebuilding of Equipment -- Automatic Data Processing Equipment (Including Firmware), Software, Supplies and Support Equipment. Taking place in NJ. Signed on 2000-10-01. Completion date: 2001-09-30.
$73,072, same as above.Signed on 2001-10-01. Completion date: 2002-09-30.
$33,616 with Army for ADP Facility Operation and Maintenance Services. Taking place in VA. Signed on 1999-12-03. Completion date: 1999-12-03.
TODD MACHINERY INC (506 S MAIN ST; small business) : $116,020 in 2 contractsin 2002
$84,500 with Air Force for Miscellaneous Maintenance and Repair Shop Specialized Equipment. Signed on 2002-09-29. Completion date: 2003-01-24.
$31,520 with Air Force for Grinding Machines. Signed on 2002-06-18. Completion date: 2002-06-17.
INTELLIVIS, INC (2722 S DAVIS BLVD; small business)
$98,999 with Army for Other Defense -- Applied Research and Exploratory Development (R&D). Signed on 2005-11-15. Completion date: 2006-07-10.
UTAH WESTERN ROOFING LLC (2792 WOOD HOLLOW WAY; small business)
$59,610 with Army for Maintenance, Repair or Alteration of Real Property -- Ammunition Facilities. Signed on 2006-04-10. Completion date: 2006-06-01.
ENERGY CONSORTIUM INDUSTRIES (949 MILL ST; small business) : $25,932 in 3 contractsfrom 2002 to 2004
$13,000 with Army for Industrial Boilers. Signed on 2002-08-14. Completion date: 2002-08-27.
$10,082, same as above.Signed on 2004-03-17. Completion date: 2004-04-27.
$2,850 with Army for Space and Water Heating Equipment. Signed on 2004-01-29. Completion date: 2004-02-05.
M & Y INC (1120 NORTHERN HILLS DR; small business) : $23,400 in 9 contractsfrom 2002 to 2005
Contracts for Other Education and Training Services by Navy Signed by year:2000: $0; 2001: $0; 2002: $0; 2003: $0; 2004: $8,100; 2005: $15,300; 2006: $0.
Biggest contracts:
$4,050 with Navy for Other Education and Training Services. Taking place in TX. Signed on 2004-05-20. Completion date: 2004-08-26.
$4,050, same as above.Signed on 2004-02-13. Completion date: 2004-01-21.
$4,050 with Navy for Other Education and Training Services. Signed on 2005-07-11. Completion date: 2005-07-28.
$4,050, same as above.Signed on 2005-04-29. Completion date: 2005-06-02.
Top industries in this zip code by the number of employees in 2005:
Health Care and Social Assistance: Nursing Care Facilities (500-999 employees: 1 establishment, 100-249 employees: 2 establishments, 50-99 employees: 1 establishment, 5-9 employees: 1 establishment, 1-4 employees: 1 establishment)
2002 - 2018 National Fire Incident Reporting System (NFIRS) incidents
Based on the data from the years 2002 - 2018 the average number of fire incidents per year is 46. The highest number of reported fires - 70 took place in 2003, and the least - 0 in 2010. The data has a rising trend.
When looking into fire subcategories, the most incidents belonged to: Outside Fires (42.2%), and Structure Fires (39.1%).
Fire incident types reported to NFIRS in Zip Code 84010


 Nearest zip codes: 84054, 84014, 84087, 84103, 84144, 84180.


 Based on the data from the years 2002 - 2018 the average number of fire incidents per year is 46. The highest number of reported fires - 70 took place in 2003, and the least - 0 in 2010. The data has a rising trend.
 When looking into fire subcategories, the most incidents belonged to: Outside Fires (42.2%), and Structure Fires (39.1%).