Estimated zip code population in 2022: 56,633 Zip code population in 2010: 44,625 Zip code population in 2000: 37,134
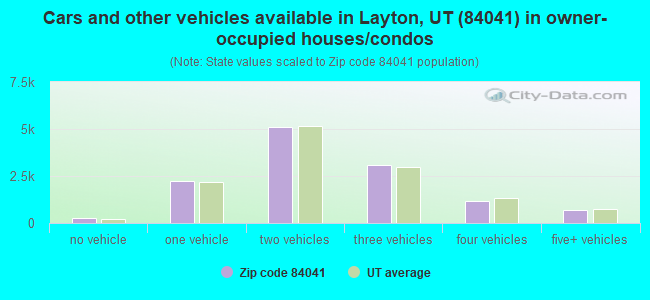
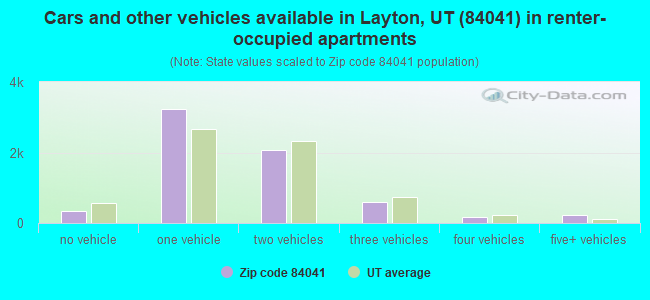
Houses and condos: 19,767 Renter-occupied apartments: 6,618
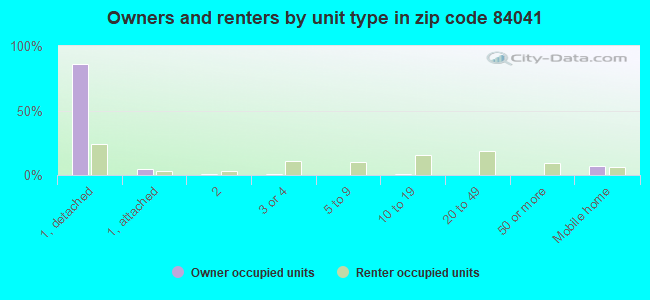
% of renters here:
35%
State:
29%
March 2022 cost of living index in zip code 84041: 89.0 (less than average, U.S. average is 100)
Land area: 14.8 sq. mi. Water area: 0.0 sq. mi.
Population density: 3,837 people per square mile
(average).
OSM Map
General Map
Google Map
MSN Map
OSM Map
General Map
Google Map
MSN Map
OSM Map
General Map
Google Map
MSN Map
OSM Map
General Map
Google Map
MSN Map
Please wait while loading the map...
Real estate property taxes paid for housing units in 2022:
This zip code:
0.5% ($2,068)
Utah:
0.5% ($2,376)
Median real estate property taxes paid for housing units with mortgages in 2022: $2,167 (0.5%) Median real estate property taxes paid for housing units with no mortgage in 2022: $1,759 (0.5%)
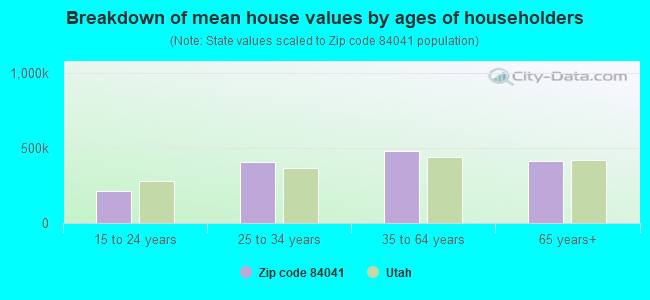
Estimated median house/condo value in 2022: $433,960
84041:
$433,960
Utah:
$499,500
According to our research of Utah and other state lists, there were 98 registered sex offenders living in 84041 zip code as of April 19, 2024. The ratio of all residents to sex offenders in zip code 84041 is 507 to 1. The ratio of registered sex offenders to all residents in this zip code is lower than the state average.
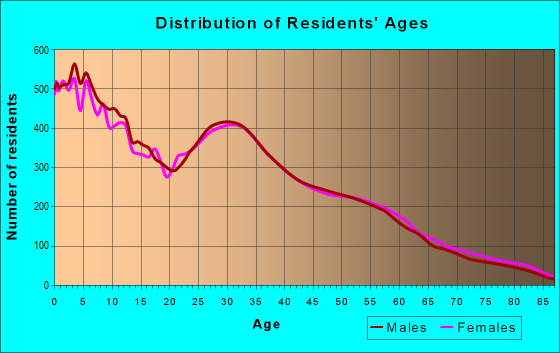
Median resident age:
This zip code:
31.0 years
Utah median age:
32.1 years
Average household size:
This zip code:
2.9 people
Utah:
3.0 people
Averages for the 2020 tax year for zip code 84041, filed in 2021:
Average Adjusted Gross Income (AGI) in 2020: $65,809 (Individual Income Tax Returns)
Here:
$65,809
State:
$81,660
Salary/wage: $58,042 (reported on 89.3% of returns)
Here:
$58,042
State:
$63,027
(% of AGI for various income ranges: 1279.2% for AGIs below $25k, 3796.0% for AGIs $25k-50k, 6757.6% for AGIs $50k-75k, 10097.2% for AGIs $75k-100k, 18353.1% for AGIs $100k-200k, 55790.7% for AGIs over 200k)
Taxable interest for individuals: $913 (reported on 25.4% of returns)
This zip code:
$913
Utah:
$2,255
(% of AGI for various income ranges: 6.6% for AGIs below $25k, 13.4% for AGIs $25k-50k, 20.7% for AGIs $50k-75k, 35.9% for AGIs $75k-100k, 53.4% for AGIs $100k-200k, 685.9% for AGIs over 200k)
Ordinary dividends: $2,395 (reported on 11.7% of returns)
Here:
$2,395
State:
$7,362
(% of AGI for various income ranges: 5.0% for AGIs below $25k, 10.8% for AGIs $25k-50k, 19.0% for AGIs $50k-75k, 45.4% for AGIs $75k-100k, 81.9% for AGIs $100k-200k, 869.0% for AGIs over 200k)
Net capital gain/loss in AGI: +$15,784 (reported on 11.9% of returns)
Here:
+$15,784
State:
+$43,433
(% of AGI for various income ranges: 3.6% for AGIs below $25k, 14.7% for AGIs $25k-50k, 23.8% for AGIs $50k-75k, 67.6% for AGIs $75k-100k, 276.3% for AGIs $100k-200k, 12177.9% for AGIs over 200k)
Profit/loss from business: +$7,671 (reported on 13.3% of returns)
Here:
+$7,671
State:
+$9,957
(% of AGI for various income ranges: 69.7% for AGIs below $25k, 86.5% for AGIs $25k-50k, 155.5% for AGIs $50k-75k, 140.1% for AGIs $75k-100k, 214.7% for AGIs $100k-200k, 1446.9% for AGIs over 200k)
Taxable individual retirement arrangement distribution: $16,160 (reported on 4.9% of returns)
84041:
$16,160
Utah:
$21,167
(% of AGI for various income ranges: 21.4% for AGIs below $25k, 51.0% for AGIs $25k-50k, 89.5% for AGIs $50k-75k, 151.2% for AGIs $75k-100k, 266.9% for AGIs $100k-200k, 1132.8% for AGIs over 200k)
Self-employed (Keogh) retirement plans: $24,633 (reported on 0.1% of returns)
84041:
$24,633
Utah:
$29,069
(% of AGI for various income ranges: 30.7% for AGIs $100k-200k)
Total itemized deductions: $33,514 (reported on 12.6% of returns)
Here:
$33,514
State:
$41,056
(% of AGI for various income ranges: 17.9% for AGIs below $25k, 79.3% for AGIs $25k-50k, 290.6% for AGIs $50k-75k, 574.1% for AGIs $75k-100k, 2031.9% for AGIs $100k-200k, 9646.6% for AGIs over 200k)
Charity contributions: $15,712 (reported on 11.2% of returns)
Here:
$15,712
State:
$22,261
(% of AGI for various income ranges: 2.7% for AGIs below $25k, 13.6% for AGIs $25k-50k, 60.4% for AGIs $50k-75k, 170.7% for AGIs $75k-100k, 810.6% for AGIs $100k-200k, 5746.6% for AGIs over 200k)
Taxes paid: $7,838 (reported on 12.5% of returns)
84041:
$7,838
State:
$7,985
(% of AGI for various income ranges: 2.3% for AGIs below $25k, 11.8% for AGIs $25k-50k, 67.9% for AGIs $50k-75k, 141.7% for AGIs $75k-100k, 548.3% for AGIs $100k-200k, 1693.8% for AGIs over 200k)
Earned income credit: $2,241 (reported on 12.9% of returns)
Here:
$2,241
State:
$2,169
(% of AGI for various income ranges: 70.2% for AGIs below $25k, 62.2% for AGIs $25k-50k, 2.6% for AGIs $50k-75k)
Percentage of individuals using paid preparers for their 2020 taxes: 94.5%
Here:
95%
State:
94%
(% for various income ranges: 92.5% for AGIs below $25k, 95.0% for AGIs $25k-50k, 95.0% for AGIs $50k-75k, 95.5% for AGIs $75k-100k, 95.6% for AGIs $100k-200k, 97.4% for AGIs over 200k)
Averages for the 2012 tax year for zip code 84041, filed in 2013:
Average Adjusted Gross Income (AGI) in 2012: $48,976 (Individual Income Tax Returns)
Here:
$48,976
State:
$60,327
Salary/wage: $44,928 (reported on 89.8% of returns)
Here:
$44,928
State:
$48,762
(% of AGI for various income ranges: 84.4% for AGIs below $25k, 83.5% for AGIs $25k-50k, 84.3% for AGIs $50k-75k, 86.0% for AGIs $75k-100k, 83.6% for AGIs $100k-200k, 56.3% for AGIs over 200k)
Taxable interest for individuals: $567 (reported on 34.3% of returns)
This zip code:
$567
Utah:
$1,534
(% of AGI for various income ranges: 0.6% for AGIs below $25k, 0.3% for AGIs $25k-50k, 0.3% for AGIs $50k-75k, 0.3% for AGIs $75k-100k, 0.4% for AGIs $100k-200k, 0.9% for AGIs over 200k)
Ordinary dividends: $1,798 (reported on 10.2% of returns)
Here:
$1,798
State:
$5,711
(% of AGI for various income ranges: 0.4% for AGIs below $25k, 0.3% for AGIs $25k-50k, 0.2% for AGIs $50k-75k, 0.3% for AGIs $75k-100k, 0.4% for AGIs $100k-200k, 1.4% for AGIs over 200k)
Net capital gain/loss in AGI: +$3,039 (reported on 8.0% of returns)
Here:
+$3,039
State:
+$23,734
(% of AGI for various income ranges: 0.2% for AGIs $50k-75k, 0.2% for AGIs $75k-100k, 0.8% for AGIs $100k-200k, 3.3% for AGIs over 200k)
Profit/loss from business: +$6,004 (reported on 11.9% of returns)
Here:
+$6,004
State:
+$8,845
(% of AGI for various income ranges: 3.2% for AGIs below $25k, 1.5% for AGIs $25k-50k, 1.2% for AGIs $50k-75k, 1.4% for AGIs $75k-100k, 0.9% for AGIs $100k-200k, 1.8% for AGIs over 200k)
Taxable individual retirement arrangement distribution: $10,944 (reported on 5.7% of returns)
84041:
$10,944
Utah:
$15,565
(% of AGI for various income ranges: 1.5% for AGIs below $25k, 1.0% for AGIs $25k-50k, 1.1% for AGIs $50k-75k, 1.1% for AGIs $75k-100k, 2.0% for AGIs $100k-200k)
Total itemized deductions: $20,529 (25% of AGI, reported on 36.4% of returns)
Here:
$20,529
State:
$25,197
Here:
24.7% of AGI
State:
22.4% of AGI
(% of AGI for various income ranges: 5.9% for AGIs below $25k, 11.0% for AGIs $25k-50k, 16.6% for AGIs $50k-75k, 18.5% for AGIs $75k-100k, 18.6% for AGIs $100k-200k, 14.9% for AGIs over 200k)
Charity contributions: $6,381 (reported on 31.4% of returns)
Here:
$6,381
State:
$8,502
(% of AGI for various income ranges: 0.8% for AGIs below $25k, 2.1% for AGIs $25k-50k, 4.0% for AGIs $50k-75k, 5.1% for AGIs $75k-100k, 5.5% for AGIs $100k-200k, 6.7% for AGIs over 200k)
Taxes paid: $5,260 (reported on 36.4% of returns)
84041:
$5,260
State:
$7,001
(% of AGI for various income ranges: 0.9% for AGIs below $25k, 2.1% for AGIs $25k-50k, 3.8% for AGIs $50k-75k, 4.8% for AGIs $75k-100k, 5.6% for AGIs $100k-200k, 5.0% for AGIs over 200k)
Earned income credit: $2,268 (reported on 18.9% of returns)
Here:
$2,268
State:
$2,259
(% of AGI for various income ranges: 6.5% for AGIs below $25k, 1.4% for AGIs $25k-50k)
Percentage of individuals using paid preparers for their 2012 taxes: 43.2%
Here:
43%
State:
51%
(% for various income ranges: 41.1% for AGIs below $25k, 45.3% for AGIs $25k-50k, 42.5% for AGIs $50k-75k, 42.2% for AGIs $75k-100k, 44.9% for AGIs $100k-200k, 73.7% for AGIs over 200k)
Averages for the 2004 tax year for zip code 84041, filed in 2005:
Average Adjusted Gross Income (AGI) in 2004: $39,687 (Individual Income Tax Returns)
Here:
$39,687
State:
$45,498
Salary/wage: $37,229 (reported on 90.5% of returns)
Here:
$37,229
State:
$38,975
(% of AGI for various income ranges: 145.5% for AGIs below $10k, 82.7% for AGIs $10k-25k, 84.6% for AGIs $25k-50k, 88.9% for AGIs $50k-75k, 89.9% for AGIs $75k-100k, 70.1% for AGIs over 100k)
Taxable interest for individuals: $570 (reported on 46.7% of returns)
This zip code:
$570
Utah:
$1,445
(% of AGI for various income ranges: 2.0% for AGIs below $10k, 0.9% for AGIs $10k-25k, 0.7% for AGIs $25k-50k, 0.5% for AGIs $50k-75k, 0.6% for AGIs $75k-100k, 0.8% for AGIs over 100k)
Taxable dividends: $941 (reported on 12.0% of returns)
Here:
$941
State:
$3,152
(% of AGI for various income ranges: 0.9% for AGIs below $10k, 0.2% for AGIs $10k-25k, 0.2% for AGIs $25k-50k, 0.2% for AGIs $50k-75k, 0.2% for AGIs $75k-100k, 0.7% for AGIs over 100k)
Net capital gain/loss: +$10,590 (reported on 9.6% of returns)
Here:
+$10,590
State:
+$14,059
(% of AGI for various income ranges: 0.8% for AGIs below $10k, 0.0% for AGIs $10k-25k, 0.2% for AGIs $25k-50k, 0.4% for AGIs $50k-75k, 0.3% for AGIs $75k-100k, 13.8% for AGIs over 100k)
Profit/loss from business: +$4,406 (reported on 12.3% of returns)
Here:
+$4,406
State:
+$6,903
(% of AGI for various income ranges: -0.3% for AGIs below $10k, 2.5% for AGIs $10k-25k, 1.3% for AGIs $25k-50k, 1.1% for AGIs $50k-75k, 1.0% for AGIs $75k-100k, 1.8% for AGIs over 100k)
IRA payment deduction: $2,280 (reported on 1.5% of returns)
84041:
$2,280
Utah:
$2,970
(% of AGI for various income ranges: 0.0% for AGIs $10k-25k, 0.1% for AGIs $25k-50k, 0.1% for AGIs $50k-75k, 0.1% for AGIs $75k-100k, 0.1% for AGIs over 100k)
Self-employed pension: $4,100 (reported on 0.1% of returns)
Here:
$4,100
Utah:
$14,916
Total itemized deductions: $16,792 (26% of AGI, reported on 39.0% of returns)
Here:
$16,792
State:
$20,312
Here:
26.0% of AGI
State:
24.9% of AGI
(% of AGI for various income ranges: 11.8% for AGIs below $10k, 6.7% for AGIs $10k-25k, 14.7% for AGIs $25k-50k, 19.5% for AGIs $50k-75k, 20.2% for AGIs $75k-100k, 17.2% for AGIs over 100k)
Charity contributions deductions: $4,491 (7% of AGI, reported on 35.8% of returns)
Here:
$4,491
State:
$6,250
Here:
6.8% of AGI
State:
7.4% of AGI
(% of AGI for various income ranges: 1.5% for AGIs below $10k, 1.2% for AGIs $10k-25k, 3.1% for AGIs $25k-50k, 4.6% for AGIs $50k-75k, 5.1% for AGIs $75k-100k, 5.7% for AGIs over 100k)
Total tax: $4,054 (reported on 72.3% of returns)
84041:
$4,054
State:
$6,523
(% of AGI for various income ranges: 2.5% for AGIs below $10k, 3.8% for AGIs $10k-25k, 5.2% for AGIs $25k-50k, 6.6% for AGIs $50k-75k, 8.4% for AGIs $75k-100k, 13.7% for AGIs over 100k)
Earned income credit: $1,688 (reported on 14.9% of returns)
Here:
$1,688
State:
$1,703
Percentage of individuals using paid preparers for their 2004 taxes: 46.3%
Here:
46%
State:
53%
(% for various income ranges: 37.7% for AGIs below $10k, 49.1% for AGIs $10k-25k, 48.0% for AGIs $25k-50k, 46.3% for AGIs $50k-75k, 44.5% for AGIs $75k-100k, 56.5% for AGIs over 100k)
Likely homosexual households (counted as self-reported same-sex unmarried-partner households)
Lesbian couples: 0.0% of all households
Gay men: 0.1% of all households
Household received Food Stamps/SNAP in the past 12 months: 1,247 Household did not receive Food Stamps/SNAP in the past 12 months: 17,929
Women who had a birth in the past 12 months: 658 (520 now married, 130 unmarried) Women who did not have a birth in the past 12 months: 15,049 (7,524 now married, 7,520 unmarried)
Housing units in zip code 84041 with a mortgage: 8,979 (1,515 second mortgage, 55 home equity loan, 1,152 both second mortgage and home equity loan) Houses without a mortgage: 141
Median monthly owner costs for units with a mortgage: $1,686 Median monthly owner costs for units without a mortgage: $462
Residents with income below the poverty level in 2022:
This zip code:
9.5%
Whole state:
8.2%
Residents with income below 50% of the poverty level in 2022:
This zip code:
4.0%
Whole state:
4.3%
Median number of rooms in houses and condos:
Here:
7.3
State:
7.6
Median number of rooms in apartments:
Here:
4.4
State:
4.3
Notable locations in this zip code not listed on our city pages
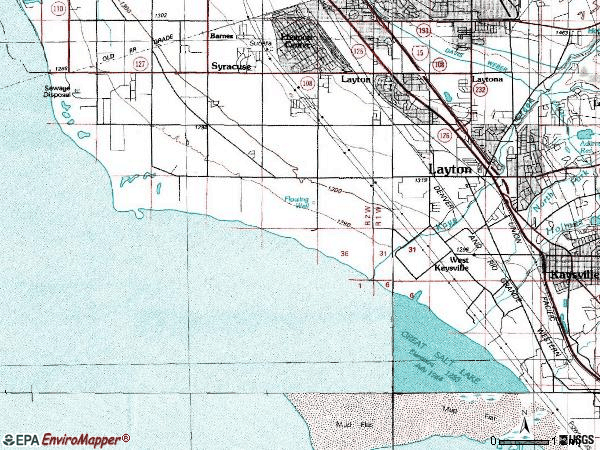
Notable locations in zip code 84041: Layton Industrial Park (A), Circle L Mobile Home Park (B), Layton Station (C), Layton City Fire Department Station 51 (D), Layton City Fire Department Station 53 (E). Display/hide their locations on the map
Shopping Centers: Layton Village Center Shopping Center (1), Layton Hills Mall Shopping Center (2), Antelope Square Shopping Center (3), Layton Hills Mall Convenience Center (4), Hillgate Shopping Center (5), Fort Lane Shopping Center (6). Display/hide their locations on the map
Churches in zip code 84041 include: The Church of Jesus Christ of Latter Day Saints (A), Calvery Chapel Agape Fellowship (B), Faith Baptist Church (C), First Assembly of God Church (D), Hillfield Catholic Chapel (E), Hillfield Protestant Chapel (F), Layton Community Church (G), Layton Hills Baptist Church (H), Rosewood Lane Nazarene Chapel (I). Display/hide their locations on the map
12,655 married couples with children.
2,935 single-parent households (490 men, 2,445 women).
86.2% of residents of 84041 zip code speak English at home.
10.5% of residents speak Spanish at home (65% very well, 21% well, 13% not well, 1% not at all).
1.1% of residents speak other Indo-European language at home (80% very well, 17% well, 4% not well).
1.9% of residents speak Asian or Pacific Island language at home (76% very well, 19% well, 3% not well, 2% not at all).
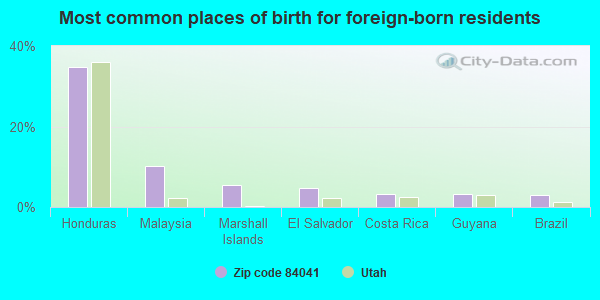
Foreign born population: 4,047 (7.1%) (47.6% of them are naturalized citizens)
Major facilities with environmental interests located in this zip code:
LAYTON HIGH (440 LANCER LN in LAYTON, UT)
STATE MASTER (Utah compliance and permitting operations) - UST DATABASE-4, UNDERGROUND STORAGE TANK PROGRAM (National Center for Education Statistics) - STATE ID-07 710 Organizations: DAVIS SCHOOL DISTRICT (SCHOOL DISTRICT)
LAYTON CITY PARKS SHOP (437 N WASATCH DR in LAYTON, UT)
STATE MASTER (Utah compliance and permitting operations) - UST DATABASE-4, UNDERGROUND STORAGE TANK PROGRAM (Integrated Compliance Information System) - ICIS-08-1992-0261, FORMAL ENFORCEMENT ACTION
GENEVA ROCK PRODUCTS (750 E. 3000 N. in LAYTON, UT)
AIR MINOR (AIRS/AFS) STATE MASTER (Utah compliance and permitting operations) - AQ CORE-1, , UST DATABASE-4, UNDERGROUND STORAGE TANK PROGRAM CRITERIA AND HAZARDOUS AIR POLLUTANT INVENTORY (Inventory of air pollution sources) Small Quantity Generators, between 100 kg and 1000 kg of hazardous waste/month (Resource Conservation and Recovery Act (tracking hazardous waste)) - notification Business SIC classification: CONCRETE PRODUCTS, EXCEPT BLOCK AND BRICK Organizations: GENEVA ROCK PRODUCTS INC (CONTACT/OWNER)
Alternative names: Cement Plant G17, GENEVA ROCK PRODUCTS - CEMENT PLANT G17
LAYTON HILLS CHRYSLER PLYMOUTH DODGE (650 N MAIN in LAYTON, UT)
STATE MASTER (Utah compliance and permitting operations) - UST DATABASE-4, UNDERGROUND STORAGE TANK PROGRAM Small Quantity Generators, between 100 kg and 1000 kg of hazardous waste/month (Resource Conservation and Recovery Act (tracking hazardous waste)) - notification Alternative names: LAYTON HILLS DODGE
ED KENLEY FORD (1888 N MAIN ST in LAYTON, UT)
STATE MASTER (Utah compliance and permitting operations) - UST DATABASE-4, UNDERGROUND STORAGE TANK PROGRAM Small Quantity Generators, between 100 kg and 1000 kg of hazardous waste/month (Resource Conservation and Recovery Act (tracking hazardous waste)) - notification Organizations: EDWARD A KENLEY (CONTACT/OWNER)
LAYTON CITY CORPORATION (137 W GENTILE ST in LAYTON, UT)
STATE MASTER (Utah compliance and permitting operations) - UST DATABASE-4, UNDERGROUND STORAGE TANK PROGRAM Conditionally Exempt Small Quantity Generators, less than 100 kg/month of hazardous waste (Resource Conservation and Recovery Act (tracking hazardous waste)) - notification Alternative names: LAYTON CITY PUBLIC WORKS SHOP
KING ELEMENTARY SCHOOL (601 E 1000 N in LAYTON, UT)
STATE MASTER (Utah compliance and permitting operations) (National Center for Education Statistics) - STATE ID-07 130 Organizations: DAVIS SCHOOL DISTRICT (SCHOOL DISTRICT)
G.B. MACHINE INC (3086 NORTH 750 EAST #4 in LAYTON, UT)
STATE MASTER (Utah compliance and permitting operations) - SQG DATABASE-7, CESQG Small Quantity Generators, between 100 kg and 1000 kg of hazardous waste/month (Resource Conservation and Recovery Act (tracking hazardous waste)) - notification Organizations: GLEN BOWDEN (CONTACT/OWNER)
ADAMS ELEM SCH (2200 E 2500 N in LAYTON, UT)
(National Center for Education Statistics) - STATE ID-07 102 Organizations: DAVIS SCHOOL DISTRICT (SCHOOL DISTRICT)
HERITAGE ELEM SCH (1354 W WEAVER LN in LAYTON, UT)
(National Center for Education Statistics) - STATE ID-07 157 Organizations: DAVIS SCHOOL DISTRICT (SCHOOL DISTRICT)
LINCOLN ELEM SCH (591 W 2000 N in LAYTON, UT)
(National Center for Education Statistics) - STATE ID-07 143 Organizations: DAVIS SCHOOL DISTRICT (SCHOOL DISTRICT)
LAYTON ELEM SCH (369 W GENTILE in LAYTON, UT)
(National Center for Education Statistics) - STATE ID-07 144 Organizations: DAVIS SCHOOL DISTRICT (SCHOOL DISTRICT)
KROGER LAYTON ICE CREAM (500 NORTH SUGAR STREET in LAYTON, UT)
AIR MINOR (AIRS/AFS) ENFORCEMENT/COMPLIANCE ACTIVITY (Integrated Compliance Information System) COMPLIANCE ACTIVITY (Tracking inspections of insecticide, fungicide, and rodenticide, and toxic substances) TRI REPORTER (Tracking of toxic chemicals releasing facilities) Business SIC classification: FLUID MILK; RETAIL BAKERIES Alternative names: KROGER CORP. SMITHS FOOD & DRUG DAIRY DIV., KROGER CO. SMITHS FOOD & DRUG DIV., KROGER CORP. SMITHS FOOD & DRUG DAIRY DIV., SMITHS FOOD & DRUG DAIRY DIV., SMITHS FOOD & DRUG DAIRY DIVISION of kroger corporation, SMITHS FOOD & DRUG DIV. OF KROGER
Housing units lacking complete plumbing facilities: 0.5% Housing units lacking complete kitchen facilities: 0.7%
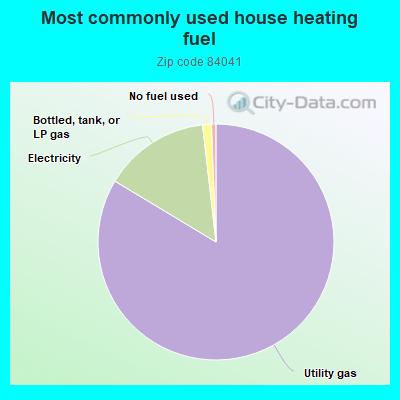
83.3%Utility gas
14.5%Electricity
1.2%Bottled, tank, or LP gas
0.6%No fuel used
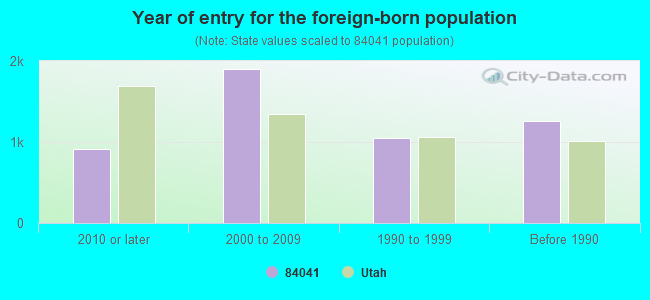
Population in 1990: 33,600. Population change in the 1990s: +3,534 (+10.5%).
Place of birth for U.S.-born residents:
This state: 34,148
Northeast: 1,614
Midwest: 2,512
South: 3,447
West: 9,612
43% of the 84041 zip code residents lived in the same house 5 years ago. Out of people who lived in different houses, 45% lived in this county. Out of people who lived in different counties, 50% lived in Utah.
88% of the 84041 zip code residents lived in the same house 1 year ago. Out of people who lived in different houses, 47% moved from this county. Out of people who lived in different houses, 32% moved from different county within same state. Out of people who lived in different houses, 20% moved from different state. Out of people who lived in different houses, 1% moved from abroad.
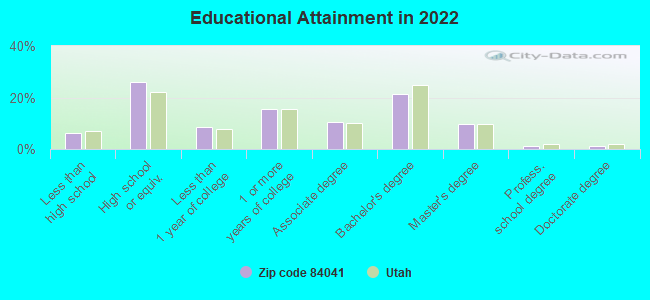
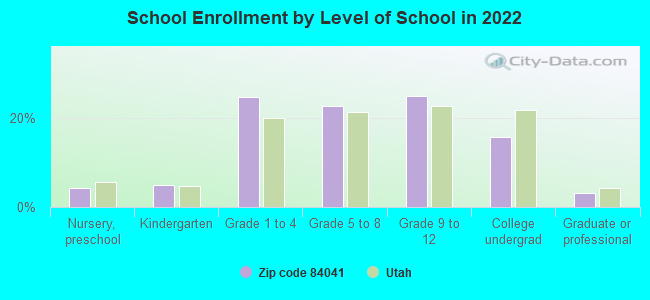
Private vs. public school enrollment:
Students in private schools in grades 1 to 8 (elementary and middle school): 313
Here:
3.9%
Utah:
7.2%
Students in private schools in grades 9 to 12 (high school): 127
Here:
3.0%
Utah:
5.3%
Students in private undergraduate colleges: 245
Here:
9.1%
Utah:
26.7%
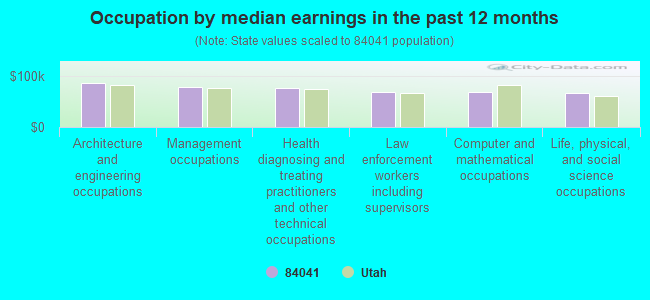
Occupation by median earnings in the past 12 months ($)
86,651Architecture and engineering occupations
78,751Management occupations
75,881Health diagnosing and treating practitioners and other technical occupations
68,991Law enforcement workers including supervisors
68,472Computer and mathematical occupations
66,763Life, physical, and social science occupations
Companies with biggest federal contracts located in this zip code (LAYTON, UT):
ICON CONSULTING GROUP INC (476 WEST HERITAGE PARK BLV; small business) : $51,617,469 in 257 contractsfrom 2001 to 2006
Contracts for Maintenance, Repair or Alteration of Real Property -- Other Administrative Facilities and Service Buildings, ADP Systems Development Services, Other ADP and Telecommunications Services (includes data storage on tapes, compact disks, etc.), Maintenance, Repair or Alteration of Real Property -- Other Warehouse Buildings, and moreby Air Force, Defense Information Systems Agency, Federal Technology Service, Army, and others Signed by year:2000: $0; 2001: $2,001,442; 2002: $5,099,973; 2003: $8,048,251; 2004: $11,842,143; 2005: $20,441,381; 2006: $4,184,279.
Biggest contracts:
$3,976,072 with Air Force for Maintenance, Repair or Alteration of Real Property -- Other Administrative Facilities and Service Buildings. Taking place in NV. Signed on 2005-09-20. Completion date: 2006-09-06.
$3,000,000 with Air Force for ADP Systems Development Services. Signed on 2005-07-11. Completion date: 2006-07-11.
$2,411,358 with Defense Information Systems Agency for Other ADP and Telecommunications Services (includes data storage on tapes, compact disks, etc.). Signed on 2006-04-12. Completion date: 2007-03-31.
$1,628,600, same as above.Signed on 2005-10-01. Completion date: 2006-09-30.
WASATCH INTERGRATED WASTE MANA (650 E HIGHWAY 193) : $11,637,447 in 7 contractsfrom 1999 to 2006
Contracts for Construction of Structures and Facilities -- Waste Treatment and Storage Facilities, Quality Control Services -- Furnace, Steam Plant, and Drying Equipment; and Nuclear Reactors, Gas Services by Air Force Signed by year:2000: $1,975,199; 2001: $0; 2002: $0; 2003: $0; 2004: $7,103,155; 2005: $0; 2006: $2,384,025.
Biggest contracts:
$3,994,854 with Air Force for Construction of Structures and Facilities -- Waste Treatment and Storage Facilities. Signed on 2004-10-01. Completion date: 2005-09-30.
$3,108,301, same as above.Signed on 2004-09-30. Completion date: 2005-09-30.
$2,384,025 with Air Force for Quality Control Services -- Furnace, Steam Plant, and Drying Equipment; and Nuclear Reactors. Signed on 2006-02-15. Completion date: 2011-02-14.
$695,641 with Air Force for Gas Services. Signed on 2000-09-30. Completion date: 2000-09-30.
HOWE ASSOCIATES, INC (849 WEST HILL FIELD RD, SU; small business) : $366,329 in 7 contractsfrom 2000 to 2006
Contracts for Maintenance, Repair and Rebuilding of Equipment -- Miscellaneous, ADP Data Entry Services, Engineering and Technical Services by Air Force Signed by year:2000: $102,366; 2001: $0; 2002: $0; 2003: $0; 2004: $100,000; 2005: $103,967; 2006: $59,996.
Biggest contracts:
$104,350 with Air Force for Maintenance, Repair and Rebuilding of Equipment -- Miscellaneous. Signed on 2000-01-20. Completion date: 2000-09-30.
$103,967, same as above.Signed on 2005-03-24. Completion date: 2005-03-31.
$100,000 with Air Force for ADP Data Entry Services. Signed on 2004-03-31. Completion date: 2005-03-31.
$59,996 with Air Force for Engineering and Technical Services. Signed on 2006-04-18. Completion date: 2007-03-31.
PROGRAFIX INTERNATIONAL, INC (819 MARSHALL WAY; small business) : $304,794 in 14 contractsfrom 2000 to 2005
Contracts for Signs, Advertising Displays, and Identification Plates, Arts/Graphics Services, Miscellaneous Items by Army Signed by year:2000: $176,565; 2001: $0; 2002: $0; 2003: $103,018; 2004: $26,707; 2005: -$1,496; 2006: $0.
Biggest contracts:
$94,422 with Army for Signs, Advertising Displays, and Identification Plates. Signed on 2003-08-14. Completion date: 2003-09-12.
$40,230 with Army for Arts/Graphics Services. Taking place in KY. Signed on 2000-09-30. Completion date: 2000-12-29.
$40,230, same as above.Signed on 2000-09-30. Completion date: 2000-12-29.
$35,760, same as above.Signed on 2000-09-30. Completion date: 2000-12-29.
TWIN D INC (3038 N 750 E; small business) : $242,091 in 3 contractsfrom 2003 to 2004
$240,603 with Air Force for Maintenance, Repair or Alteration of Real Property -- Sewage and Waste Facilities. Signed on 2004-09-22. Completion date: 2005-09-26.
$788 with Army for Maintenance, Repair and Rebuilding of Equipment -- Plumbing, Heating, and Waste Disposal Equipment. Signed on 2003-05-23. Completion date: 2003-05-14.
$700, same as above.Signed on 2003-05-23. Completion date: 2003-05-09.
CERTIFIED BUILDING MAINTENANCE (27 S MAIN ST; small business) : $224,076 in 6 contractsfrom 2000 to 2004
Contracts for Custodial Janitorial Services by Public Buildings Service, Army Signed by year:2000: $65,000; 2001: $65,000; 2002: $0; 2003: $88,616; 2004: $5,460; 2005: $0; 2006: $0.
Biggest contracts:
$83,156 with Public Buildings Service for Custodial Janitorial Services. Signed on 2003-04-15. Completion date: 2003-03-15.
$65,000, same as above.Signed on 2001-02-15. Completion date: 2002-03-15.
$65,000, same as above.Signed on 2000-02-15. Completion date: 2001-03-15.
$5,460 with Army for Custodial Janitorial Services. Signed on 2004-11-17. Completion date: 2005-09-30.
J & J PRODUCE, INC (1815 W GENTILE ST; small business) : $162,650 in 11 contractsfrom 2002 to 2006
Contracts for Seeds and Nursery Stock, Non-Food Items For Resale by Air Force, Defense Commissary Agency Signed by year:2000: $0; 2001: $0; 2002: $99,500; 2003: $0; 2004: $22,899; 2005: $31,904; 2006: $8,347.
Biggest contracts:
$60,000 with Air Force for Seeds and Nursery Stock. Signed on 2002-05-10. Completion date: 2002-06-30.
$39,500, same as above.Signed on 2002-06-06. Completion date: 2002-08-30.
$22,899 with Defense Commissary Agency for Non-Food Items For Resale. Signed on 2004-10-01. Completion date: 2005-03-31.
$9,997, same as above.Signed on 2005-04-01. Completion date: 2005-06-30.
WESTERN STATES PLUMBING AND HE (744 NORTH DIAMOND ST; small business)
$140,055 with Air Force for Maintenance, Repair and Rebuilding of Equipment -- Miscellaneous. Signed on 1999-11-12. Completion date: 2000-01-01.
ENGINEERED AIR SYSTEMS INC (763 MARSHALL WAY; small business) : $118,570 in 6 contractsfrom 2001 to 2006
Contracts for Air Purification Equipment, Fans, Air Circulators, and Blower Equipment by Air Force, U.S. Fish and Wildlife Service Signed by year:2000: $0; 2001: $35,803; 2002: $0; 2003: $62,905; 2004: $6,592; 2005: $0; 2006: $13,270.
Biggest contracts:
$62,905 with Air Force for Air Purification Equipment. Signed on 2003-09-02. Completion date: 2003-11-14.
$35,803, same as above.Signed on 2001-08-24. Completion date: 2001-10-05.
$13,270 with Air Force for Fans, Air Circulators, and Blower Equipment. Signed on 2006-06-06. Completion date: 2006-07-10.
$6,257 with U.S. Fish and Wildlife Service for Fans, Air Circulators, and Blower Equipment. Signed on 2004-06-29. Completion date: 2004-06-29.
ELECTRICAL WHOLESALE SUPPLY CO (600 N 630 W) : $89,940 in 4 contractsfrom 2001 to 2005
$54,165 with Air Force for Miscellaneous Electric Power and Distribution Equipment. Signed on 2005-09-26. Completion date: 2006-01-03.
$26,304 with Air Force for Electrical Hardware and Supplies. Signed on 2004-04-08. Completion date: 2004-05-26.
$4,800 with Army for Engine Electrical System Components, Nonaircraft. Signed on 2001-12-17. Completion date: 2002-02-27.
$4,671 with Air Force for Coils and Transformers. Signed on 2005-08-16. Completion date: 2006-07-31.
Top industries in this zip code by the number of employees in 2005:
Health Care and Social Assistance: Offices of Physicians (except Mental Health Specialists) (250-499: 1, 100-249: 1, 50-99: 1, 20-49: 5, 10-19: 5, 5-9: 7, 1-4: 9)
Finance and Insurance: Financial Transactions Processing, Reserve, and Clearinghouse Activities (500-999: 1)
Health Care and Social Assistance: General Medical and Surgical Hospitals (500-999: 1)
People in group quarters in 2010:
26 people in residential treatment centers for juveniles (non-correctional)
11 people in group homes intended for adults
3 people in other noninstitutional facilities
People in group quarters in 2000:
61 people in other group homes
9 people in homes for the mentally retarded
4 people in nursing homes
2 people in mental (psychiatric) hospitals or wards
Fatal accident statistics in 2014:
Fatal accident count: 2
Vehicles involved in fatal accidents: 3
Fatal accidents caused by drunken drivers: 2
Fatalities: 2
Persons involved in fatal accidents: 3
Pedestrians involved in fatal accidents: 1
Fatal accident statistics in 2013:
Fatal accident count: 1
Vehicles involved in fatal accidents: 1
Fatal accidents caused by drunken drivers: 0
Fatalities: 1
Persons involved in fatal accidents: 1
Pedestrians involved in fatal accidents: 0
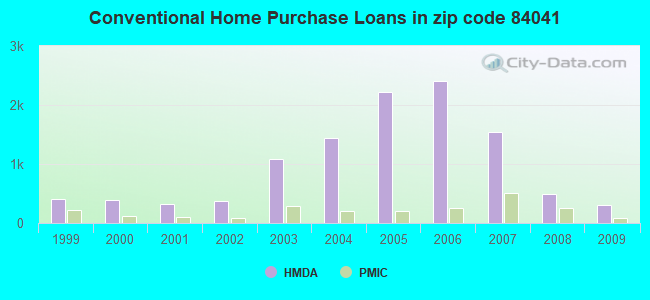
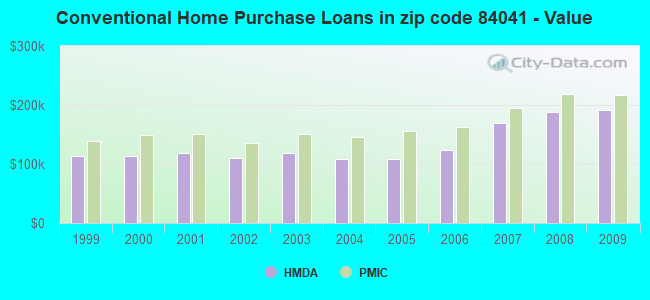
Home Mortgage Disclosure Act Aggregated Statistics For Year 2009 (Based on 5 full and 12 partial tracts)
A) FHA, FSA/RHS & VA Home Purchase Loans
B) Conventional Home Purchase Loans
C) Refinancings
D) Home Improvement Loans
E) Loans on Dwellings For 5+ Families
F) Non-occupant Loans on < 5 Family Dwellings (A B C & D)
G) Loans On Manufactured Home Dwelling (A B C & D)
Number
Average Value
Number
Average Value
Number
Average Value
Number
Average Value
Number
Average Value
Number
Average Value
Number
Average Value
LOANS ORIGINATED
655
$194,326
307
$191,227
3,067
$181,318
100
$59,278
4
$1,797,505
86
$145,336
10
$53,563
APPLICATIONS APPROVED, NOT ACCEPTED
31
$151,492
20
$237,852
325
$192,826
16
$37,340
0
$0
2
$103,795
8
$49,289
APPLICATIONS DENIED
74
$173,677
64
$172,355
717
$190,587
57
$53,096
2
$1,843,340
30
$163,287
27
$36,787
APPLICATIONS WITHDRAWN
72
$181,176
35
$172,153
466
$186,010
17
$72,704
2
$3,686,680
14
$134,994
5
$59,334
FILES CLOSED FOR INCOMPLETENESS
9
$173,717
6
$176,037
117
$188,772
19
$54,191
0
$0
5
$134,438
2
$8,325
Aggregated Statistics For Year 2008 (Based on 5 full and 12 partial tracts)
A) FHA, FSA/RHS & VA Home Purchase Loans
B) Conventional Home Purchase Loans
C) Refinancings
D) Home Improvement Loans
E) Loans on Dwellings For 5+ Families
F) Non-occupant Loans on < 5 Family Dwellings (A B C & D)
G) Loans On Manufactured Home Dwelling (A B C & D)
Number
Average Value
Number
Average Value
Number
Average Value
Number
Average Value
Number
Average Value
Number
Average Value
Number
Average Value
LOANS ORIGINATED
515
$189,041
496
$188,313
1,780
$175,672
134
$69,854
2
$3,784,000
119
$148,070
16
$33,694
APPLICATIONS APPROVED, NOT ACCEPTED
24
$204,544
60
$234,592
257
$171,961
47
$91,532
0
$0
25
$196,772
10
$61,424
APPLICATIONS DENIED
58
$184,835
122
$172,738
738
$192,120
149
$67,866
3
$580,360
60
$184,081
35
$38,065
APPLICATIONS WITHDRAWN
63
$192,794
60
$172,608
376
$180,221
40
$119,154
0
$0
41
$144,789
3
$40,363
FILES CLOSED FOR INCOMPLETENESS
6
$215,102
10
$100,955
52
$175,729
13
$107,300
0
$0
4
$134,635
0
$0
Aggregated Statistics For Year 2007 (Based on 5 full and 12 partial tracts)
A) FHA, FSA/RHS & VA Home Purchase Loans
B) Conventional Home Purchase Loans
C) Refinancings
D) Home Improvement Loans
E) Loans on Dwellings For 5+ Families
F) Non-occupant Loans on < 5 Family Dwellings (A B C & D)
G) Loans On Manufactured Home Dwelling (A B C & D)
Number
Average Value
Number
Average Value
Number
Average Value
Number
Average Value
Number
Average Value
Number
Average Value
Number
Average Value
LOANS ORIGINATED
312
$174,585
1,549
$169,784
1,977
$149,143
262
$64,900
4
$6,245,308
307
$150,232
21
$30,213
APPLICATIONS APPROVED, NOT ACCEPTED
6
$234,843
192
$173,717
296
$142,909
48
$64,910
0
$0
47
$132,544
11
$47,621
APPLICATIONS DENIED
29
$177,030
382
$167,368
932
$154,418
210
$64,019
0
$0
117
$169,378
45
$43,554
APPLICATIONS WITHDRAWN
25
$169,594
141
$162,582
370
$154,627
42
$100,828
0
$0
40
$159,869
0
$0
FILES CLOSED FOR INCOMPLETENESS
1
$260,460
33
$202,865
76
$159,682
14
$54,824
0
$0
10
$145,661
0
$0
Aggregated Statistics For Year 2006 (Based on 5 full and 12 partial tracts)
A) FHA, FSA/RHS & VA Home Purchase Loans
B) Conventional Home Purchase Loans
C) Refinancings
D) Home Improvement Loans
E) Loans on Dwellings For 5+ Families
F) Non-occupant Loans on < 5 Family Dwellings (A B C & D)
G) Loans On Manufactured Home Dwelling (A B C & D)
Number
Average Value
Number
Average Value
Number
Average Value
Number
Average Value
Number
Average Value
Number
Average Value
Number
Average Value
LOANS ORIGINATED
319
$163,866
2,410
$123,546
1,753
$124,487
226
$45,943
3
$1,568,863
515
$119,568
9
$136,721
APPLICATIONS APPROVED, NOT ACCEPTED
15
$159,853
220
$114,939
321
$126,258
61
$41,580
0
$0
53
$138,701
13
$30,453
APPLICATIONS DENIED
26
$151,034
555
$125,830
946
$124,327
198
$40,183
2
$1,515
147
$156,901
38
$61,942
APPLICATIONS WITHDRAWN
41
$158,439
345
$114,810
597
$131,712
29
$81,070
0
$0
83
$135,087
0
$0
FILES CLOSED FOR INCOMPLETENESS
3
$80,020
72
$111,605
147
$140,702
4
$80,420
0
$0
14
$139,251
0
$0
Aggregated Statistics For Year 2005 (Based on 5 full and 12 partial tracts)
A) FHA, FSA/RHS & VA Home Purchase Loans
B) Conventional Home Purchase Loans
C) Refinancings
D) Home Improvement Loans
E) Loans on Dwellings For 5+ Families
F) Non-occupant Loans on < 5 Family Dwellings (A B C & D)
G) Loans On Manufactured Home Dwelling (A B C & D)
Number
Average Value
Number
Average Value
Number
Average Value
Number
Average Value
Number
Average Value
Number
Average Value
Number
Average Value
LOANS ORIGINATED
363
$143,028
2,226
$108,152
1,751
$120,613
155
$48,966
6
$682,627
357
$106,854
15
$39,816
APPLICATIONS APPROVED, NOT ACCEPTED
5
$126,088
217
$96,605
335
$110,674
28
$46,128
0
$0
47
$111,366
12
$43,772
APPLICATIONS DENIED
36
$129,815
503
$92,945
960
$123,703
159
$42,445
2
$9,965
103
$107,417
42
$44,660
APPLICATIONS WITHDRAWN
29
$137,402
583
$111,145
589
$127,509
58
$154,639
0
$0
52
$117,254
5
$125,216
FILES CLOSED FOR INCOMPLETENESS
1
$204,570
101
$95,522
278
$143,229
8
$55,996
0
$0
18
$124,322
0
$0
Aggregated Statistics For Year 2004 (Based on 5 full and 12 partial tracts)
A) FHA, FSA/RHS & VA Home Purchase Loans
B) Conventional Home Purchase Loans
C) Refinancings
D) Home Improvement Loans
E) Loans on Dwellings For 5+ Families
F) Non-occupant Loans on < 5 Family Dwellings (A B C & D)
G) Loans On Manufactured Home Dwelling (A B C & D)
Number
Average Value
Number
Average Value
Number
Average Value
Number
Average Value
Number
Average Value
Number
Average Value
Number
Average Value
LOANS ORIGINATED
460
$130,845
1,446
$107,646
2,049
$124,441
127
$35,028
8
$3,531,371
269
$110,890
21
$42,418
APPLICATIONS APPROVED, NOT ACCEPTED
13
$137,034
261
$98,698
348
$113,432
22
$28,844
0
$0
54
$94,597
13
$55,052
APPLICATIONS DENIED
49
$122,539
370
$98,563
941
$120,610
128
$34,001
1
$1,521,900
83
$103,141
33
$29,444
APPLICATIONS WITHDRAWN
36
$126,827
173
$116,445
611
$126,625
23
$69,759
0
$0
42
$105,206
1
$66,850
FILES CLOSED FOR INCOMPLETENESS
8
$95,866
48
$112,127
203
$137,391
4
$21,230
0
$0
1
$109,100
2
$63,885
Aggregated Statistics For Year 2003 (Based on 5 full and 12 partial tracts)
A) FHA, FSA/RHS & VA Home Purchase Loans
B) Conventional Home Purchase Loans
C) Refinancings
D) Home Improvement Loans
E) Loans on Dwellings For 5+ Families
F) Non-occupant Loans on < 5 Family Dwellings (A B C & D)
Number
Average Value
Number
Average Value
Number
Average Value
Number
Average Value
Number
Average Value
Number
Average Value
LOANS ORIGINATED
655
$134,100
1,091
$119,432
4,510
$122,727
107
$25,446
5
$453,778
265
$109,935
APPLICATIONS APPROVED, NOT ACCEPTED
15
$138,753
129
$118,762
532
$123,664
22
$28,265
0
$0
33
$133,695
APPLICATIONS DENIED
43
$132,284
217
$103,438
921
$120,774
96
$26,621
0
$0
57
$122,376
APPLICATIONS WITHDRAWN
33
$130,507
110
$115,181
615
$133,065
10
$18,995
0
$0
34
$106,923
FILES CLOSED FOR INCOMPLETENESS
5
$113,844
55
$120,750
133
$136,531
7
$29,557
0
$0
19
$130,921
Aggregated Statistics For Year 2002 (Based on 4 full and 4 partial tracts)
A) FHA, FSA/RHS & VA Home Purchase Loans
B) Conventional Home Purchase Loans
C) Refinancings
D) Home Improvement Loans
E) Loans on Dwellings For 5+ Families
F) Non-occupant Loans on < 5 Family Dwellings (A B C & D)
Number
Average Value
Number
Average Value
Number
Average Value
Number
Average Value
Number
Average Value
Number
Average Value
LOANS ORIGINATED
264
$126,290
374
$109,440
1,539
$114,560
66
$22,770
4
$1,079,478
89
$97,557
APPLICATIONS APPROVED, NOT ACCEPTED
4
$154,025
69
$108,737
203
$122,462
14
$10,709
2
$498,200
28
$150,046
APPLICATIONS DENIED
23
$116,112
140
$95,549
403
$108,688
47
$18,313
0
$0
30
$149,272
APPLICATIONS WITHDRAWN
20
$136,786
65
$109,638
513
$125,945
15
$64,117
0
$0
8
$76,175
FILES CLOSED FOR INCOMPLETENESS
12
$118,217
22
$73,705
97
$131,805
1
$43,680
0
$0
9
$94,829
Aggregated Statistics For Year 2001 (Based on 4 full and 4 partial tracts)
A) FHA, FSA/RHS & VA Home Purchase Loans
B) Conventional Home Purchase Loans
C) Refinancings
D) Home Improvement Loans
F) Non-occupant Loans on < 5 Family Dwellings (A B C & D)
Number
Average Value
Number
Average Value
Number
Average Value
Number
Average Value
Number
Average Value
LOANS ORIGINATED
273
$119,554
320
$118,066
1,359
$114,769
88
$17,049
94
$107,080
APPLICATIONS APPROVED, NOT ACCEPTED
10
$116,790
49
$91,954
138
$100,631
11
$15,664
8
$96,908
APPLICATIONS DENIED
25
$113,392
147
$86,343
488
$99,746
38
$20,980
24
$106,457
APPLICATIONS WITHDRAWN
16
$112,131
33
$94,133
333
$121,810
8
$22,978
15
$108,263
FILES CLOSED FOR INCOMPLETENESS
1
$168,420
22
$111,770
102
$119,487
0
$0
7
$107,531
Aggregated Statistics For Year 2000 (Based on 4 full and 4 partial tracts)
A) FHA, FSA/RHS & VA Home Purchase Loans
B) Conventional Home Purchase Loans
C) Refinancings
D) Home Improvement Loans
E) Loans on Dwellings For 5+ Families
F) Non-occupant Loans on < 5 Family Dwellings (A B C & D)
Number
Average Value
Number
Average Value
Number
Average Value
Number
Average Value
Number
Average Value
Number
Average Value
LOANS ORIGINATED
211
$117,735
391
$113,949
477
$95,491
122
$17,575
0
$0
54
$124,313
APPLICATIONS APPROVED, NOT ACCEPTED
8
$129,106
95
$63,099
121
$93,783
37
$32,001
0
$0
14
$119,839
APPLICATIONS DENIED
23
$114,614
277
$57,364
341
$76,917
103
$24,199
2
$997,980
33
$127,910
APPLICATIONS WITHDRAWN
14
$96,012
57
$117,745
183
$101,719
11
$37,291
0
$0
4
$106,808
FILES CLOSED FOR INCOMPLETENESS
3
$92,917
16
$85,552
142
$111,307
0
$0
0
$0
2
$145,430
Aggregated Statistics For Year 1999 (Based on 2 full and 4 partial tracts)
A) FHA, FSA/RHS & VA Home Purchase Loans
B) Conventional Home Purchase Loans
C) Refinancings
D) Home Improvement Loans
E) Loans on Dwellings For 5+ Families
F) Non-occupant Loans on < 5 Family Dwellings (A B C & D)
2002 - 2018 National Fire Incident Reporting System (NFIRS) incidents
Based on the data from the years 2002 - 2018 the average number of fires per year is 125. The highest number of reported fires - 148 took place in 2005, and the least - 104 in 2009. The data has a decreasing trend.
When looking into fire subcategories, the most reports belonged to: Structure Fires (38.8%), and Outside Fires (35.8%).
Fire incident types reported to NFIRS in Zip Code 84041


 Nearest zip codes: 84037, 84040, 84056, 84405, 84015, 84075.


 Based on the data from the years 2002 - 2018 the average number of fires per year is 125. The highest number of reported fires - 148 took place in 2005, and the least - 104 in 2009. The data has a decreasing trend.
 When looking into fire subcategories, the most reports belonged to: Structure Fires (38.8%), and Outside Fires (35.8%).