Estimated zip code population in 2022: 2,465
Zip code population in 2010: 2,793
Zip code population in 2000: 2,726
Houses and condos: 921
Renter-occupied apartments: 350
% of renters here:
40%State:
33%
March 2022 cost of living index in zip code 85337: 90.6
(less than average, U.S. average is 100)
Land area: 570.1
sq. mi.
Water area: 0.0
sq. mi.
Population density: 4 people per square mile (very low).
OSM Map
General Map
Google Map
MSN Map
OSM Map
General Map
Google Map
MSN Map
OSM Map
General Map
Google Map
MSN Map
OSM Map
General Map
Google Map
MSN Map
Please wait while loading the map...
Real estate property taxes paid for housing units in 2022:
This zip code:
0.4% ($559)Arizona:
0.4% ($1,786)
Median real estate property taxes paid for housing units with mortgages in 2022: $582 (0.3%)
Median real estate property taxes paid for housing units with no mortgage in 2022: $519 (0.4%)
Profiles of local businesses
Business Search - 14 Million verified businesses
Males: 1,421 Females: 1,043
For population 25 years and over in 85337:
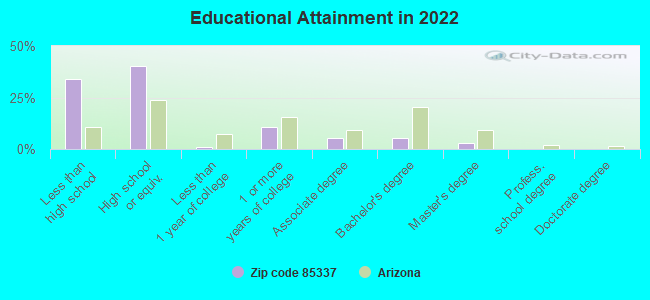
High school or higher: 64.0%Bachelor's degree or higher: 8.1%Graduate or professional degree: 3.0%Unemployed: 1.6%Mean travel time to work (commute): 13.1 minutes
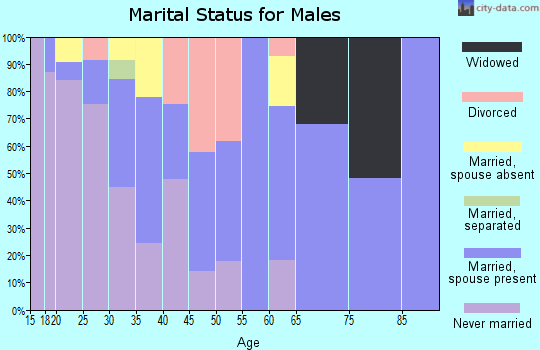
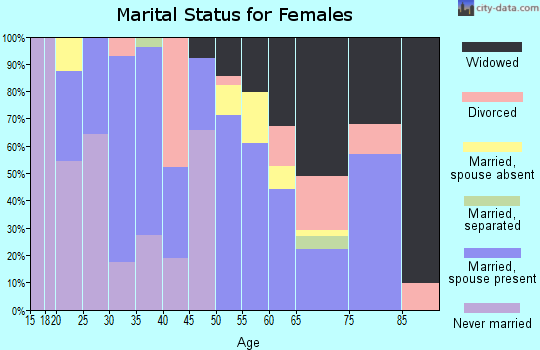
For population 15 years and over in 85337:
Never married: 32.3%Now married: 46.7%Separated: 0.0%Widowed: 7.0%Divorced: 14.1%
Zip code 85337 compared to state average:
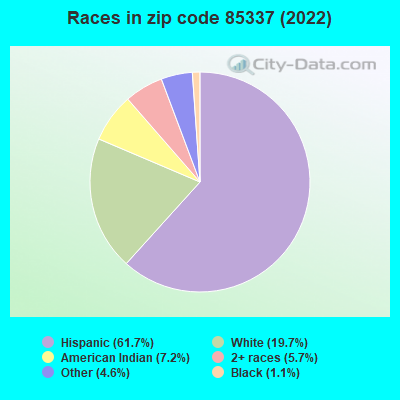
Median household income below state average. Median house value significantly below state average. Unemployed percentage below state average. Black race population percentage significantly below state average. Hispanic race population percentage above state average. Foreign-born population percentage above state average. Length of stay since moving in significantly above state average. House age above state average. Number of college students significantly below state average. Percentage of population with a bachelor's degree or higher significantly below state average. 1,519 61.7% Hispanic or Latino 486 19.7% White 177 7.2% American Indian 140 5.7% Two or more races 113 4.6% Some other race 27 1.1% Black
Data:
Median household income ($)
Median household income (% change since 2000)
Household income diversity
Ratio of average income to average house value (%)
Ratio of average income to average rent
Median household income ($) - White
Median household income ($) - Black or African American
Median household income ($) - Asian
Median household income ($) - Hispanic or Latino
Median household income ($) - American Indian and Alaska Native
Median household income ($) - Multirace
Median household income ($) - Other Race
Median household income for houses/condos with a mortgage ($)
Median household income for apartments without a mortgage ($)
Races - White alone (%)
Races - White alone (% change since 2000)
Races - Black alone (%)
Races - Black alone (% change since 2000)
Races - American Indian alone (%)
Races - American Indian alone (% change since 2000)
Races - Asian alone (%)
Races - Asian alone (% change since 2000)
Races - Hispanic (%)
Races - Hispanic (% change since 2000)
Races - Native Hawaiian and Other Pacific Islander alone (%)
Races - Native Hawaiian and Other Pacific Islander alone (% change since 2000)
Races - Two or more races (%)
Races - Two or more races (% change since 2000)
Races - Other race alone (%)
Races - Other race alone (% change since 2000)
Racial diversity
Unemployment (%)
Unemployment (% change since 2000)
Unemployment (%) - White
Unemployment (%) - Black or African American
Unemployment (%) - Asian
Unemployment (%) - Hispanic or Latino
Unemployment (%) - American Indian and Alaska Native
Unemployment (%) - Multirace
Unemployment (%) - Other Race
Population density (people per square mile)
Population - Males (%)
Population - Females (%)
Population - Males (%) - White
Population - Males (%) - Black or African American
Population - Males (%) - Asian
Population - Males (%) - Hispanic or Latino
Population - Males (%) - American Indian and Alaska Native
Population - Males (%) - Multirace
Population - Males (%) - Other Race
Population - Females (%) - White
Population - Females (%) - Black or African American
Population - Females (%) - Asian
Population - Females (%) - Hispanic or Latino
Population - Females (%) - American Indian and Alaska Native
Population - Females (%) - Multirace
Population - Females (%) - Other Race
Coronavirus confirmed cases (Apr 23, 2024)
Deaths caused by coronavirus (Apr 23, 2024)
Coronavirus confirmed cases (per 100k population) (Apr 23, 2024)
Deaths caused by coronavirus (per 100k population) (Apr 23, 2024)
Daily increase in number of cases (Apr 23, 2024)
Weekly increase in number of cases (Apr 23, 2024)
Cases doubled (in days) (Apr 23, 2024)
Hospitalized patients (Apr 18, 2022)
Negative test results (Apr 18, 2022)
Total test results (Apr 18, 2022)
COVID Vaccine doses distributed (per 100k population) (Sep 19, 2023)
COVID Vaccine doses administered (per 100k population) (Sep 19, 2023)
COVID Vaccine doses distributed (Sep 19, 2023)
COVID Vaccine doses administered (Sep 19, 2023)
Likely homosexual households (%)
Likely homosexual households (% change since 2000)
Likely homosexual households - Lesbian couples (%)
Likely homosexual households - Lesbian couples (% change since 2000)
Likely homosexual households - Gay men (%)
Likely homosexual households - Gay men (% change since 2000)
Cost of living index
Median gross rent ($)
Median contract rent ($)
Median monthly housing costs ($)
Median house or condo value ($)
Median house or condo value ($ change since 2000)
Mean house or condo value by units in structure - 1, detached ($)
Mean house or condo value by units in structure - 1, attached ($)
Mean house or condo value by units in structure - 2 ($)
Mean house or condo value by units in structure by units in structure - 3 or 4 ($)
Mean house or condo value by units in structure - 5 or more ($)
Mean house or condo value by units in structure - Boat, RV, van, etc. ($)
Mean house or condo value by units in structure - Mobile home ($)
Median house or condo value ($) - White
Median house or condo value ($) - Black or African American
Median house or condo value ($) - Asian
Median house or condo value ($) - Hispanic or Latino
Median house or condo value ($) - American Indian and Alaska Native
Median house or condo value ($) - Multirace
Median house or condo value ($) - Other Race
Median resident age
Resident age diversity
Median resident age - Males
Median resident age - Females
Median resident age - White
Median resident age - Black or African American
Median resident age - Asian
Median resident age - Hispanic or Latino
Median resident age - American Indian and Alaska Native
Median resident age - Multirace
Median resident age - Other Race
Median resident age - Males - White
Median resident age - Males - Black or African American
Median resident age - Males - Asian
Median resident age - Males - Hispanic or Latino
Median resident age - Males - American Indian and Alaska Native
Median resident age - Males - Multirace
Median resident age - Males - Other Race
Median resident age - Females - White
Median resident age - Females - Black or African American
Median resident age - Females - Asian
Median resident age - Females - Hispanic or Latino
Median resident age - Females - American Indian and Alaska Native
Median resident age - Females - Multirace
Median resident age - Females - Other Race
Commute - mean travel time to work (minutes)
Travel time to work - Less than 5 minutes (%)
Travel time to work - Less than 5 minutes (% change since 2000)
Travel time to work - 5 to 9 minutes (%)
Travel time to work - 5 to 9 minutes (% change since 2000)
Travel time to work - 10 to 19 minutes (%)
Travel time to work - 10 to 19 minutes (% change since 2000)
Travel time to work - 20 to 29 minutes (%)
Travel time to work - 20 to 29 minutes (% change since 2000)
Travel time to work - 30 to 39 minutes (%)
Travel time to work - 30 to 39 minutes (% change since 2000)
Travel time to work - 40 to 59 minutes (%)
Travel time to work - 40 to 59 minutes (% change since 2000)
Travel time to work - 60 to 89 minutes (%)
Travel time to work - 60 to 89 minutes (% change since 2000)
Travel time to work - 90 or more minutes (%)
Travel time to work - 90 or more minutes (% change since 2000)
Marital status - Never married (%)
Marital status - Now married (%)
Marital status - Separated (%)
Marital status - Widowed (%)
Marital status - Divorced (%)
Median family income ($)
Median family income (% change since 2000)
Median non-family income ($)
Median non-family income (% change since 2000)
Median per capita income ($)
Median per capita income (% change since 2000)
Median family income ($) - White
Median family income ($) - Black or African American
Median family income ($) - Asian
Median family income ($) - Hispanic or Latino
Median family income ($) - American Indian and Alaska Native
Median family income ($) - Multirace
Median family income ($) - Other Race
Median year house/condo built
Median year apartment built
Year house built - Built 2005 or later (%)
Year house built - Built 2000 to 2004 (%)
Year house built - Built 1990 to 1999 (%)
Year house built - Built 1980 to 1989 (%)
Year house built - Built 1970 to 1979 (%)
Year house built - Built 1960 to 1969 (%)
Year house built - Built 1950 to 1959 (%)
Year house built - Built 1940 to 1949 (%)
Year house built - Built 1939 or earlier (%)
Average household size
Household density (households per square mile)
Average household size - White
Average household size - Black or African American
Average household size - Asian
Average household size - Hispanic or Latino
Average household size - American Indian and Alaska Native
Average household size - Multirace
Average household size - Other Race
Occupied housing units (%)
Vacant housing units (%)
Owner occupied housing units (%)
Renter occupied housing units (%)
Vacancy status - For rent (%)
Vacancy status - For sale only (%)
Vacancy status - Rented or sold, not occupied (%)
Vacancy status - For seasonal, recreational, or occasional use (%)
Vacancy status - For migrant workers (%)
Vacancy status - Other vacant (%)
Residents with income below the poverty level (%)
Residents with income below 50% of the poverty level (%)
Children below poverty level (%)
Poor families by family type - Married-couple family (%)
Poor families by family type - Male, no wife present (%)
Poor families by family type - Female, no husband present (%)
Poverty status for native-born residents (%)
Poverty status for foreign-born residents (%)
Poverty among high school graduates not in families (%)
Poverty among people who did not graduate high school not in families (%)
Residents with income below the poverty level (%) - White
Residents with income below the poverty level (%) - Black or African American
Residents with income below the poverty level (%) - Asian
Residents with income below the poverty level (%) - Hispanic or Latino
Residents with income below the poverty level (%) - American Indian and Alaska Native
Residents with income below the poverty level (%) - Multirace
Residents with income below the poverty level (%) - Other Race
Air pollution - Air Quality Index (AQI)
Air pollution - CO
Air pollution - NO2
Air pollution - SO2
Air pollution - Ozone
Air pollution - PM10
Air pollution - PM25
Air pollution - Pb
Crime - Murders per 100,000 population
Crime - Rapes per 100,000 population
Crime - Robberies per 100,000 population
Crime - Assaults per 100,000 population
Crime - Burglaries per 100,000 population
Crime - Thefts per 100,000 population
Crime - Auto thefts per 100,000 population
Crime - Arson per 100,000 population
Crime - City-data.com crime index
Crime - Violent crime index
Crime - Property crime index
Crime - Murders per 100,000 population (5 year average)
Crime - Rapes per 100,000 population (5 year average)
Crime - Robberies per 100,000 population (5 year average)
Crime - Assaults per 100,000 population (5 year average)
Crime - Burglaries per 100,000 population (5 year average)
Crime - Thefts per 100,000 population (5 year average)
Crime - Auto thefts per 100,000 population (5 year average)
Crime - Arson per 100,000 population (5 year average)
Crime - City-data.com crime index (5 year average)
Crime - Violent crime index (5 year average)
Crime - Property crime index (5 year average)
1996 Presidential Elections Results (%) - Democratic Party (Clinton)
1996 Presidential Elections Results (%) - Republican Party (Dole)
1996 Presidential Elections Results (%) - Other
2000 Presidential Elections Results (%) - Democratic Party (Gore)
2000 Presidential Elections Results (%) - Republican Party (Bush)
2000 Presidential Elections Results (%) - Other
2004 Presidential Elections Results (%) - Democratic Party (Kerry)
2004 Presidential Elections Results (%) - Republican Party (Bush)
2004 Presidential Elections Results (%) - Other
2008 Presidential Elections Results (%) - Democratic Party (Obama)
2008 Presidential Elections Results (%) - Republican Party (McCain)
2008 Presidential Elections Results (%) - Other
2012 Presidential Elections Results (%) - Democratic Party (Obama)
2012 Presidential Elections Results (%) - Republican Party (Romney)
2012 Presidential Elections Results (%) - Other
2016 Presidential Elections Results (%) - Democratic Party (Clinton)
2016 Presidential Elections Results (%) - Republican Party (Trump)
2016 Presidential Elections Results (%) - Other
2020 Presidential Elections Results (%) - Democratic Party (Biden)
2020 Presidential Elections Results (%) - Republican Party (Trump)
2020 Presidential Elections Results (%) - Other
Ancestries Reported - Arab (%)
Ancestries Reported - Czech (%)
Ancestries Reported - Danish (%)
Ancestries Reported - Dutch (%)
Ancestries Reported - English (%)
Ancestries Reported - French (%)
Ancestries Reported - French Canadian (%)
Ancestries Reported - German (%)
Ancestries Reported - Greek (%)
Ancestries Reported - Hungarian (%)
Ancestries Reported - Irish (%)
Ancestries Reported - Italian (%)
Ancestries Reported - Lithuanian (%)
Ancestries Reported - Norwegian (%)
Ancestries Reported - Polish (%)
Ancestries Reported - Portuguese (%)
Ancestries Reported - Russian (%)
Ancestries Reported - Scotch-Irish (%)
Ancestries Reported - Scottish (%)
Ancestries Reported - Slovak (%)
Ancestries Reported - Subsaharan African (%)
Ancestries Reported - Swedish (%)
Ancestries Reported - Swiss (%)
Ancestries Reported - Ukrainian (%)
Ancestries Reported - United States (%)
Ancestries Reported - Welsh (%)
Ancestries Reported - West Indian (%)
Ancestries Reported - Other (%)
Educational Attainment - No schooling completed (%)
Educational Attainment - Less than high school (%)
Educational Attainment - High school or equivalent (%)
Educational Attainment - Less than 1 year of college (%)
Educational Attainment - 1 or more years of college (%)
Educational Attainment - Associate degree (%)
Educational Attainment - Bachelor's degree (%)
Educational Attainment - Master's degree (%)
Educational Attainment - Professional school degree (%)
Educational Attainment - Doctorate degree (%)
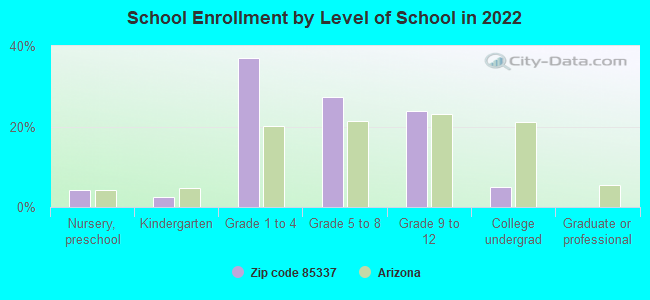
School Enrollment - Nursery, preschool (%)
School Enrollment - Kindergarten (%)
School Enrollment - Grade 1 to 4 (%)
School Enrollment - Grade 5 to 8 (%)
School Enrollment - Grade 9 to 12 (%)
School Enrollment - College undergrad (%)
School Enrollment - Graduate or professional (%)
School Enrollment - Not enrolled in school (%)
School enrollment - Public schools (%)
School enrollment - Private schools (%)
School enrollment - Not enrolled (%)
Median number of rooms in houses and condos
Median number of rooms in apartments
Housing units lacking complete plumbing facilities (%)
Housing units lacking complete kitchen facilities (%)
Density of houses
Urban houses (%)
Rural houses (%)
Households with people 60 years and over (%)
Households with people 65 years and over (%)
Households with people 75 years and over (%)
Households with one or more nonrelatives (%)
Households with no nonrelatives (%)
Population in households (%)
Family households (%)
Nonfamily households (%)
Population in families (%)
Family households with own children (%)
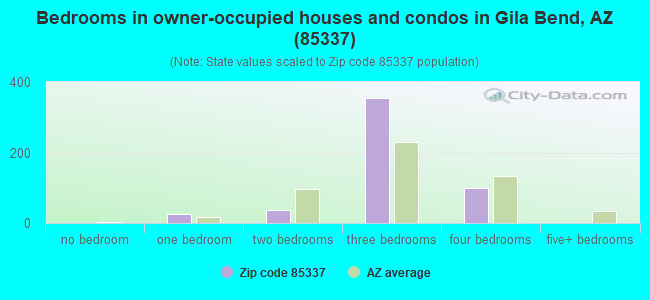
Median number of bedrooms in owner occupied houses
Mean number of bedrooms in owner occupied houses
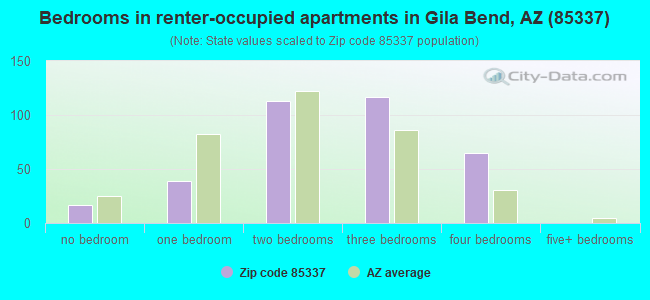
Median number of bedrooms in renter occupied houses
Mean number of bedrooms in renter occupied houses
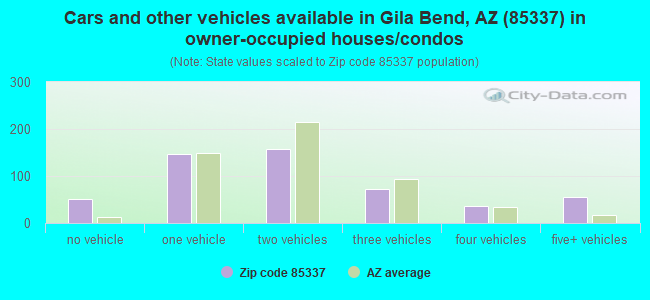
Median number of vehichles in owner occupied houses
Mean number of vehichles in owner occupied houses
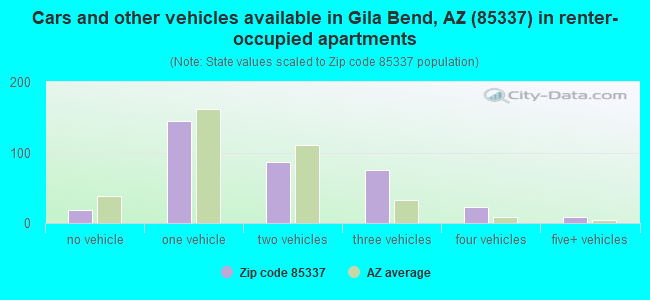
Median number of vehichles in renter occupied houses
Mean number of vehichles in renter occupied houses
Mortgage status - with mortgage (%)
Mortgage status - with second mortgage (%)
Mortgage status - with home equity loan (%)
Mortgage status - with both second mortgage and home equity loan (%)
Mortgage status - without a mortgage (%)
Average family size
Average family size - White
Average family size - Black or African American
Average family size - Asian
Average family size - Hispanic or Latino
Average family size - American Indian and Alaska Native
Average family size - Multirace
Average family size - Other Race
Geographical mobility - Same house 1 year ago (%)
Geographical mobility - Moved within same county (%)
Geographical mobility - Moved from different county within same state (%)
Geographical mobility - Moved from different state (%)
Geographical mobility - Moved from abroad (%)
Place of birth - Born in state of residence (%)
Place of birth - Born in other state (%)
Place of birth - Native, outside of US (%)
Place of birth - Foreign born (%)
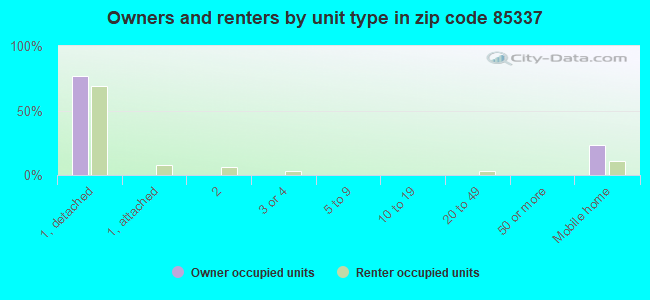
Housing units in structures - 1, detached (%)
Housing units in structures - 1, attached (%)
Housing units in structures - 2 (%)
Housing units in structures - 3 or 4 (%)
Housing units in structures - 5 to 9 (%)
Housing units in structures - 10 to 19 (%)
Housing units in structures - 20 to 49 (%)
Housing units in structures - 50 or more (%)
Housing units in structures - Mobile home (%)
Housing units in structures - Boat, RV, van, etc. (%)
House/condo owner moved in on average (years ago)
Renter moved in on average (years ago)
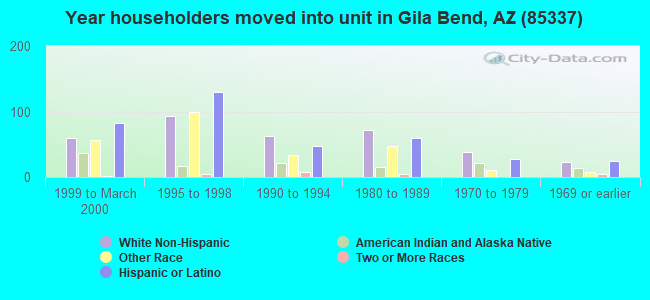
Year householder moved into unit - Moved in 1999 to March 2000 (%)
Year householder moved into unit - Moved in 1995 to 1998 (%)
Year householder moved into unit - Moved in 1990 to 1994 (%)
Year householder moved into unit - Moved in 1980 to 1989 (%)
Year householder moved into unit - Moved in 1970 to 1979 (%)
Year householder moved into unit - Moved in 1969 or earlier (%)
Means of transportation to work - Drove car alone (%)
Means of transportation to work - Carpooled (%)
Means of transportation to work - Public transportation (%)
Means of transportation to work - Bus or trolley bus (%)
Means of transportation to work - Streetcar or trolley car (%)
Means of transportation to work - Subway or elevated (%)
Means of transportation to work - Railroad (%)
Means of transportation to work - Ferryboat (%)
Means of transportation to work - Taxicab (%)
Means of transportation to work - Motorcycle (%)
Means of transportation to work - Bicycle (%)
Means of transportation to work - Walked (%)
Means of transportation to work - Other means (%)
Working at home (%)
Industry diversity
Most Common Industries - Agriculture, forestry, fishing and hunting, and mining (%)
Most Common Industries - Agriculture, forestry, fishing and hunting (%)
Most Common Industries - Mining, quarrying, and oil and gas extraction (%)
Most Common Industries - Construction (%)
Most Common Industries - Manufacturing (%)
Most Common Industries - Wholesale trade (%)
Most Common Industries - Retail trade (%)
Most Common Industries - Transportation and warehousing, and utilities (%)
Most Common Industries - Transportation and warehousing (%)
Most Common Industries - Utilities (%)
Most Common Industries - Information (%)
Most Common Industries - Finance and insurance, and real estate and rental and leasing (%)
Most Common Industries - Finance and insurance (%)
Most Common Industries - Real estate and rental and leasing (%)
Most Common Industries - Professional, scientific, and management, and administrative and waste management services (%)
Most Common Industries - Professional, scientific, and technical services (%)
Most Common Industries - Management of companies and enterprises (%)
Most Common Industries - Administrative and support and waste management services (%)
Most Common Industries - Educational services, and health care and social assistance (%)
Most Common Industries - Educational services (%)
Most Common Industries - Health care and social assistance (%)
Most Common Industries - Arts, entertainment, and recreation, and accommodation and food services (%)
Most Common Industries - Arts, entertainment, and recreation (%)
Most Common Industries - Accommodation and food services (%)
Most Common Industries - Other services, except public administration (%)
Most Common Industries - Public administration (%)
Occupation diversity
Most Common Occupations - Management, business, science, and arts occupations (%)
Most Common Occupations - Management, business, and financial occupations (%)
Most Common Occupations - Management occupations (%)
Most Common Occupations - Business and financial operations occupations (%)
Most Common Occupations - Computer, engineering, and science occupations (%)
Most Common Occupations - Computer and mathematical occupations (%)
Most Common Occupations - Architecture and engineering occupations (%)
Most Common Occupations - Life, physical, and social science occupations (%)
Most Common Occupations - Education, legal, community service, arts, and media occupations (%)
Most Common Occupations - Community and social service occupations (%)
Most Common Occupations - Legal occupations (%)
Most Common Occupations - Education, training, and library occupations (%)
Most Common Occupations - Arts, design, entertainment, sports, and media occupations (%)
Most Common Occupations - Healthcare practitioners and technical occupations (%)
Most Common Occupations - Health diagnosing and treating practitioners and other technical occupations (%)
Most Common Occupations - Health technologists and technicians (%)
Most Common Occupations - Service occupations (%)
Most Common Occupations - Healthcare support occupations (%)
Most Common Occupations - Protective service occupations (%)
Most Common Occupations - Fire fighting and prevention, and other protective service workers including supervisors (%)
Most Common Occupations - Law enforcement workers including supervisors (%)
Most Common Occupations - Food preparation and serving related occupations (%)
Most Common Occupations - Building and grounds cleaning and maintenance occupations (%)
Most Common Occupations - Personal care and service occupations (%)
Most Common Occupations - Sales and office occupations (%)
Most Common Occupations - Sales and related occupations (%)
Most Common Occupations - Office and administrative support occupations (%)
Most Common Occupations - Natural resources, construction, and maintenance occupations (%)
Most Common Occupations - Farming, fishing, and forestry occupations (%)
Most Common Occupations - Construction and extraction occupations (%)
Most Common Occupations - Installation, maintenance, and repair occupations (%)
Most Common Occupations - Production, transportation, and material moving occupations (%)
Most Common Occupations - Production occupations (%)
Most Common Occupations - Transportation occupations (%)
Most Common Occupations - Material moving occupations (%)
People in Group quarters - Institutionalized population (%)
People in Group quarters - Correctional institutions (%)
People in Group quarters - Federal prisons and detention centers (%)
People in Group quarters - Halfway houses (%)
People in Group quarters - Local jails and other confinement facilities (including police lockups) (%)
People in Group quarters - Military disciplinary barracks (%)
People in Group quarters - State prisons (%)
People in Group quarters - Other types of correctional institutions (%)
People in Group quarters - Nursing homes (%)
People in Group quarters - Hospitals/wards, hospices, and schools for the handicapped (%)
People in Group quarters - Hospitals/wards and hospices for chronically ill (%)
People in Group quarters - Hospices or homes for chronically ill (%)
People in Group quarters - Military hospitals or wards for chronically ill (%)
People in Group quarters - Other hospitals or wards for chronically ill (%)
People in Group quarters - Hospitals or wards for drug/alcohol abuse (%)
People in Group quarters - Mental (Psychiatric) hospitals or wards (%)
People in Group quarters - Schools, hospitals, or wards for the mentally retarded (%)
People in Group quarters - Schools, hospitals, or wards for the physically handicapped (%)
People in Group quarters - Institutions for the deaf (%)
People in Group quarters - Institutions for the blind (%)
People in Group quarters - Orthopedic wards and institutions for the physically handicapped (%)
People in Group quarters - Wards in general hospitals for patients who have no usual home elsewhere (%)
People in Group quarters - Wards in military hospitals for patients who have no usual home elsewhere (%)
People in Group quarters - Juvenile institutions (%)
People in Group quarters - Long-term care (%)
People in Group quarters - Homes for abused, dependent, and neglected children (%)
People in Group quarters - Residential treatment centers for emotionally disturbed children (%)
People in Group quarters - Training schools for juvenile delinquents (%)
People in Group quarters - Short-term care, detention or diagnostic centers for delinquent children (%)
People in Group quarters - Type of juvenile institution unknown (%)
People in Group quarters - Noninstitutionalized population (%)
People in Group quarters - College dormitories (includes college quarters off campus) (%)
People in Group quarters - Military quarters (%)
People in Group quarters - On base (%)
People in Group quarters - Barracks, unaccompanied personnel housing (UPH), (Enlisted/Officer), ;and similar group living quarters for military personnel (%)
People in Group quarters - Transient quarters for temporary residents (%)
People in Group quarters - Military ships (%)
People in Group quarters - Group homes (%)
People in Group quarters - Homes or halfway houses for drug/alcohol abuse (%)
People in Group quarters - Homes for the mentally ill (%)
People in Group quarters - Homes for the mentally retarded (%)
People in Group quarters - Homes for the physically handicapped (%)
People in Group quarters - Other group homes (%)
People in Group quarters - Religious group quarters (%)
People in Group quarters - Dormitories (%)
People in Group quarters - Agriculture workers' dormitories on farms (%)
People in Group quarters - Job Corps and vocational training facilities (%)
People in Group quarters - Other workers' dormitories (%)
People in Group quarters - Crews of maritime vessels (%)
People in Group quarters - Other nonhousehold living situations (%)
People in Group quarters - Other noninstitutional group quarters (%)
Residents speaking English at home (%)
Residents speaking English at home - Born in the United States (%)
Residents speaking English at home - Native, born elsewhere (%)
Residents speaking English at home - Foreign born (%)
Residents speaking Spanish at home (%)
Residents speaking Spanish at home - Born in the United States (%)
Residents speaking Spanish at home - Native, born elsewhere (%)
Residents speaking Spanish at home - Foreign born (%)
Residents speaking other language at home (%)
Residents speaking other language at home - Born in the United States (%)
Residents speaking other language at home - Native, born elsewhere (%)
Residents speaking other language at home - Foreign born (%)
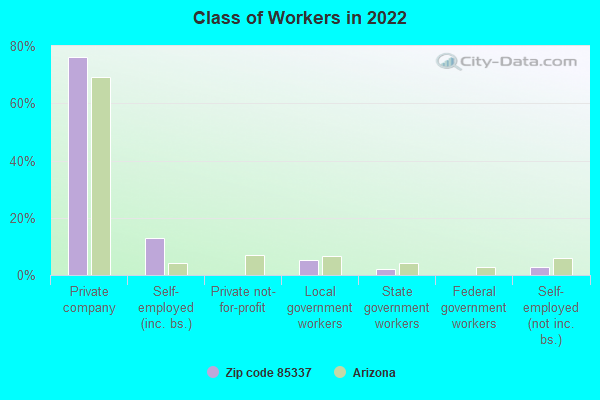
Class of Workers - Employee of private company (%)
Class of Workers - Self-employed in own incorporated business (%)
Class of Workers - Private not-for-profit wage and salary workers (%)
Class of Workers - Local government workers (%)
Class of Workers - State government workers (%)
Class of Workers - Federal government workers (%)
Class of Workers - Self-employed workers in own not incorporated business and Unpaid family workers (%)
House heating fuel used in houses and condos - Utility gas (%)
House heating fuel used in houses and condos - Bottled, tank, or LP gas (%)
House heating fuel used in houses and condos - Electricity (%)
House heating fuel used in houses and condos - Fuel oil, kerosene, etc. (%)
House heating fuel used in houses and condos - Coal or coke (%)
House heating fuel used in houses and condos - Wood (%)
House heating fuel used in houses and condos - Solar energy (%)
House heating fuel used in houses and condos - Other fuel (%)
House heating fuel used in houses and condos - No fuel used (%)
House heating fuel used in apartments - Utility gas (%)
House heating fuel used in apartments - Bottled, tank, or LP gas (%)
House heating fuel used in apartments - Electricity (%)
House heating fuel used in apartments - Fuel oil, kerosene, etc. (%)
House heating fuel used in apartments - Coal or coke (%)
House heating fuel used in apartments - Wood (%)
House heating fuel used in apartments - Solar energy (%)
House heating fuel used in apartments - Other fuel (%)
House heating fuel used in apartments - No fuel used (%)
Armed forces status - In Armed Forces (%)
Armed forces status - Civilian (%)
Armed forces status - Civilian - Veteran (%)
Armed forces status - Civilian - Nonveteran (%)
Fatal accidents locations in years 2005-2021
Fatal accidents locations in 2005
Fatal accidents locations in 2006
Fatal accidents locations in 2007
Fatal accidents locations in 2008
Fatal accidents locations in 2009
Fatal accidents locations in 2010
Fatal accidents locations in 2011
Fatal accidents locations in 2012
Fatal accidents locations in 2013
Fatal accidents locations in 2014
Fatal accidents locations in 2015
Fatal accidents locations in 2016
Fatal accidents locations in 2017
Fatal accidents locations in 2018
Fatal accidents locations in 2019
Fatal accidents locations in 2020
Fatal accidents locations in 2021
Alcohol use - People drinking some alcohol every month (%)
Alcohol use - People not drinking at all (%)
Alcohol use - Average days/month drinking alcohol
Alcohol use - Average drinks/week
Alcohol use - Average days/year people drink much
Audiometry - Average condition of hearing (%)
Audiometry - People that can hear a whisper from across a quiet room (%)
Audiometry - People that can hear normal voice from across a quiet room (%)
Audiometry - Ears ringing, roaring, buzzing (%)
Audiometry - Had a job exposure to loud noise (%)
Audiometry - Had off-work exposure to loud noise (%)
Blood Pressure & Cholesterol - Has high blood pressure (%)
Blood Pressure & Cholesterol - Checking blood pressure at home (%)
Blood Pressure & Cholesterol - Frequently checking blood cholesterol (%)
Blood Pressure & Cholesterol - Has high cholesterol level (%)
Consumer Behavior - Money monthly spent on food at supermarket/grocery store
Consumer Behavior - Money monthly spent on food at other stores
Consumer Behavior - Money monthly spent on eating out
Consumer Behavior - Money monthly spent on carryout/delivered foods
Consumer Behavior - Income spent on food at supermarket/grocery store (%)
Consumer Behavior - Income spent on food at other stores (%)
Consumer Behavior - Income spent on eating out (%)
Consumer Behavior - Income spent on carryout/delivered foods (%)
Current Health Status - General health condition (%)
Current Health Status - Blood donors (%)
Current Health Status - Has blood ever tested for HIV virus (%)
Current Health Status - Left-handed people (%)
Dermatology - People using sunscreen (%)
Diabetes - Diabetics (%)
Diabetes - Had a blood test for high blood sugar (%)
Diabetes - People taking insulin (%)
Diet Behavior & Nutrition - Diet health (%)
Diet Behavior & Nutrition - Milk product consumption (# of products/month)
Diet Behavior & Nutrition - Meals not home prepared (#/week)
Diet Behavior & Nutrition - Meals from fast food or pizza place (#/week)
Diet Behavior & Nutrition - Ready-to-eat foods (#/month)
Diet Behavior & Nutrition - Frozen meals/pizza (#/month)
Drug Use - People that ever used marijuana or hashish (%)
Drug Use - Ever used hard drugs (%)
Drug Use - Ever used any form of cocaine (%)
Drug Use - Ever used heroin (%)
Drug Use - Ever used methamphetamine (%)
Health Insurance - People covered by health insurance (%)
Kidney Conditions-Urology - Avg. # of times urinating at night
Medical Conditions - People with asthma (%)
Medical Conditions - People with anemia (%)
Medical Conditions - People with psoriasis (%)
Medical Conditions - People with overweight (%)
Medical Conditions - Elderly people having difficulties in thinking or remembering (%)
Medical Conditions - People who ever received blood transfusion (%)
Medical Conditions - People having trouble seeing even with glass/contacts (%)
Medical Conditions - People with arthritis (%)
Medical Conditions - People with gout (%)
Medical Conditions - People with congestive heart failure (%)
Medical Conditions - People with coronary heart disease (%)
Medical Conditions - People with angina pectoris (%)
Medical Conditions - People who ever had heart attack (%)
Medical Conditions - People who ever had stroke (%)
Medical Conditions - People with emphysema (%)
Medical Conditions - People with thyroid problem (%)
Medical Conditions - People with chronic bronchitis (%)
Medical Conditions - People with any liver condition (%)
Medical Conditions - People who ever had cancer or malignancy (%)
Mental Health - People who have little interest in doing things (%)
Mental Health - People feeling down, depressed, or hopeless (%)
Mental Health - People who have trouble sleeping or sleeping too much (%)
Mental Health - People feeling tired or having little energy (%)
Mental Health - People with poor appetite or overeating (%)
Mental Health - People feeling bad about themself (%)
Mental Health - People who have trouble concentrating on things (%)
Mental Health - People moving or speaking slowly or too fast (%)
Mental Health - People having thoughts they would be better off dead (%)
Oral Health - Average years since last visit a dentist
Oral Health - People embarrassed because of mouth (%)
Oral Health - People with gum disease (%)
Oral Health - General health of teeth and gums (%)
Oral Health - Average days a week using dental floss/device
Oral Health - Average days a week using mouthwash for dental problem
Oral Health - Average number of teeth
Pesticide Use - Households using pesticides to control insects (%)
Pesticide Use - Households using pesticides to kill weeds (%)
Physical Activity - People doing vigorous-intensity work activities (%)
Physical Activity - People doing moderate-intensity work activities (%)
Physical Activity - People walking or bicycling (%)
Physical Activity - People doing vigorous-intensity recreational activities (%)
Physical Activity - People doing moderate-intensity recreational activities (%)
Physical Activity - Average hours a day doing sedentary activities
Physical Activity - Average hours a day watching TV or videos
Physical Activity - Average hours a day using computer
Physical Functioning - People having limitations keeping them from working (%)
Physical Functioning - People limited in amount of work they can do (%)
Physical Functioning - People that need special equipment to walk (%)
Physical Functioning - People experiencing confusion/memory problems (%)
Physical Functioning - People requiring special healthcare equipment (%)
Prescription Medications - Average number of prescription medicines taking
Preventive Aspirin Use - Adults 40+ taking low-dose aspirin (%)
Reproductive Health - Vaginal deliveries (%)
Reproductive Health - Cesarean deliveries (%)
Reproductive Health - Deliveries resulted in a live birth (%)
Reproductive Health - Pregnancies resulted in a delivery (%)
Reproductive Health - Women breastfeeding newborns (%)
Reproductive Health - Women that had a hysterectomy (%)
Reproductive Health - Women that had both ovaries removed (%)
Reproductive Health - Women that have ever taken birth control pills (%)
Reproductive Health - Women taking birth control pills (%)
Reproductive Health - Women that have ever used Depo-Provera or injectables (%)
Reproductive Health - Women that have ever used female hormones (%)
Sexual Behavior - People 18+ that ever had sex (vaginal, anal, or oral) (%)
Sexual Behavior - Males 18+ that ever had vaginal sex with a woman (%)
Sexual Behavior - Males 18+ that ever performed oral sex on a woman (%)
Sexual Behavior - Males 18+ that ever had anal sex with a woman (%)
Sexual Behavior - Males 18+ that ever had any sex with a man (%)
Sexual Behavior - Females 18+ that ever had vaginal sex with a man (%)
Sexual Behavior - Females 18+ that ever performed oral sex on a man (%)
Sexual Behavior - Females 18+ that ever had anal sex with a man (%)
Sexual Behavior - Females 18+ that ever had any kind of sex with a woman (%)
Sexual Behavior - Average age people first had sex
Sexual Behavior - Average number of female sex partners in lifetime (males 18+)
Sexual Behavior - Average number of female vaginal sex partners in lifetime (males 18+)
Sexual Behavior - Average age people first performed oral sex on a woman (18+)
Sexual Behavior - Average number of woman performed oral sex on in lifetime (18+)
Sexual Behavior - Average number of male sex partners in lifetime (males 18+)
Sexual Behavior - Average number of male anal sex partners in lifetime (males 18+)
Sexual Behavior - Average age people first performed oral sex on a man (18+)
Sexual Behavior - Average number of male oral sex partners in lifetime (18+)
Sexual Behavior - People using protection when performing oral sex (%)
Sexual Behavior - Average number of times people have vaginal or anal sex a year
Sexual Behavior - People having sex without condom (%)
Sexual Behavior - Average number of male sex partners in lifetime (females 18+)
Sexual Behavior - Average number of male vaginal sex partners in lifetime (females 18+)
Sexual Behavior - Average number of female sex partners in lifetime (females 18+)
Sexual Behavior - Circumcised males 18+ (%)
Sleep Disorders - Average hours sleeping at night
Sleep Disorders - People that has trouble sleeping (%)
Smoking-Cigarette Use - People smoking cigarettes (%)
Taste & Smell - People 40+ having problems with smell (%)
Taste & Smell - People 40+ having problems with taste (%)
Taste & Smell - People 40+ that ever had wisdom teeth removed (%)
Taste & Smell - People 40+ that ever had tonsils teeth removed (%)
Taste & Smell - People 40+ that ever had a loss of consciousness because of a head injury (%)
Taste & Smell - People 40+ that ever had a broken nose or other serious injury to face or skull (%)
Taste & Smell - People 40+ that ever had two or more sinus infections (%)
Weight - Average height (inches)
Weight - Average weight (pounds)
Weight - Average BMI
Weight - People that are obese (%)
Weight - People that ever were obese (%)
Weight - People trying to lose weight (%)
100%
rural population.
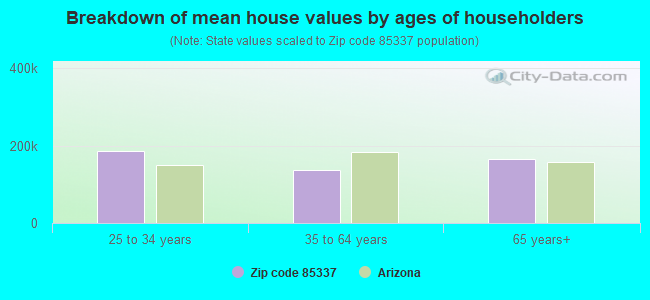
Estimated median house/condo value in 2022: $147,134
85337:
$147,134Arizona:
$402,800
According to our research of Arizona and other state lists, there were 4 registered sex offenders living in 85337 zip code as of April 23, 2024 . The ratio of all residents to sex offenders in zip code 85337 is 708 to 1.The ratio of registered sex offenders to all residents in this zip code is near the state average.
Median resident age: This zip code:
35.6 yearsArizona median age:
38.8 years
Average household size: This zip code:
2.7 peopleArizona:
2.5 people
Averages for the 2020 tax year for zip code 85337, filed in 2021:
Average Adjusted Gross Income (AGI) in 2020: $39,639 (Individual Income Tax Returns) Here:
$39,639State:
$73,499
Salary/wage: $37,254 (reported on 89.4% of returns )Here:
$37,254State:
$59,499
(% of AGI for various income ranges: 1497.6% for AGIs below $25k , 4247.2% for AGIs $25k-50k , 8489.0% for AGIs $50k-75k , 7624.3% for AGIs $75k-100k ) Taxable interest for individuals: $356 (reported on 8.7% of returns )This zip code:
$356Arizona:
$2,325
(% of AGI for various income ranges: 1.4% for AGIs below $25k , 1.0% for AGIs $25k-50k , 8.0% for AGIs $50k-75k , 24.3% for AGIs $75k-100k ) Ordinary dividends: $950 (reported on 1.9% of returns )(% of AGI for various income ranges: 6.6% for AGIs below $25k ) Net capital gain/loss in AGI: +$8,200 (reported on 1.9% of returns )Here:
+$8,200State:
+$31,332
(% of AGI for various income ranges: 56.6% for AGIs below $25k ) Profit/loss from business: +$5,873 (reported on 10.6% of returns )Here:
+$5,873State:
+$13,214
(% of AGI for various income ranges: 34.5% for AGIs below $25k , 656.0% for AGIs $50k-75k ) Earned income credit: $2,837 (reported on 36.5% of returns )(% of AGI for various income ranges: 223.4% for AGIs below $25k , 148.3% for AGIs $25k-50k ) Percentage of individuals using paid preparers for their 2020 taxes: 91.3%(% for various income ranges: 92.3% for AGIs below $25k , 91.9% for AGIs $25k-50k , 87.5% for AGIs $50k-75k , 100.0% for AGIs $75k-100k , 80.0% for AGIs $100k-200k )
Averages for the 2012 tax year for zip code 85337, filed in 2013:
Average Adjusted Gross Income (AGI) in 2012: $33,505 (Individual Income Tax Returns) Here:
$33,505State:
$57,644
Salary/wage: $30,320 (reported on 92.2% of returns )Here:
$30,320State:
$47,932
(% of AGI for various income ranges: 88.3% for AGIs below $25k , 91.9% for AGIs $25k-50k , 87.9% for AGIs $50k-75k , 85.3% for AGIs $75k-100k , 48.8% for AGIs $100k-200k ) Taxable interest for individuals: $1,100 (reported on 10.8% of returns )This zip code:
$1,100Arizona:
$2,064
(% of AGI for various income ranges: 0.2% for AGIs $25k-50k , 2.5% for AGIs $75k-100k ) Ordinary dividends: $1,167 (reported on 2.9% of returns )Profit/loss from business: +$9,450 (reported on 7.8% of returns )Here:
+$9,450State:
+$12,323
Total itemized deductions: $19,600 (22% of AGI, reported on 7.8% of returns )Here:
$19,600State:
$23,651
Here:
21.9% of AGIState:
20.6% of AGI
(% of AGI for various income ranges: 2.6% for AGIs $25k-50k , 11.9% for AGIs $50k-75k , 9.9% for AGIs $100k-200k ) Charity contributions: $3,386 (reported on 6.9% of returns )(% of AGI for various income ranges: 0.7% for AGIs $50k-75k , 5.0% for AGIs $75k-100k ) Taxes paid: $4,775 (reported on 7.8% of returns )(% of AGI for various income ranges: 0.4% for AGIs $25k-50k , 2.7% for AGIs $50k-75k , 3.1% for AGIs $100k-200k ) Earned income credit: $2,660 (reported on 41.2% of returns )(% of AGI for various income ranges: 11.6% for AGIs below $25k , 2.8% for AGIs $25k-50k ) Percentage of individuals using paid preparers for their 2012 taxes: 63.7%(% for various income ranges: 55.1% for AGIs below $25k , 72.2% for AGIs $25k-50k , 70.0% for AGIs $50k-75k , 75.0% for AGIs $75k-100k , 66.7% for AGIs $100k-200k )
Averages for the 2004 tax year for zip code 85337, filed in 2005:
Average Adjusted Gross Income (AGI) in 2004: $28,300 (Individual Income Tax Returns) Here:
$28,300State:
$50,097
Salary/wage: $25,479 (reported on 92.9% of returns )Here:
$25,479State:
$42,146
(% of AGI for various income ranges: 134.7% for AGIs below $10k , 92.1% for AGIs $10k-25k , 93.0% for AGIs $25k-50k , 77.4% for AGIs $50k-75k , 75.3% for AGIs $75k-100k , 34.7% for AGIs over 100k ) Taxable interest for individuals: $1,213 (reported on 16.9% of returns )This zip code:
$1,213Arizona:
$2,374
(% of AGI for various income ranges: 1.9% for AGIs below $10k , 0.4% for AGIs $10k-25k , 0.1% for AGIs $25k-50k , 0.9% for AGIs $50k-75k , 0.4% for AGIs $75k-100k , 3.7% for AGIs over 100k ) Taxable dividends: $1,447 (reported on 5.3% of returns )(% of AGI for various income ranges: 0.1% for AGIs $10k-25k , 0.0% for AGIs $50k-75k , 2.0% for AGIs $75k-100k ) Net capital gain/loss: +$6,158 (reported on 4.3% of returns )Here:
+$6,158State:
+$17,569
Profit/loss from business: +$5,786 (reported on 4.7% of returns )Here:
+$5,786State:
+$11,088
Total itemized deductions: $15,121 (24% of AGI, reported on 11.2% of returns )Here:
$15,121State:
$19,781
Here:
23.6% of AGIState:
21.8% of AGI
(% of AGI for various income ranges: 20.3% for AGIs below $10k , 4.1% for AGIs $25k-50k , 10.7% for AGIs $50k-75k , 10.4% for AGIs $75k-100k , 10.7% for AGIs over 100k ) Charity contributions deductions: $1,519 (2% of AGI, reported on 8.7% of returns )Here:
2.3% of AGIState:
3.5% of AGI
Total tax: $3,458 (reported on 52.0% of returns )(% of AGI for various income ranges: 1.0% for AGIs below $10k , 2.0% for AGIs $10k-25k , 4.7% for AGIs $25k-50k , 7.8% for AGIs $50k-75k , 12.0% for AGIs $75k-100k , 15.6% for AGIs over 100k ) Earned income credit: $1,969 (reported on 32.4% of returns )Percentage of individuals using paid preparers for their 2004 taxes: 74.5%(% for various income ranges: 69.4% for AGIs below $10k , 79.1% for AGIs $10k-25k , 71.1% for AGIs $25k-50k , 71.4% for AGIs $50k-75k , 75.0% for AGIs $75k-100k , 93.3% for AGIs over 100k )
Estimated median household income in 2022: This zip code:
$48,654Arizona:
$74,568
Nearest zip codes: 85322 ,
85326 ,
85343 ,
85338 ,
85139 ,
85396 .
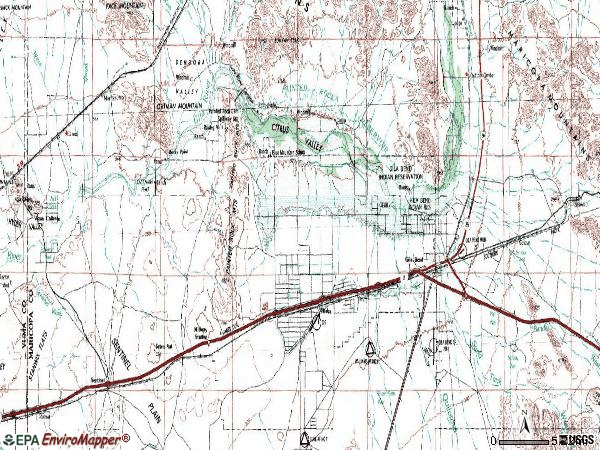
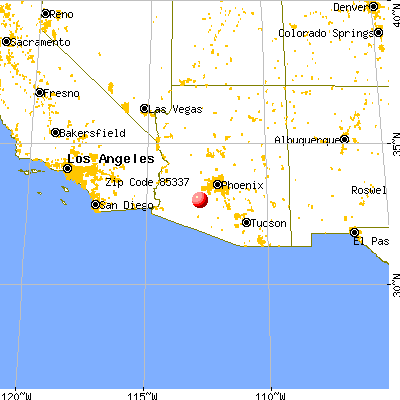
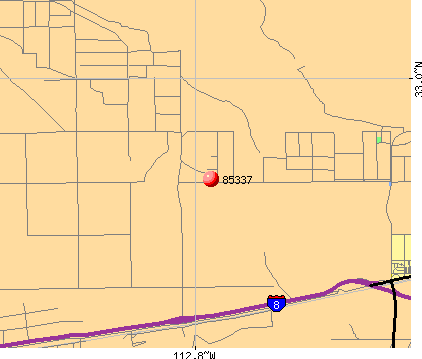
Gila Bend Zip Code Map
Percentage of family households: This zip code:
44.9%Arizona:
43.6%
Percentage of households with unmarried partners: This zip code:
9.1%Arizona:
46.7%
No gay or lesbian households reported
Household received Food Stamps/SNAP in the past 12 months: 190Household did not receive Food Stamps/SNAP in the past 12 months: 683
Women who had a birth in the past 12 months: 22 (0 now married , 20 unmarried) Women who did not have a birth in the past 12 months: 497 (234 now married , 260 unmarried)
Housing units in zip code 85337 with a mortgage: 180 (16
second mortgage , 17
both second mortgage and home equity loan )
Median monthly owner costs for units with a mortgage: $1,033
Median monthly owner costs for units without a mortgage: $410
Residents with income below the poverty level in 2022:
This zip code:
33.5%Whole state:
12.5%
Residents with income below 50% of the poverty level in 2022:
This zip code:
16.9%Whole state:
6.0%
Median number of rooms in houses and condos: Median number of rooms in apartments: Notable locations in this zip code not listed on our city pages
Click to draw/clear zip code borders Notable locations in zip code 85337: (A) , A K Ranch (B) , Gila River Ranch (C) , Dendora Substation (D) , Gila Bend Substation (E) , Arizona Highway Maintenance Gila Bend Yard (F) , Theba Substation (G) , Dendora Ranch (H) , Fortaleza Indian Ruins (I) , Maricopa County Library District Gila Bend Branch (J) , Theba Railroad Station (K) , Gila Bend Town Hall (L) , Gila Bend Railroad Station (M) . Display/hide their locations on the map
Churches in zip code 85337 include: (A) , Faith Assembly of God (B) , The Church of Jesus Christ of Latter Day Saints (C) . Display/hide their locations on the map
Cemeteries: (1) , Hee - A - Hand Park (2) , Pioneer Cemetery (3) . Display/hide their locations on the map
Reservoirs: (A) , Lost Horse Tank (B) , Painted Rock Reservoir (C) . Display/hide their locations on the map
Streams, rivers, and creeks: (A) , Fourth of July Wash (B) , Quail Wash (C) , Loudermilk Wash (D) , Quilotosa Wash (E) , Bender Wash (F) , Sauceda Wash (G) , Woolsey Wash (H) , Yellow Medicine Wash (I) . Display/hide their locations on the map
Park in zip code 85337: (1) . Display/hide its location on the map
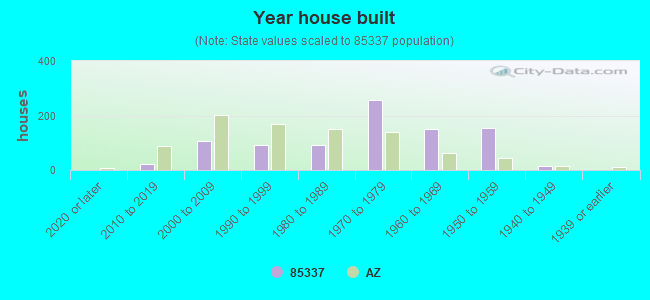
Year house built (houses)
0 2020 or later22 2010 to 2019108 2000 to 200993 1990 to 199990 1980 to 1989256 1970 to 1979151 1960 to 1969153 1950 to 195914 1940 to 19490 1939 or earlier
Zip code 85337 household income distribution in 2022 92 Less than $10,00025 $10,000 to $14,99967 $15,000 to $19,99914 $20,000 to $24,99956 $25,000 to $29,99956 $30,000 to $34,99917 $35,000 to $39,99954 $40,000 to $44,99945 $45,000 to $49,99980 $50,000 to $59,99974 $60,000 to $74,99980 $75,000 to $99,99952 $100,000 to $124,999108 $125,000 to $149,99918 $150,000 to $199,99919 $200,000 or moreEstimate of home value of owner-occupied houses/condos in 2022 in zip code 85337 34 Less than $10,00013 $10,000 to $14,99932 $20,000 to $24,99913 $30,000 to $34,99915 $70,000 to $79,9993 $80,000 to $89,9997 $90,000 to $99,999120 $100,000 to $124,99944 $125,000 to $149,99940 $150,000 to $174,9993 $250,000 to $299,99946 $500,000 to $749,999Rent paid by renters in 2022 in zip code 85337 41 $200 to $24914 $300 to $34925 $350 to $39914 $400 to $44913 $450 to $4999 $550 to $5999 $600 to $64912 $700 to $74930 $750 to $79947 $800 to $89929 $2,000 to $2,49969 No cash rent
Median gross rent in 2022: $1,013.
Estimated median house (or condo) value in 2022 for: White Non-Hispanic householders: $222,878Black or African American householders: $318,398American Indian or Alaska Native householders: $46,586Some other race householders: $163,556Two or more races householders: $58,652Hispanic or Latino householders: $165,231Estimated median house or condo value in 2022: $147,134
85337:
$147,134Arizona:
$402,800
Lower value quartile - upper value quartile: $116,808 - $182,117
Mean price in 2022: Detached houses: $179,577Here:
$179,577State:
$521,408
Mobile homes: $76,278Here:
$76,278State:
$141,516
Housing units in structures:
One, detached: 670One, attached: 28Two: 233 or 4: 1310 to 19: 520 to 49: 11Mobile homes: 161Unemployment : 1.6%
Means of transportation to work in zip code 85337 77.0% 893 Drove a car alone6.8% 79 Carpooled8.5% 99 Walked2.2% 25 Other means0.7% 8 Worked at homeTravel time to work (commute) in zip code 85337 131 Less than 5 minutes320 5 to 9 minutes176 10 to 14 minutes228 15 to 19 minutes49 20 to 24 minutes2 25 to 29 minutes125 30 to 34 minutes18 40 to 44 minutes16 45 to 59 minutes17 60 to 89 minutes
Percentage of zip code residents living and working in this county: 98.6%
Household type by relationship:
Households: 2,465
Male householders: 579 (178 living alone ), Female householders: 290 (83 living alone )404 spouses (385 opposite-sex spouses ), 70 unmarried partners , (70 opposite-sex unmarried partners ), 689 children (606 natural , 52 adopted , 32 stepchildren ), 84 grandchildren , 78 brothers or sisters , 12 parents , 0 foster children , 43 other relatives , 138 non-relatives In group quarters: 72 (-1 institutionalized population )
Size of family households: 152 2-persons , 190 3-persons , 109 4-persons , 46 5-persons , 21 6-persons , 22 7-or-more-persons
Size of nonfamily households: 262 1-person , 1 2-persons , 66 3-persons
376 married couples with children. single-parent households (59 men , 113 women ).
38.0% of residents of 85337 zip code speak English at home. of residents speak Spanish at home (44% very well, 16% well, 33% not well, 7% not at all ).of residents speak other language at home (100% very well ).
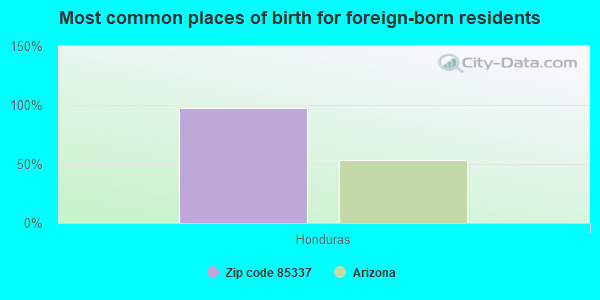
Foreign born population: 629 (25.5%)
(31.4%
of them are naturalized citizens )
This zip code:
25.5%Whole state:
13.1%
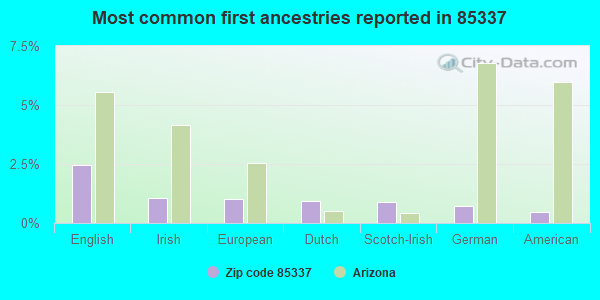
2% English 1% Irish 1% European 1% Dutch 1% Scotch-Irish 1% German 0% American
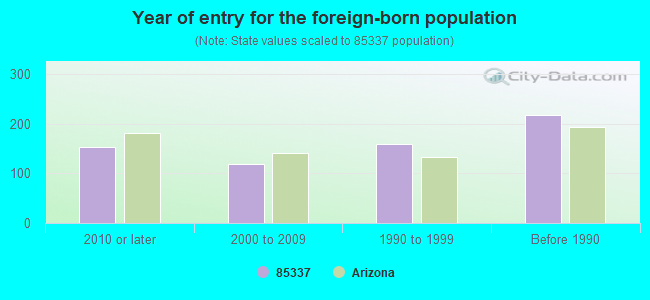
Year of entry for the foreign-born population
153 2010 or later 120 2000 to 2009 160 1990 to 1999 218 Before 1990
Facilities with environmental interests located in this zip code:
GILA BEND, TOWN OF - WWTP (644 WEST PIMA STREET in GILA BEND, AZ)
STATE MASTER (Arizona's Tracking Of The Environment) - AZURITE-964, WASTE WATER PROGRAM, WASTE (Integrated Compliance Information System) - ICIS-09-2000-0023, FORMAL ENFORCEMENT ACTION (Integrated Compliance Information System) - ICIS-09-2001-0113, FORMAL ENFORCEMENT ACTION National Pollutant Discharge Elimination System NON-MAJOR (Tracking pollutant discharge elimination systems) - permit Business SIC classification: SEWERAGE SYSTEMSAlternative names: GILA BEND WASTE WATER TREATMENT PLANT, GILA BEND WWTP, TOWN OF GILA BEND, WATERMELON RD WWTP
PANDA GILA RIVER PROJECT (1250 EAST WATERMELLON ROAD in GILA BEND, AZ)
AIR MAJOR (AIRS/AFS) STATE MASTER (Arizona's Tracking Of The Environment) - AZURITE-9119, WASTE, GROUND WATER PROGRAM AIR PROGRAM (Clean Air Markets Division Business System) AIR MAJOR ("Best Available" air pollution technologies tracking) Business SIC classification: ELECTRIC SERVICESOrganizations: PANDA GILA RIVER LP (CONTACT/GENERAL)
, PANDA GILA RIVER, LP (CONTACT/OPERATOR)
, TSP ARIZONA OPERATIONS COMPANY (CONTACT/OPERATOR)
Alternative names: GILA RIVER POWER STATION, PANDA GILA RIVER LP
GILA BEND POWER PROJECT (CITRUS VALLEY RD in GILA BEND, AZ)
STATE MASTER (Arizona's Tracking Of The Environment) - AZURITE-13437, GROUND WATER PROGRAM, DRINKING WATER PROGRAM AIR PROGRAM (Clean Air Markets Division Business System) Organizations: GILA BEND POWER PARTNERS LLC (CONTACT/GENERAL)
, GILA BEND POWER PARTNERS, LLC (OWNER/OPERATOR)
Alternative names: GILA BEND POWER GENERATION STA
GILA BEND HIGH SCHOOL (308 N MARTIN AVE in GILA BEND, AZ)
(Geographic Names Information System) (National Center for Education Statistics) - STATE ID-002 Organizations: GILA BEND UNIFIED DISTRICT (SCHOOL DISTRICT)
GILA BEND ELEMENTARY (308 N MARTIN AVE in GILA BEND, AZ)
(National Center for Education Statistics) - STATE ID-001 Organizations: GILA BEND UNIFIED DISTRICT (SCHOOL DISTRICT)
PAINTED ROCK DAIRY (57707 S. PAINTED ROCK RD. in GILA BEND, AZ)
ENFORCEMENT/COMPLIANCE ACTIVITY (Integrated Compliance Information System) National Pollutant Discharge Elimination System NON-MAJOR (Tracking pollutant discharge elimination systems) - permit
AGMET METALS OF AZ LLC (1100 BUTTERFIELD TRAIL in GILA BEND, AZ)
Conditionally Exempt Small Quantity Generators, less than 100 kg/month of hazardous waste (Resource Conservation and Recovery Act (tracking hazardous waste)) TSD (Resource Conservation and Recovery Act (tracking hazardous waste)) Business NAICS classification: ALL OTHER INFORMATION SERVICES.
GILA BEND UNIFIED SCHOOL DISTRICT #24 (308 N MARTIN ST in GILA BEND, AZ)
COMPLIANCE ACTIVITY (Tracking inspections of insecticide, fungicide, and rodenticide, and toxic substances) Alternative names: GILA BEND USD #24
PALOMA SCHOOL DISTRICT #94 (INTERSTATE 8 & PALOMA RD in GILA BEND, AZ)
COMPLIANCE ACTIVITY (Tracking inspections of insecticide, fungicide, and rodenticide, and toxic substances)
ALL AMERICAN PIPELINE LP GILA STATION (2 MILES WEST OF HWY 85, T2S R4W in GILA BEND, AZ)
CRITERIA AND HAZARDOUS AIR POLLUTANT INVENTORY (Inventory of air pollution sources) Business SIC classification: CRUDE PETROLEUM PIPELINESBusiness NAICS classification: PIPELINE TRANSPORTATION OF CRUDE OIL.Alternative names: ALL AMERICAN PIPELINE COMPANY
GILA BEND MSW LANDFILL (W SIDE OF OLD U.S. HIGHWAY 80 in GILA BEND, AZ)
CRITERIA AND HAZARDOUS AIR POLLUTANT INVENTORY (Inventory of air pollution sources) Business SIC classification: REFUSE SYSTEMSBusiness NAICS classification: SOLID WASTE LANDFILL.Alternative names: GILA BEND REGIONAL LANDFILL
GILA RIVER PRODUCTS COURTAULDS PERF FILM (MARICOPA COUNTY in GILA BEND, AZ)
CRITERIA AND HAZARDOUS AIR POLLUTANT INVENTORY (Inventory of air pollution sources) Business SIC classification: PLASTICS PRODUCTS
PALOMA GIN PROPERTIES LLC (I-8 in GILA BEND, AZ)
CRITERIA AND HAZARDOUS AIR POLLUTANT INVENTORY (Inventory of air pollution sources)
Housing units lacking complete plumbing facilities: 5.1%
Housing units lacking complete kitchen facilities: 3.7%
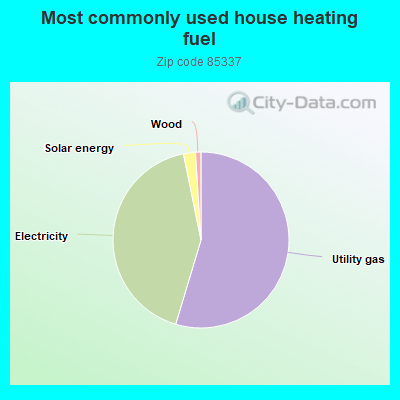
54.7% Utility gas 42.2% Electricity 2.2% Solar energy 1.0% Wood
Population in 1990: 2,898.
Place of birth for U.S.-born residents:
This state: 1,374Northeast: 116Midwest: 92South: 102West: 115
64% of the 85337 zip code residents lived in the same house 5 years ago.
Out of people who lived in different houses, 67% lived in this county.
Out of people who lived in different counties, 50% lived in Arizona.
97% of the 85337 zip code residents lived in the same house 1 year ago.
Out of people who lived in different houses, 86% moved from this county.
Out of people who lived in different houses, 34% moved from different county within same state.
Private vs. public school enrollment:
Students in private schools in grades 1 to 8 (elementary and middle school):
Students in private schools in grades 9 to 12 (high school):
Students in private undergraduate colleges: 11
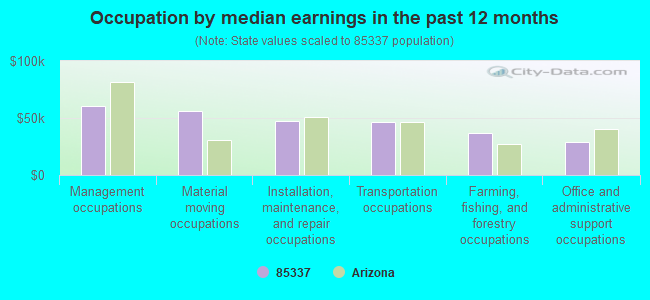
Occupation by median earnings in the past 12 months ($)
60,527 Management occupations 55,873 Material moving occupations 47,605 Installation, maintenance, and repair occupations 46,499 Transportation occupations 37,274 Farming, fishing, and forestry occupations 29,073 Office and administrative support occupations
Companies with federal contracts located in this zip code (GILA BEND, AZ):
AL STOVALL & OK MILLS (401 E PIMA ST; small business) in 7 contracts from 2004 to 2006
Contracts for Lodging - Hotel/Motel, Food Items For Resale, Miscellaneous Items by Army, National Park ServiceSigned by year: 2000: $0; 2001: $0; 2002: $0; 2003: $0; 2004: $39,543; 2005: $12,045; 2006: $45,120.
Biggest contracts: with Army for Lodging - Hotel/Motel. Signed on 2006-06-19. Completion date: 2006-07-18.
with Army for Lodging - Hotel/Motel. Taking place in CA. Signed on 2004-03-17. Completion date: 2004-04-19.
with Army for Food Items For Resale. Signed on 2004-01-16. Completion date: 2004-01-27.
with Army for Miscellaneous Items. Signed on 2005-03-28. Completion date: 2005-04-28.
M & M PORTABLE TOILET (509 W NORMA ST; small business)
$29,888 with Air Force for Lease or Rental of Equipment -- Miscellaneous. Signed on 2004-03-17. Completion date: 2004-04-30.
JALLL CO LLC, THE (2888 BUTTERFIELD TRAIL; small business) in 3 contracts in 2005
$12,920 with Army for Lodging - Hotel/Motel. Signed on 2005-06-23. Completion date: 2005-07-18.
, same as above. Signed on 2005-08-22. Completion date: 2005-07-18.
, same as above. Signed on 2005-08-15. Completion date: 2005-07-18.
SELLERS & SONS, INC (219 W PIMA; small business) employees , $4480553 revenue . : $2,000 in 2 contracts in 1999
$1,000 with Employment and Training Administration for Maintenance, Repair or Alteration of Real Property -- Other Administrative Facilities and Service Buildings. Signed on 1999-11-15. Completion date: 1999-11-15.
, same as above. Signed on 1999-11-15. Completion date: 1999-11-15.
Top industries in this zip code by the number of employees in 2005:
Accommodation and Food Services: Limited-Service Restaurants (20-49 employees: 2 establishments, 10-19 employees: 1 establishment, 1-4 employees: 1 establishment)Administrative and Support and Waste Management and Remediation Services: Facilities Support Services (50-99: 1)Accommodation and Food Services: Hotels (except Casino Hotels) and Motels (20-49: 1, 10-19: 1)Administrative and Support and Waste Management and Remediation Services: All Other Support Services (10-19: 2, 5-9: 1)Accommodation and Food Services: Full-Service Restaurants (20-49: 1)Construction: Residential Remodelers (20-49: 1)
Fatal accident statistics in 2014:
Fatal accident count: 2Vehicles involved in fatal accidents: 3Fatal accidents caused by drunken drivers: 0Fatalities: 3Persons involved in fatal accidents: 4Pedestrians involved in fatal accidents: 0
Fatal accident statistics in 2012:
Fatal accident count: 1Vehicles involved in fatal accidents: 1Fatal accidents caused by drunken drivers: 1Fatalities: 1Persons involved in fatal accidents: 1Pedestrians involved in fatal accidents: 0
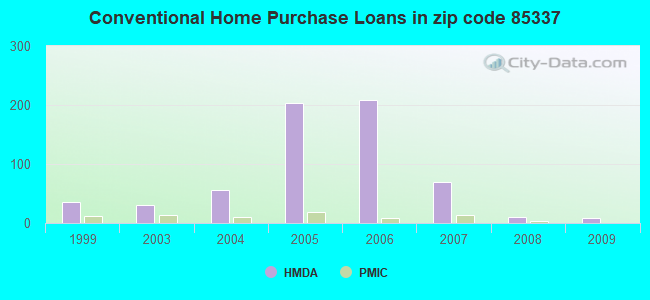
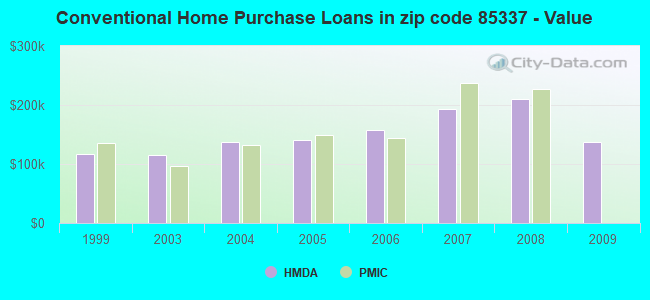
Home Mortgage Disclosure Act Aggregated Statistics For Year 2009(Based on 2 partial tracts) A) FHA, FSA/RHS & VA B) Conventional C) Refinancings D) Home Improvement Loans F) Non-occupant Loans on G) Loans On Manufactured Number Average Value Number Average Value Number Average Value Number Average Value Number Average Value Number Average Value
LOANS ORIGINATED 19 $136,974 8 $136,464 23 $160,056 2 $19,600 4 $132,815 8 $121,086 APPLICATIONS APPROVED, NOT ACCEPTED 1 $147,200 1 $65,890 5 $165,966 0 $0 0 $0 3 $124,407 APPLICATIONS DENIED 21 $123,114 3 $105,917 25 $150,620 3 $68,807 1 $81,320 8 $84,860 APPLICATIONS WITHDRAWN 4 $136,985 2 $67,345 6 $147,478 1 $95,080 1 $51,290 3 $88,403 FILES CLOSED FOR INCOMPLETENESS 0 $0 0 $0 2 $203,915 0 $0 0 $0 0 $0
Aggregated Statistics For Year 2008(Based on 2 partial tracts) A) FHA, FSA/RHS & VA B) Conventional C) Refinancings D) Home Improvement Loans F) Non-occupant Loans on G) Loans On Manufactured Number Average Value Number Average Value Number Average Value Number Average Value Number Average Value Number Average Value
LOANS ORIGINATED 37 $166,518 11 $210,699 31 $163,921 2 $81,105 4 $153,248 18 $137,818 APPLICATIONS APPROVED, NOT ACCEPTED 0 $0 3 $123,987 7 $183,837 2 $91,115 1 $162,630 4 $121,035 APPLICATIONS DENIED 19 $167,546 11 $235,302 62 $203,651 11 $65,165 3 $202,523 19 $114,785 APPLICATIONS WITHDRAWN 5 $187,150 2 $144,490 14 $183,599 3 $110,923 1 $170,970 3 $111,757 FILES CLOSED FOR INCOMPLETENESS 1 $134,690 2 $131,145 6 $148,522 1 $112,590 2 $123,015 3 $130,520
Aggregated Statistics For Year 2007(Based on 2 partial tracts) A) FHA, FSA/RHS & VA B) Conventional C) Refinancings D) Home Improvement Loans F) Non-occupant Loans on G) Loans On Manufactured Number Average Value Number Average Value Number Average Value Number Average Value Number Average Value Number Average Value
LOANS ORIGINATED 9 $158,136 69 $193,748 70 $193,053 14 $79,021 18 $182,993 32 $148,673 APPLICATIONS APPROVED, NOT ACCEPTED 0 $0 29 $170,539 23 $249,674 5 $37,864 3 $210,167 6 $133,578 APPLICATIONS DENIED 5 $189,986 41 $171,041 76 $204,566 25 $80,198 15 $169,330 33 $140,339 APPLICATIONS WITHDRAWN 1 $223,100 25 $147,368 25 $212,637 4 $96,952 6 $114,050 5 $112,424 FILES CLOSED FOR INCOMPLETENESS 1 $179,730 4 $160,962 10 $211,002 1 $182,230 1 $269,800 2 $159,085
Aggregated Statistics For Year 2006(Based on 2 partial tracts) A) FHA, FSA/RHS & VA B) Conventional C) Refinancings D) Home Improvement Loans F) Non-occupant Loans on G) Loans On Manufactured Number Average Value Number Average Value Number Average Value Number Average Value Number Average Value Number Average Value
LOANS ORIGINATED 14 $214,546 209 $157,021 100 $181,612 17 $95,763 49 $146,665 42 $132,626 APPLICATIONS APPROVED, NOT ACCEPTED 2 $229,140 71 $148,264 24 $173,368 6 $72,837 11 $132,037 7 $129,569 APPLICATIONS DENIED 4 $184,418 94 $161,863 97 $167,694 21 $77,661 18 $184,476 33 $123,382 APPLICATIONS WITHDRAWN 5 $198,742 85 $173,452 47 $169,124 3 $126,350 13 $138,765 7 $127,840 FILES CLOSED FOR INCOMPLETENESS 0 $0 11 $139,126 15 $168,523 0 $0 1 $148,040 4 $143,970
Aggregated Statistics For Year 2005(Based on 2 partial tracts) A) FHA, FSA/RHS & VA B) Conventional C) Refinancings D) Home Improvement Loans F) Non-occupant Loans on G) Loans On Manufactured Number Average Value Number Average Value Number Average Value Number Average Value Number Average Value Number Average Value
LOANS ORIGINATED 21 $165,430 203 $140,743 83 $154,476 7 $54,924 49 $134,334 50 $123,374 APPLICATIONS APPROVED, NOT ACCEPTED 1 $119,680 33 $128,866 13 $139,631 2 $79,230 10 $143,823 8 $123,171 APPLICATIONS DENIED 4 $124,370 43 $127,941 75 $123,766 14 $69,877 8 $155,436 32 $107,325 APPLICATIONS WITHDRAWN 2 $114,885 30 $168,718 43 $130,793 5 $123,182 6 $120,373 14 $120,066 FILES CLOSED FOR INCOMPLETENESS 1 $100,500 5 $129,770 24 $132,258 0 $0 0 $0 9 $118,613
Aggregated Statistics For Year 2004(Based on 2 partial tracts) A) FHA, FSA/RHS & VA B) Conventional C) Refinancings D) Home Improvement Loans F) Non-occupant Loans on G) Loans On Manufactured Number Average Value Number Average Value Number Average Value Number Average Value Number Average Value Number Average Value
LOANS ORIGINATED 19 $128,722 56 $136,999 46 $104,187 6 $78,327 12 $126,977 40 $104,511 APPLICATIONS APPROVED, NOT ACCEPTED 2 $98,620 16 $122,963 20 $130,396 3 $64,357 5 $117,094 12 $97,369 APPLICATIONS DENIED 5 $109,088 18 $125,471 61 $112,570 13 $47,121 4 $91,948 30 $104,973 APPLICATIONS WITHDRAWN 3 $125,240 10 $89,071 26 $124,555 4 $64,635 3 $104,110 8 $117,699 FILES CLOSED FOR INCOMPLETENESS 0 $0 2 $97,370 17 $107,635 0 $0 2 $76,310 5 $106,252
Aggregated Statistics For Year 2003(Based on 2 partial tracts) A) FHA, FSA/RHS & VA B) Conventional C) Refinancings D) Home Improvement Loans F) Non-occupant Loans on Number Average Value Number Average Value Number Average Value Number Average Value Number Average Value
LOANS ORIGINATED 8 $115,561 30 $114,689 72 $107,378 6 $9,105 8 $108,629 APPLICATIONS APPROVED, NOT ACCEPTED 0 $0 8 $92,158 17 $110,505 2 $40,030 0 $0 APPLICATIONS DENIED 2 $107,795 18 $110,574 70 $109,242 6 $43,923 3 $179,310 APPLICATIONS WITHDRAWN 2 $123,640 8 $109,462 40 $109,306 1 $31,280 1 $76,310 FILES CLOSED FOR INCOMPLETENESS 0 $0 2 $154,705 4 $106,542 0 $0 0 $0
Aggregated Statistics For Year 1999(Based on 1 partial tract) A) FHA, FSA/RHS & VA B) Conventional C) Refinancings D) Home Improvement Loans F) Non-occupant Loans on Number Average Value Number Average Value Number Average Value Number Average Value Number Average Value
LOANS ORIGINATED 11 $125,569 35 $117,380 27 $87,423 10 $23,135 3 $91,343 APPLICATIONS APPROVED, NOT ACCEPTED 0 $0 6 $116,355 8 $85,001 5 $24,674 0 $0 APPLICATIONS DENIED 3 $134,220 14 $93,649 19 $78,627 10 $24,148 2 $80,690 APPLICATIONS WITHDRAWN 2 $137,210 10 $131,538 11 $82,673 1 $43,270 1 $53,990 FILES CLOSED FOR INCOMPLETENESS 0 $0 1 $143,640 4 $79,032 0 $0 0 $0
Detailed HMDA statistics for the following Tracts:
7233.02
Private Mortgage Insurance Companies Aggregated Statistics For Year 2009(Based on 2 partial tracts) A) Conventional B) Refinancings Number Average Value Number Average Value
LOANS ORIGINATED 0 $0 0 $0 APPLICATIONS APPROVED, NOT ACCEPTED 1 $175,140 1 $223,100 APPLICATIONS DENIED 0 $0 0 $0 APPLICATIONS WITHDRAWN 0 $0 0 $0 FILES CLOSED FOR INCOMPLETENESS 0 $0 0 $0
Aggregated Statistics For Year 2008(Based on 2 partial tracts) A) Conventional B) Refinancings C) Non-occupant Loans on Number Average Value Number Average Value Number Average Value
LOANS ORIGINATED 3 $226,293 2 $217,465 1 $219,760 APPLICATIONS APPROVED, NOT ACCEPTED 3 $185,843 1 $213,090 0 $0 APPLICATIONS DENIED 0 $0 1 $297,320 0 $0 APPLICATIONS WITHDRAWN 0 $0 0 $0 0 $0 FILES CLOSED FOR INCOMPLETENESS 0 $0 0 $0 0 $0
Aggregated Statistics For Year 2007(Based on 2 partial tracts) A) Conventional B) Refinancings C) Non-occupant Loans on D) Loans On Manufactured Number Average Value Number Average Value Number Average Value Number Average Value
LOANS ORIGINATED 14 $237,779 5 $209,084 1 $261,040 3 $124,683 APPLICATIONS APPROVED, NOT ACCEPTED 3 $269,800 3 $176,530 0 $0 1 $237,270 APPLICATIONS DENIED 0 $0 0 $0 0 $0 0 $0 APPLICATIONS WITHDRAWN 1 $275,640 0 $0 0 $0 0 $0 FILES CLOSED FOR INCOMPLETENESS 0 $0 0 $0 0 $0 0 $0
Aggregated Statistics For Year 2006(Based on 2 partial tracts) A) Conventional B) Refinancings C) Non-occupant Loans on D) Loans On Manufactured Number Average Value Number Average Value Number Average Value Number Average Value
LOANS ORIGINATED 9 $144,468 5 $173,056 1 $75,060 4 $147,410 APPLICATIONS APPROVED, NOT ACCEPTED 3 $193,070 0 $0 0 $0 0 $0 APPLICATIONS DENIED 0 $0 0 $0 0 $0 0 $0 APPLICATIONS WITHDRAWN 0 $0 0 $0 0 $0 0 $0 FILES CLOSED FOR INCOMPLETENESS 0 $0 0 $0 0 $0 0 $0
Aggregated Statistics For Year 2005(Based on 2 partial tracts) A) Conventional B) Refinancings C) Non-occupant Loans on D) Loans On Manufactured Number Average Value Number Average Value Number Average Value Number Average Value
LOANS ORIGINATED 18 $149,054 3 $208,223 2 $141,155 5 $115,760 APPLICATIONS APPROVED, NOT ACCEPTED 5 $156,042 3 $108,837 0 $0 1 $70,890 APPLICATIONS DENIED 0 $0 0 $0 0 $0 0 $0 APPLICATIONS WITHDRAWN 4 $131,772 0 $0 1 $118,430 0 $0 FILES CLOSED FOR INCOMPLETENESS 0 $0 0 $0 0 $0 0 $0
Aggregated Statistics For Year 2004(Based on 2 partial tracts) A) Conventional B) Refinancings C) Non-occupant Loans on D) Loans On Manufactured Number Average Value Number Average Value Number Average Value Number Average Value
LOANS ORIGINATED 10 $132,564 5 $121,764 1 $99,660 3 $117,733 APPLICATIONS APPROVED, NOT ACCEPTED 3 $94,797 3 $114,397 0 $0 0 $0 APPLICATIONS DENIED 1 $86,320 0 $0 0 $0 0 $0 APPLICATIONS WITHDRAWN 0 $0 0 $0 0 $0 0 $0 FILES CLOSED FOR INCOMPLETENESS 0 $0 0 $0 0 $0 0 $0
Aggregated Statistics For Year 2003(Based on 2 partial tracts) A) Conventional B) Refinancings C) Non-occupant Loans on Number Average Value Number Average Value Number Average Value
LOANS ORIGINATED 13 $97,418 17 $123,334 3 $73,670 APPLICATIONS APPROVED, NOT ACCEPTED 3 $96,187 3 $88,683 0 $0 APPLICATIONS DENIED 1 $106,750 2 $114,675 1 $139,700 APPLICATIONS WITHDRAWN 0 $0 0 $0 0 $0 FILES CLOSED FOR INCOMPLETENESS 0 $0 0 $0 0 $0
Aggregated Statistics For Year 1999(Based on 1 partial tract) A) Conventional B) Refinancings Number Average Value Number Average Value
LOANS ORIGINATED 12 $135,732 3 $149,943 APPLICATIONS APPROVED, NOT ACCEPTED 3 $162,287 1 $80,300 APPLICATIONS DENIED 2 $164,885 0 $0 APPLICATIONS WITHDRAWN 0 $0 0 $0 FILES CLOSED FOR INCOMPLETENESS 0 $0 0 $0
Detailed PMIC statistics for the following Tracts:
7233.02
Most common first names in zip code 85337 among deceased individuals Name Count Lived (average)
William 11 70.7 years Robert 9 71.2 years Mary 9 77.1 years John 9 69.9 years James 9 62.6 years Jose 8 72.0 years Thomas 6 75.3 years George 6 73.2 years Donald 5 61.4 years Helen 5 81.6 years
Most common last names in zip code 85337 among deceased individuals Last name Count Lived (average)
Manuel 13 60.4 years Cipriano 7 61.6 years Gonzalez 7 73.6 years Miller 7 75.0 years Johnson 6 68.9 years Miguel 6 62.8 years Ortega 5 70.4 years Pablo 5 61.2 years Cantu 5 66.4 years Lopez 5 63.2 years
Businesses in zip code 85337
Name Count Name Count
Best Western 1 FedEx 1 Burger King 1 McDonald's 1 Dairy Queen 1 U-Haul 1


 Nearest zip codes: 85322, 85326, 85343, 85338, 85139, 85396.