Estimated zip code population in 2022: 25,680 Zip code population in 2010: 21,169 Zip code population in 2000: 24,763
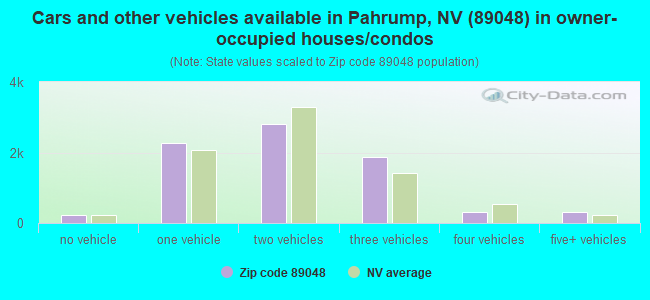
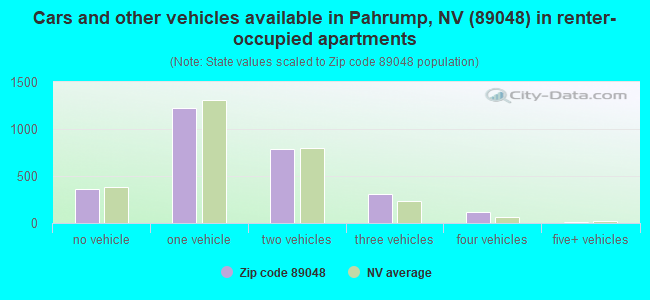
Houses and condos: 11,680 Renter-occupied apartments: 2,798
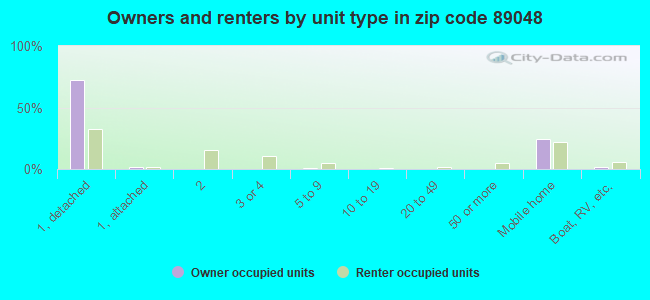
% of renters here:
26%
State:
40%
March 2022 cost of living index in zip code 89048: 91.6 (less than average, U.S. average is 100)
Land area: 76.6 sq. mi. Water area: 0.1 sq. mi.
Population density: 335 people per square mile
(very low).
OSM Map
General Map
Google Map
MSN Map
OSM Map
General Map
Google Map
MSN Map
OSM Map
General Map
Google Map
MSN Map
OSM Map
General Map
Google Map
MSN Map
Please wait while loading the map...
Real estate property taxes paid for housing units in 2022:
This zip code:
0.4% ($1,249)
Nevada:
0.4% ($1,889)
Median real estate property taxes paid for housing units with mortgages in 2022: $1,262 (0.4%) Median real estate property taxes paid for housing units with no mortgage in 2022: $1,227 (0.4%)
Averages for the 2020 tax year for zip code 89048, filed in 2021:
Average Adjusted Gross Income (AGI) in 2020: $52,241 (Individual Income Tax Returns)
Here:
$52,241
State:
$78,964
Salary/wage: $41,679 (reported on 68.7% of returns)
Here:
$41,679
State:
$54,472
(% of AGI for various income ranges: 1027.6% for AGIs below $25k, 2766.7% for AGIs $25k-50k, 5196.3% for AGIs $50k-75k, 7332.9% for AGIs $75k-100k, 13833.1% for AGIs $100k-200k, 50842.0% for AGIs over 200k)
Taxable interest for individuals: $1,766 (reported on 24.8% of returns)
This zip code:
$1,766
Nevada:
$3,521
(% of AGI for various income ranges: 19.7% for AGIs below $25k, 25.7% for AGIs $25k-50k, 45.6% for AGIs $50k-75k, 90.4% for AGIs $75k-100k, 192.0% for AGIs $100k-200k, 2230.0% for AGIs over 200k)
Ordinary dividends: $4,783 (reported on 11.9% of returns)
Here:
$4,783
State:
$13,390
(% of AGI for various income ranges: 15.6% for AGIs below $25k, 30.1% for AGIs $25k-50k, 77.9% for AGIs $50k-75k, 132.4% for AGIs $75k-100k, 211.6% for AGIs $100k-200k, 3524.0% for AGIs over 200k)
Net capital gain/loss in AGI: +$14,425 (reported on 12.3% of returns)
Here:
+$14,425
State:
+$63,025
(% of AGI for various income ranges: 3.0% for AGIs below $25k, 26.8% for AGIs $25k-50k, 77.4% for AGIs $50k-75k, 185.3% for AGIs $75k-100k, 581.6% for AGIs $100k-200k, 22236.0% for AGIs over 200k)
Profit/loss from business: +$9,666 (reported on 12.0% of returns)
Here:
+$9,666
State:
+$11,500
(% of AGI for various income ranges: 79.5% for AGIs below $25k, 134.9% for AGIs $25k-50k, 127.8% for AGIs $50k-75k, 161.4% for AGIs $75k-100k, 428.5% for AGIs $100k-200k, 3584.0% for AGIs over 200k)
Taxable individual retirement arrangement distribution: $19,701 (reported on 10.0% of returns)
89048:
$19,701
Nevada:
$23,628
(% of AGI for various income ranges: 61.8% for AGIs below $25k, 122.6% for AGIs $25k-50k, 286.3% for AGIs $50k-75k, 519.2% for AGIs $75k-100k, 904.8% for AGIs $100k-200k, 8082.0% for AGIs over 200k)
Total itemized deductions: $30,289 (reported on 4.9% of returns)
Here:
$30,289
State:
$44,173
(% of AGI for various income ranges: 26.0% for AGIs below $25k, 89.8% for AGIs $25k-50k, 249.7% for AGIs $50k-75k, 360.4% for AGIs $75k-100k, 843.1% for AGIs $100k-200k, 5318.0% for AGIs over 200k)
Charity contributions: $6,220 (reported on 3.7% of returns)
Here:
$6,220
State:
$12,589
(% of AGI for various income ranges: 11.7% for AGIs $25k-50k, 30.8% for AGIs $50k-75k, 72.0% for AGIs $75k-100k, 143.3% for AGIs $100k-200k, 892.0% for AGIs over 200k)
Taxes paid: $5,080 (reported on 4.7% of returns)
89048:
$5,080
State:
$6,112
(% of AGI for various income ranges: 4.4% for AGIs below $25k, 13.1% for AGIs $25k-50k, 38.4% for AGIs $50k-75k, 61.6% for AGIs $75k-100k, 151.3% for AGIs $100k-200k, 684.0% for AGIs over 200k)
Earned income credit: $2,224 (reported on 18.2% of returns)
Here:
$2,224
State:
$2,214
(% of AGI for various income ranges: 95.2% for AGIs below $25k, 67.1% for AGIs $25k-50k, 1.1% for AGIs $50k-75k)
Percentage of individuals using paid preparers for their 2020 taxes: 91.7%
Here:
92%
State:
93%
(% for various income ranges: 92.1% for AGIs below $25k, 91.7% for AGIs $25k-50k, 91.0% for AGIs $50k-75k, 89.6% for AGIs $75k-100k, 93.3% for AGIs $100k-200k, 89.5% for AGIs over 200k)
Averages for the 2012 tax year for zip code 89048, filed in 2013:
Average Adjusted Gross Income (AGI) in 2012: $42,517 (Individual Income Tax Returns)
Here:
$42,517
State:
$61,164
Salary/wage: $35,605 (reported on 67.7% of returns)
Here:
$35,605
State:
$45,924
(% of AGI for various income ranges: 59.0% for AGIs below $25k, 57.3% for AGIs $25k-50k, 57.0% for AGIs $50k-75k, 60.3% for AGIs $75k-100k, 62.3% for AGIs $100k-200k, 26.2% for AGIs over 200k)
Taxable interest for individuals: $1,528 (reported on 29.2% of returns)
This zip code:
$1,528
Nevada:
$3,137
(% of AGI for various income ranges: 1.9% for AGIs below $25k, 1.0% for AGIs $25k-50k, 1.0% for AGIs $50k-75k, 0.9% for AGIs $75k-100k, 0.9% for AGIs $100k-200k, 0.6% for AGIs over 200k)
Ordinary dividends: $3,827 (reported on 14.8% of returns)
Here:
$3,827
State:
$11,762
(% of AGI for various income ranges: 2.2% for AGIs below $25k, 1.4% for AGIs $25k-50k, 1.1% for AGIs $50k-75k, 0.8% for AGIs $75k-100k, 0.9% for AGIs $100k-200k, 2.5% for AGIs over 200k)
Net capital gain/loss in AGI: +$6,297 (reported on 12.8% of returns)
Here:
+$6,297
State:
+$33,127
(% of AGI for various income ranges: 0.2% for AGIs $25k-50k, 0.9% for AGIs $50k-75k, 0.8% for AGIs $75k-100k, 1.9% for AGIs $100k-200k, 15.6% for AGIs over 200k)
Profit/loss from business: +$7,531 (reported on 13.0% of returns)
Here:
+$7,531
State:
+$12,567
(% of AGI for various income ranges: 6.7% for AGIs below $25k, 2.0% for AGIs $25k-50k, 1.5% for AGIs $50k-75k, 1.1% for AGIs $75k-100k, 2.4% for AGIs $100k-200k)
Taxable individual retirement arrangement distribution: $15,458 (reported on 12.5% of returns)
89048:
$15,458
Nevada:
$20,808
(% of AGI for various income ranges: 4.4% for AGIs below $25k, 3.9% for AGIs $25k-50k, 4.0% for AGIs $50k-75k, 3.9% for AGIs $75k-100k, 8.0% for AGIs $100k-200k)
Total itemized deductions: $20,970 (28% of AGI, reported on 24.5% of returns)
Here:
$20,970
State:
$26,148
Here:
27.7% of AGI
State:
20.0% of AGI
(% of AGI for various income ranges: 8.6% for AGIs below $25k, 11.1% for AGIs $25k-50k, 11.0% for AGIs $50k-75k, 12.6% for AGIs $75k-100k, 13.6% for AGIs $100k-200k, 18.5% for AGIs over 200k)
Charity contributions: $2,682 (reported on 17.9% of returns)
Here:
$2,682
State:
$4,329
(% of AGI for various income ranges: 0.5% for AGIs below $25k, 1.0% for AGIs $25k-50k, 0.9% for AGIs $50k-75k, 1.3% for AGIs $75k-100k, 1.6% for AGIs $100k-200k, 1.2% for AGIs over 200k)
Taxes paid: $3,457 (reported on 23.9% of returns)
89048:
$3,457
State:
$5,116
(% of AGI for various income ranges: 1.2% for AGIs below $25k, 1.7% for AGIs $25k-50k, 1.9% for AGIs $50k-75k, 2.1% for AGIs $75k-100k, 2.6% for AGIs $100k-200k, 1.9% for AGIs over 200k)
Earned income credit: $2,227 (reported on 19.8% of returns)
Here:
$2,227
State:
$2,279
(% of AGI for various income ranges: 6.3% for AGIs below $25k, 0.9% for AGIs $25k-50k)
Percentage of individuals using paid preparers for their 2012 taxes: 50.3%
Here:
50%
State:
55%
(% for various income ranges: 45.1% for AGIs below $25k, 50.9% for AGIs $25k-50k, 55.4% for AGIs $50k-75k, 56.4% for AGIs $75k-100k, 60.0% for AGIs $100k-200k, 83.3% for AGIs over 200k)
Averages for the 2004 tax year for zip code 89048, filed in 2005:
Average Adjusted Gross Income (AGI) in 2004: $42,967 (Individual Income Tax Returns)
Here:
$42,967
State:
$58,367
Salary/wage: $33,192 (reported on 75.4% of returns)
Here:
$33,192
State:
$42,695
(% of AGI for various income ranges: 105.6% for AGIs below $10k, 65.5% for AGIs $10k-25k, 67.7% for AGIs $25k-50k, 65.9% for AGIs $50k-75k, 68.6% for AGIs $75k-100k, 36.0% for AGIs over 100k)
Taxable interest for individuals: $2,378 (reported on 37.0% of returns)
This zip code:
$2,378
Nevada:
$3,867
(% of AGI for various income ranges: 7.6% for AGIs below $10k, 2.4% for AGIs $10k-25k, 1.1% for AGIs $25k-50k, 1.9% for AGIs $50k-75k, 1.5% for AGIs $75k-100k, 2.7% for AGIs over 100k)
Taxable dividends: $2,126 (reported on 17.0% of returns)
Here:
$2,126
State:
$5,770
(% of AGI for various income ranges: 3.7% for AGIs below $10k, 1.1% for AGIs $10k-25k, 0.7% for AGIs $25k-50k, 0.6% for AGIs $50k-75k, 0.6% for AGIs $75k-100k, 1.0% for AGIs over 100k)
Net capital gain/loss: +$26,952 (reported on 17.4% of returns)
Here:
+$26,952
State:
+$50,644
(% of AGI for various income ranges: -0.7% for AGIs below $10k, 0.7% for AGIs $10k-25k, 1.8% for AGIs $25k-50k, 2.4% for AGIs $50k-75k, 4.7% for AGIs $75k-100k, 30.8% for AGIs over 100k)
Profit/loss from business: +$10,295 (reported on 14.9% of returns)
Here:
+$10,295
State:
+$13,618
(% of AGI for various income ranges: -4.1% for AGIs below $10k, 3.6% for AGIs $10k-25k, 3.1% for AGIs $25k-50k, 2.4% for AGIs $50k-75k, 1.7% for AGIs $75k-100k, 6.0% for AGIs over 100k)
IRA payment deduction: $3,313 (reported on 1.6% of returns)
89048:
$3,313
Nevada:
$3,054
(% of AGI for various income ranges: 0.1% for AGIs $10k-25k, 0.2% for AGIs $25k-50k, 0.1% for AGIs $50k-75k, 0.1% for AGIs $75k-100k, 0.1% for AGIs over 100k)
Self-employed pension: $19,167 (reported on 0.4% of returns)
Here:
$19,167
Nevada:
$16,706
Total itemized deductions: $19,331 (27% of AGI, reported on 36.2% of returns)
Here:
$19,331
State:
$22,990
Here:
27.5% of AGI
State:
21.8% of AGI
(% of AGI for various income ranges: 22.6% for AGIs below $10k, 13.0% for AGIs $10k-25k, 17.9% for AGIs $25k-50k, 18.0% for AGIs $50k-75k, 17.0% for AGIs $75k-100k, 14.4% for AGIs over 100k)
Charity contributions deductions: $2,628 (4% of AGI, reported on 30.4% of returns)
Here:
$2,628
State:
$3,443
Here:
3.8% of AGI
State:
3.1% of AGI
(% of AGI for various income ranges: 0.8% for AGIs below $10k, 0.9% for AGIs $10k-25k, 1.7% for AGIs $25k-50k, 1.7% for AGIs $50k-75k, 2.0% for AGIs $75k-100k, 2.5% for AGIs over 100k)
Total tax: $5,921 (reported on 71.7% of returns)
89048:
$5,921
State:
$10,585
(% of AGI for various income ranges: 2.8% for AGIs below $10k, 3.3% for AGIs $10k-25k, 6.0% for AGIs $25k-50k, 8.5% for AGIs $50k-75k, 10.1% for AGIs $75k-100k, 16.3% for AGIs over 100k)
Earned income credit: $1,786 (reported on 17.0% of returns)
Here:
$1,786
State:
$1,676
Percentage of individuals using paid preparers for their 2004 taxes: 59.4%
Here:
59%
State:
60%
(% for various income ranges: 51.7% for AGIs below $10k, 60.0% for AGIs $10k-25k, 58.5% for AGIs $25k-50k, 60.2% for AGIs $50k-75k, 64.5% for AGIs $75k-100k, 73.7% for AGIs over 100k)
Likely homosexual households (counted as self-reported same-sex unmarried-partner households)
Lesbian couples: 0.0% of all households
Gay men: 0.1% of all households
Household received Food Stamps/SNAP in the past 12 months: 2,374 Household did not receive Food Stamps/SNAP in the past 12 months: 8,235
Women who had a birth in the past 12 months: 270 (248 now married, 39 unmarried) Women who did not have a birth in the past 12 months: 4,033 (1,712 now married, 2,317 unmarried)
Housing units in zip code 89048 with a mortgage: 4,031 (181 second mortgage, 23 home equity loan, 78 both second mortgage and home equity loan) Houses without a mortgage: 22
Median monthly owner costs for units with a mortgage: $1,432 Median monthly owner costs for units without a mortgage: $391
Residents with income below the poverty level in 2022:
This zip code:
16.0%
Whole state:
12.5%
Residents with income below 50% of the poverty level in 2022:
This zip code:
6.6%
Whole state:
5.9%
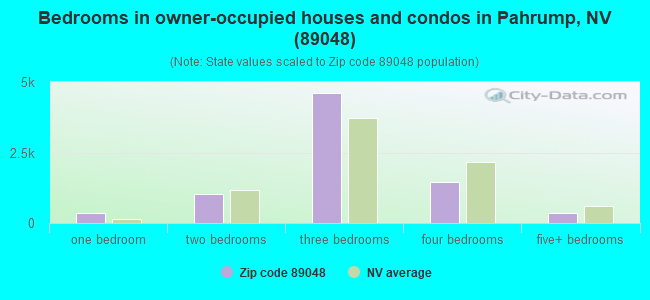
Median number of rooms in houses and condos:
Here:
6.1
State:
6.0
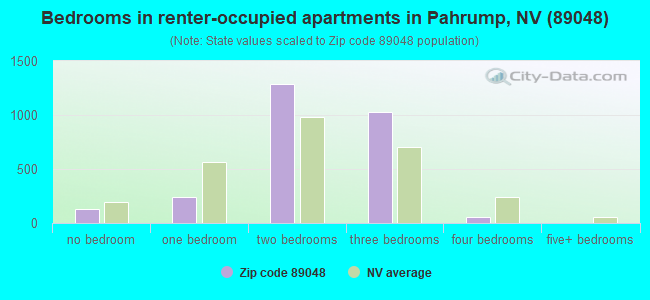
Median number of rooms in apartments:
Here:
4.4
State:
4.2
Notable locations in this zip code not listed on our city pages
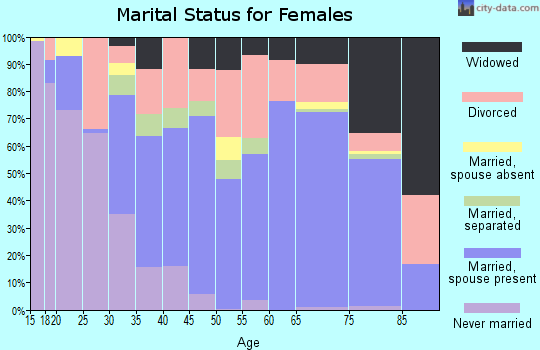
2,665 married couples with children.
1,191 single-parent households (359 men, 832 women).
89.5% of residents of 89048 zip code speak English at home.
7.6% of residents speak Spanish at home (67% very well, 10% well, 19% not well, 3% not at all).
0.7% of residents speak other Indo-European language at home (68% very well, 20% well, 11% not well).
2.5% of residents speak Asian or Pacific Island language at home (63% very well, 11% well, 14% not well, 12% not at all).
0.2% of residents speak other language at home (100% very well).
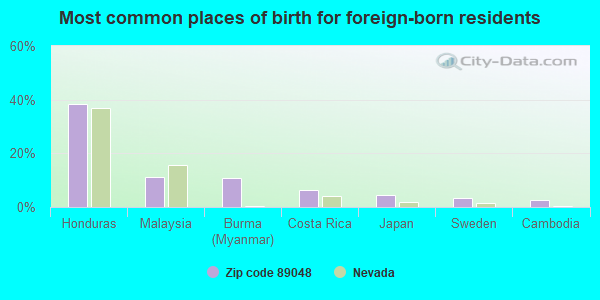
Foreign born population: 1,952 (7.6%) (63.3% of them are naturalized citizens)
This zip code:
7.6%
Whole state:
18.9%
38%Honduras
11%Malaysia
11%Burma (Myanmar)
6%Costa Rica
4%Japan
3%Sweden
3%Cambodia
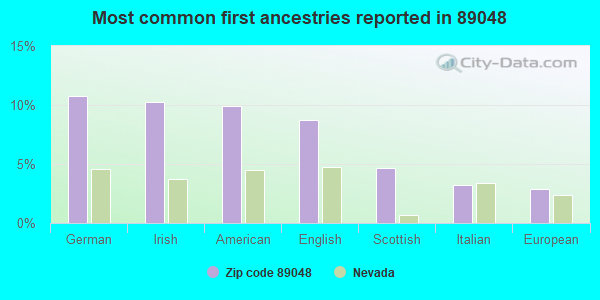
11%German
10%Irish
10%American
9%English
5%Scottish
3%Italian
3%European
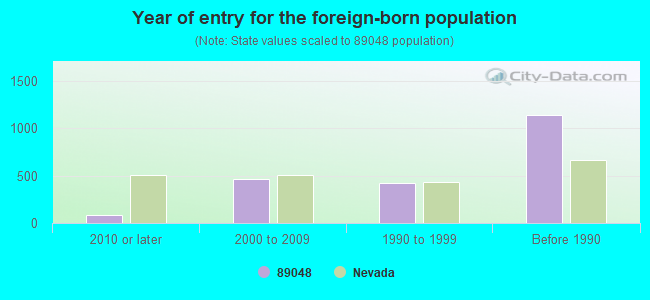
Year of entry for the foreign-born population
852010 or later
4652000 to 2009
4171990 to 1999
1,140Before 1990
Major facilities with environmental interests located in this zip code:
MANSE ELEMENTARY SCHOOL (1020 E WILSON RD in PAHRUMP, NV)
AIR MONITORING SITE (Airborne pollution emission tracking) COMPLIANCE ACTIVITY (Tracking inspections of insecticide, fungicide, and rodenticide, and toxic substances) (National Center for Education Statistics) - STATE ID-12-102 Organizations: NYE CO SCH DIST (SCHOOL DISTRICT)
CLARKE MIDSCH (2000 S. MT. CHARLESTON in PAHRUMP, NV)
(National Center for Education Statistics) - STATE ID-12-301 Organizations: NYE CO SCH DIST (SCHOOL DISTRICT)
HAFEN ELEM (2000 S. MT. CHARLESTON in PAHRUMP, NV)
(National Center for Education Statistics) - STATE ID-12-207 Organizations: NYE CO SCH DIST (SCHOOL DISTRICT)
JOHNSON, J G ELEM (900 E. JACKRABBIT in PAHRUMP, NV)
(National Center for Education Statistics) - STATE ID-12-108 Organizations: NYE CO SCH DIST (SCHOOL DISTRICT)
MT. CHARLESTON ELEM (1521 E IDAHO in PAHRUMP, NV)
(National Center for Education Statistics) - STATE ID-12-206 Organizations: NYE CO SCH DIST (SCHOOL DISTRICT)
PAHRUMP HS (501 E. CALVADA in PAHRUMP, NV)
(National Center for Education Statistics) - STATE ID-12-604 Organizations: NYE CO SCH DIST (SCHOOL DISTRICT)
PATHWAYS HS (601 SOUTH WEST STREET in PAHRUMP, NV)
(National Center for Education Statistics) - STATE ID-12-606 Organizations: NYE CO SCH DIST (SCHOOL DISTRICT)
PATHWAYS MIDSCH (601 SOUTH WEST STREET in PAHRUMP, NV)
(National Center for Education Statistics) - STATE ID-12-607 Organizations: NYE CO SCH DIST (SCHOOL DISTRICT)
DYER STREET COMPLAINT (DYER STREET AND MASON in PAHRUMP, NV)
(Resource Conservation and Recovery Act (tracking hazardous waste))
JOE'S SANITATION SITE (851 S LOLA LANE in PAHRUMP, NV)
National Pollutant Discharge Elimination System NON-MAJOR (Tracking pollutant discharge elimination systems) - permit Business SIC classification: SEWERAGE SYSTEMS
PROPERTY OWNED BY BANK OF COMMERCE (2331 BLOSSER RANCH ROAD in PAHRUMP, NV)
(Resource Conservation and Recovery Act (tracking hazardous waste))
A BORASKY EXCAVATING (1640 EAST MANSE ROAD in PAHRUMP, NV)
CRITERIA AND HAZARDOUS AIR POLLUTANT INVENTORY (Inventory of air pollution sources) Business SIC classification: CONSTRUCTION SAND AND GRAVEL
ELITE CONCRETE CORP (3200 JUSTIN LANE in PAHRUMP, NV)
CRITERIA AND HAZARDOUS AIR POLLUTANT INVENTORY (Inventory of air pollution sources) Business SIC classification: CONSTRUCTION SAND AND GRAVEL
Housing units lacking complete plumbing facilities: 1.2% Housing units lacking complete kitchen facilities: 1.4%
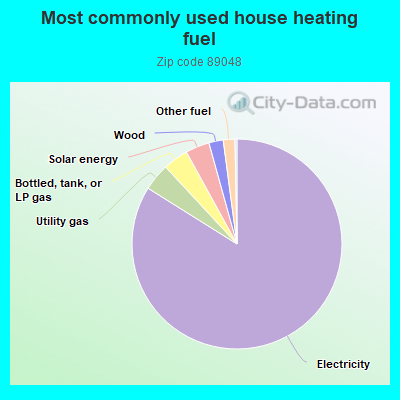
84.0%Electricity
4.2%Utility gas
3.9%Bottled, tank, or LP gas
3.7%Solar energy
2.2%Wood
1.8%Other fuel
Place of birth for U.S.-born residents:
This state: 5,312
Northeast: 1,626
Midwest: 3,937
South: 2,063
West: 10,460
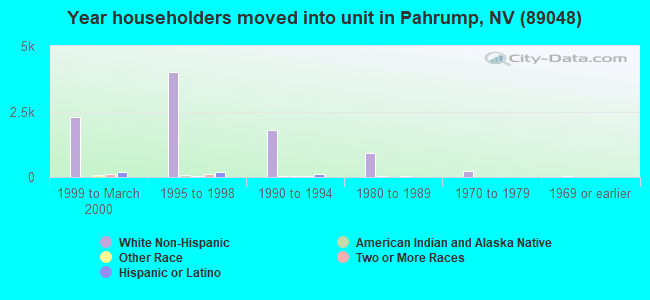
40% of the 89048 zip code residents lived in the same house 5 years ago. Out of people who lived in different houses, 21% lived in this county. Out of people who lived in different counties, 50% lived in Nevada.
89% of the 89048 zip code residents lived in the same house 1 year ago. Out of people who lived in different houses, 32% moved from this county. Out of people who lived in different houses, 25% moved from different county within same state. Out of people who lived in different houses, 47% moved from different state. Out of people who lived in different houses, 1% moved from abroad.
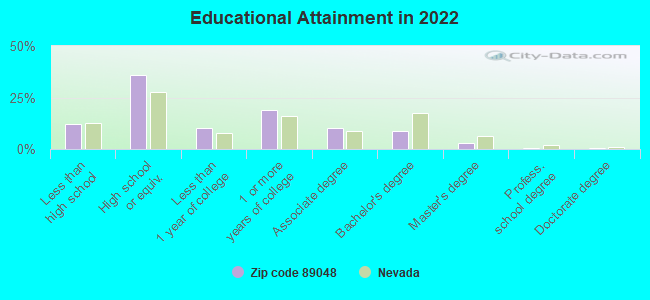
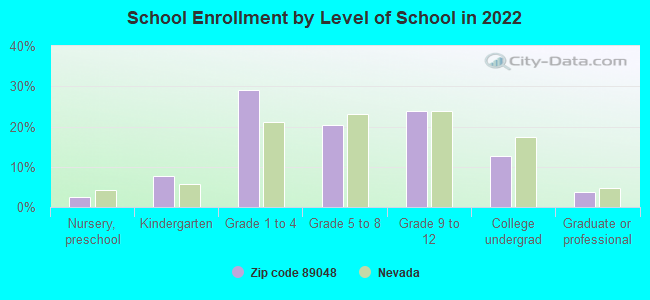
Private vs. public school enrollment:
Students in private schools in grades 1 to 8 (elementary and middle school): 399
Here:
19.6%
Nevada:
12.9%
Students in private schools in grades 9 to 12 (high school): 101
Here:
10.6%
Nevada:
6.9%
Students in private undergraduate colleges: 71
Here:
14.3%
Nevada:
16.0%
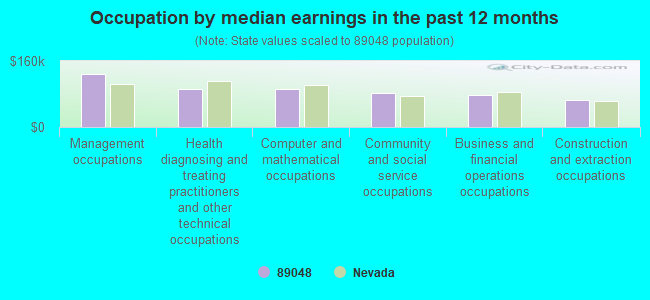
Occupation by median earnings in the past 12 months ($)
128,222Management occupations
93,275Health diagnosing and treating practitioners and other technical occupations
93,152Computer and mathematical occupations
81,330Community and social service occupations
76,497Business and financial operations occupations
64,452Construction and extraction occupations
Companies with federal contracts located in this zip code:
CLYDE SETTLE (4910 S MANKINS ST in PAHRUMP, FL; small business) : $1,440 in 2 contractsin 2002
$1,880 with U.S. Army Corps of Engineers - civil program financing only for Facilities Operations Support Services. Taking place in MA. Signed on 2002-01-10. Completion date: 2002-07-13.
-$440, same as above.Signed on 2002-06-25. Completion date: 2002-07-13.
Top industries in this zip code by the number of employees in 2005:
Construction: New Single-Family Housing Construction (except Operative Builders) (50-99: 1, 20-49: 1, 10-19: 6, 5-9: 2, 1-4: 3)
Other Services (except Public Administration): Civic and Social Organizations (100-249: 1, 1-4: 2)
Construction: Poured Concrete Foundation and Structure Contractors (50-99: 1, 20-49: 1, 10-19: 1, 1-4: 2)
Health Care and Social Assistance: Offices of Physicians (except Mental Health Specialists) (20-49: 2, 10-19: 1, 5-9: 2, 1-4: 4)
People in group quarters in 2010:
31 people in group homes intended for adults
People in group quarters in 2000:
34 people in other noninstitutional group quarters
24 people in local jails and other confinement facilities (including police lockups)
4 people in hospitals/wards and hospices for chronically ill
4 people in hospices or homes for chronically ill
Fatal accident statistics in 2014:
Fatal accident count: 3
Vehicles involved in fatal accidents: 4
Fatal accidents caused by drunken drivers: 1
Fatalities: 3
Persons involved in fatal accidents: 5
Pedestrians involved in fatal accidents: 1
Fatal accident statistics in 2013:
Fatal accident count: 2
Vehicles involved in fatal accidents: 3
Fatal accidents caused by drunken drivers: 0
Fatalities: 2
Persons involved in fatal accidents: 3
Pedestrians involved in fatal accidents: 1
Home Mortgage Disclosure Act Aggregated Statistics For Year 2003 (Based on 8 full and 2 partial tracts)
A) FHA, FSA/RHS & VA Home Purchase Loans
B) Conventional Home Purchase Loans
C) Refinancings
D) Home Improvement Loans
E) Loans on Dwellings For 5+ Families
F) Non-occupant Loans on < 5 Family Dwellings (A B C & D)
Number
Average Value
Number
Average Value
Number
Average Value
Number
Average Value
Number
Average Value
Number
Average Value
LOANS ORIGINATED
221
$113,472
973
$101,716
2,056
$106,180
51
$43,327
2
$2,050,000
326
$98,329
APPLICATIONS APPROVED, NOT ACCEPTED
13
$145,481
170
$115,800
461
$103,087
11
$40,578
0
$0
65
$115,078
APPLICATIONS DENIED
64
$107,750
346
$97,274
1,366
$105,353
120
$31,186
0
$0
116
$96,460
APPLICATIONS WITHDRAWN
31
$123,916
191
$113,187
647
$115,423
16
$37,154
0
$0
72
$101,595
FILES CLOSED FOR INCOMPLETENESS
5
$114,394
29
$120,624
101
$111,239
10
$27,999
0
$0
9
$97,904
Private Mortgage Insurance Companies Aggregated Statistics For Year 2003 (Based on 8 full and 2 partial tracts)
A) Conventional Home Purchase Loans
B) Refinancings
C) Non-occupant Loans on < 5 Family Dwellings (A & B)
Number
Average Value
Number
Average Value
Number
Average Value
LOANS ORIGINATED
362
$106,604
299
$130,512
65
$100,029
APPLICATIONS APPROVED, NOT ACCEPTED
57
$117,682
73
$129,465
6
$135,405
APPLICATIONS DENIED
13
$92,311
13
$86,838
3
$41,660
APPLICATIONS WITHDRAWN
14
$88,912
25
$120,682
3
$64,667
FILES CLOSED FOR INCOMPLETENESS
2
$99,000
1
$178,000
0
$0
2002 - 2018 National Fire Incident Reporting System (NFIRS) incidents
According to the data from the years 2002 - 2018 the average number of fires per year is 11. The highest number of fires - 92 took place in 2002, and the least - 0 in 2004. The data has a dropping trend.
When looking into fire subcategories, the most reports belonged to: Outside Fires (47.8%), and Structure Fires (27.5%).
Fire incident types reported to NFIRS in Zip Code 89048


 Nearest zip codes: 89061, 89060, 92384, 92389, 89124, 89019.
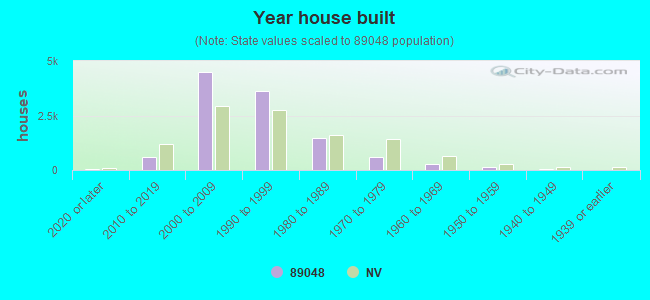


 According to the data from the years 2002 - 2018 the average number of fires per year is 11. The highest number of fires - 92 took place in 2002, and the least - 0 in 2004. The data has a dropping trend.
 When looking into fire subcategories, the most reports belonged to: Outside Fires (47.8%), and Structure Fires (27.5%).