Estimated zip code population in 2022: 49,483 Zip code population in 2010: 49,310 Zip code population in 2000: 47,127
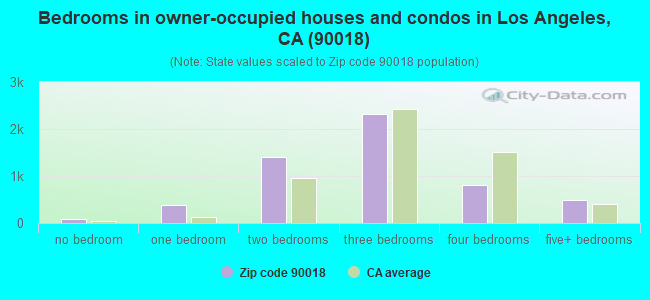
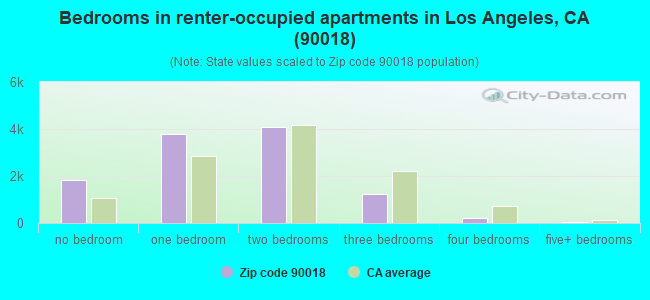
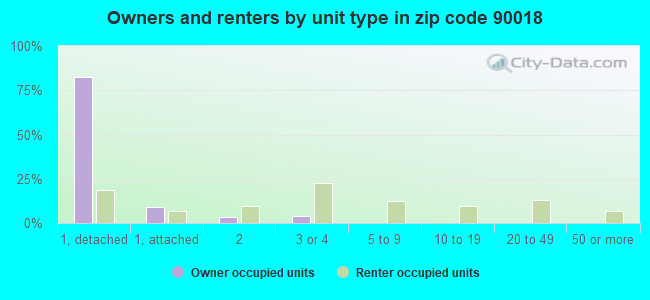
Houses and condos: 17,965 Renter-occupied apartments: 11,112
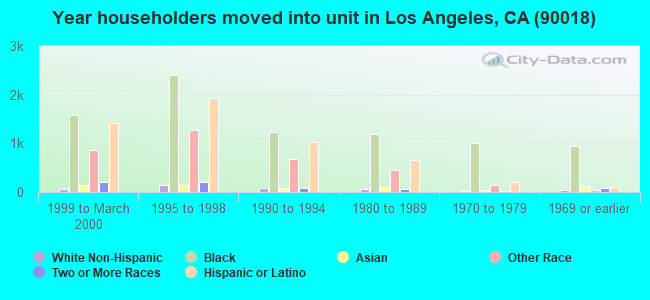
% of renters here:
67%
State:
44%
March 2022 cost of living index in zip code 90018: 144.7 (very high, U.S. average is 100)
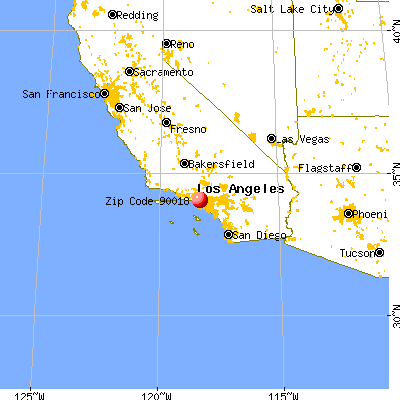
Land area: 2.9 sq. mi. Water area: 0.0 sq. mi.
Population density: 17,087 people per square mile
(very high).
OSM Map
General Map
Google Map
MSN Map
OSM Map
General Map
Google Map
MSN Map
OSM Map
General Map
Google Map
MSN Map
OSM Map
General Map
Google Map
MSN Map
Please wait while loading the map...
Real estate property taxes paid for housing units in 2022:
This zip code:
0.5% ($4,517)
California:
0.7% ($4,831)
Median real estate property taxes paid for housing units with mortgages in 2022: $5,226 (0.5%) Median real estate property taxes paid for housing units with no mortgage in 2022: $3,023 (0.4%)
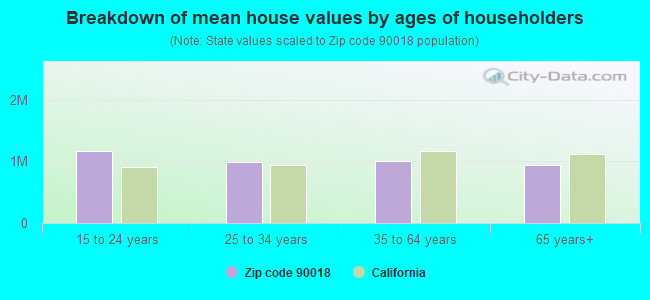
Estimated median house/condo value in 2022: $923,949
90018:
$923,949
California:
$715,900
According to our research of California and other state lists, there were 88 registered sex offenders living in 90018 zip code as of April 23, 2024. The ratio of all residents to sex offenders in zip code 90018 is 595 to 1. The ratio of registered sex offenders to all residents in this zip code is near the state average.
Median resident age:
This zip code:
36.5 years
California median age:
37.9 years
Average household size:
This zip code:
2.9 people
California:
2.8 people
Averages for the 2020 tax year for zip code 90018, filed in 2021:
Average Adjusted Gross Income (AGI) in 2020: $45,119 (Individual Income Tax Returns)
Here:
$45,119
State:
$95,910
Salary/wage: $43,288 (reported on 79.4% of returns)
Here:
$43,288
State:
$77,331
(% of AGI for various income ranges: 1204.3% for AGIs below $25k, 4134.6% for AGIs $25k-50k, 7677.8% for AGIs $50k-75k, 11279.0% for AGIs $75k-100k, 20651.9% for AGIs $100k-200k, 82831.4% for AGIs over 200k)
Taxable interest for individuals: $491 (reported on 17.9% of returns)
This zip code:
$491
California:
$2,294
(% of AGI for various income ranges: 4.0% for AGIs below $25k, 5.7% for AGIs $25k-50k, 13.3% for AGIs $50k-75k, 20.3% for AGIs $75k-100k, 72.4% for AGIs $100k-200k, 385.0% for AGIs over 200k)
Ordinary dividends: $1,758 (reported on 6.5% of returns)
Here:
$1,758
State:
$10,949
(% of AGI for various income ranges: 2.6% for AGIs below $25k, 4.1% for AGIs $25k-50k, 11.7% for AGIs $50k-75k, 37.0% for AGIs $75k-100k, 97.3% for AGIs $100k-200k, 737.9% for AGIs over 200k)
Net capital gain/loss in AGI: +$9,275 (reported on 7.2% of returns)
Here:
+$9,275
State:
+$49,306
(% of AGI for various income ranges: 1.1% for AGIs below $25k, 7.9% for AGIs $25k-50k, 31.0% for AGIs $50k-75k, 59.4% for AGIs $75k-100k, 369.2% for AGIs $100k-200k, 8070.7% for AGIs over 200k)
Profit/loss from business: +$7,901 (reported on 26.1% of returns)
Here:
+$7,901
State:
+$15,671
(% of AGI for various income ranges: 325.5% for AGIs below $25k, 179.7% for AGIs $25k-50k, 224.7% for AGIs $50k-75k, 430.0% for AGIs $75k-100k, 742.0% for AGIs $100k-200k, 3770.0% for AGIs over 200k)
Taxable individual retirement arrangement distribution: $12,538 (reported on 1.7% of returns)
90018:
$12,538
California:
$23,505
(% of AGI for various income ranges: 9.1% for AGIs below $25k, 14.4% for AGIs $25k-50k, 50.2% for AGIs $50k-75k, 82.2% for AGIs $75k-100k, 173.3% for AGIs $100k-200k, 401.4% for AGIs over 200k)
Self-employed (Keogh) retirement plans: $23,500 (reported on 0.2% of returns)
90018:
$23,500
California:
$30,163
(% of AGI for various income ranges: 125.3% for AGIs $100k-200k)
Total itemized deductions: $30,689 (reported on 8.6% of returns)
Here:
$30,689
State:
$39,517
(% of AGI for various income ranges: 46.1% for AGIs below $25k, 143.4% for AGIs $25k-50k, 548.2% for AGIs $50k-75k, 1038.6% for AGIs $75k-100k, 2241.5% for AGIs $100k-200k, 10672.1% for AGIs over 200k)
Charity contributions: $5,764 (reported on 6.9% of returns)
Here:
$5,764
State:
$12,598
(% of AGI for various income ranges: 4.1% for AGIs below $25k, 19.0% for AGIs $25k-50k, 83.0% for AGIs $50k-75k, 186.5% for AGIs $75k-100k, 390.3% for AGIs $100k-200k, 1355.7% for AGIs over 200k)
Taxes paid: $7,679 (reported on 8.6% of returns)
90018:
$7,679
State:
$8,807
(% of AGI for various income ranges: 9.8% for AGIs below $25k, 31.5% for AGIs $25k-50k, 135.5% for AGIs $50k-75k, 306.7% for AGIs $75k-100k, 692.4% for AGIs $100k-200k, 1938.6% for AGIs over 200k)
Earned income credit: $2,063 (reported on 23.6% of returns)
Here:
$2,063
State:
$2,074
(% of AGI for various income ranges: 124.6% for AGIs below $25k, 72.6% for AGIs $25k-50k, 0.7% for AGIs $50k-75k)
Percentage of individuals using paid preparers for their 2020 taxes: 89.8%
Here:
90%
State:
92%
(% for various income ranges: 87.9% for AGIs below $25k, 90.7% for AGIs $25k-50k, 90.9% for AGIs $50k-75k, 92.0% for AGIs $75k-100k, 92.1% for AGIs $100k-200k, 93.2% for AGIs over 200k)
Averages for the 2012 tax year for zip code 90018, filed in 2013:
Average Adjusted Gross Income (AGI) in 2012: $30,242 (Individual Income Tax Returns)
Here:
$30,242
State:
$72,726
Salary/wage: $30,568 (reported on 81.3% of returns)
Here:
$30,568
State:
$59,079
(% of AGI for various income ranges: 73.9% for AGIs below $25k, 89.0% for AGIs $25k-50k, 85.5% for AGIs $50k-75k, 82.2% for AGIs $75k-100k, 80.3% for AGIs $100k-200k, 68.0% for AGIs over 200k)
Taxable interest for individuals: $366 (reported on 15.9% of returns)
This zip code:
$366
California:
$2,146
(% of AGI for various income ranges: 0.2% for AGIs below $25k, 0.2% for AGIs $50k-75k, 0.2% for AGIs $75k-100k, 0.4% for AGIs $100k-200k, 0.3% for AGIs over 200k)
Ordinary dividends: $2,042 (reported on 3.7% of returns)
Here:
$2,042
State:
$9,308
(% of AGI for various income ranges: 0.2% for AGIs below $25k, 0.1% for AGIs $25k-50k, 0.2% for AGIs $50k-75k, 0.3% for AGIs $75k-100k, 0.7% for AGIs $100k-200k, 0.5% for AGIs over 200k)
Net capital gain/loss in AGI: +$3,023 (reported on 2.9% of returns)
Here:
+$3,023
State:
+$30,460
(% of AGI for various income ranges: 0.1% for AGIs $50k-75k, 0.5% for AGIs $100k-200k, 6.3% for AGIs over 200k)
Profit/loss from business: +$8,799 (reported on 23.5% of returns)
Here:
+$8,799
State:
+$17,064
(% of AGI for various income ranges: 19.1% for AGIs below $25k, 3.5% for AGIs $25k-50k, 2.1% for AGIs $50k-75k, 2.6% for AGIs $75k-100k, 2.3% for AGIs $100k-200k, 2.4% for AGIs over 200k)
Taxable individual retirement arrangement distribution: $12,389 (reported on 1.8% of returns)
90018:
$12,389
California:
$19,557
(% of AGI for various income ranges: 0.5% for AGIs below $25k, 0.5% for AGIs $25k-50k, 0.8% for AGIs $50k-75k, 0.8% for AGIs $75k-100k, 2.4% for AGIs $100k-200k)
Total itemized deductions: $20,440 (34% of AGI, reported on 20.1% of returns)
Here:
$20,440
State:
$34,004
Here:
33.5% of AGI
State:
22.7% of AGI
(% of AGI for various income ranges: 6.2% for AGIs below $25k, 11.7% for AGIs $25k-50k, 18.1% for AGIs $50k-75k, 20.1% for AGIs $75k-100k, 21.0% for AGIs $100k-200k, 18.4% for AGIs over 200k)
Charity contributions: $3,272 (reported on 15.5% of returns)
Here:
$3,272
State:
$4,659
(% of AGI for various income ranges: 0.4% for AGIs below $25k, 1.4% for AGIs $25k-50k, 2.6% for AGIs $50k-75k, 2.7% for AGIs $75k-100k, 2.7% for AGIs $100k-200k, 2.3% for AGIs over 200k)
Taxes paid: $5,414 (reported on 20.0% of returns)
90018:
$5,414
State:
$14,448
(% of AGI for various income ranges: 1.2% for AGIs below $25k, 2.3% for AGIs $25k-50k, 4.5% for AGIs $50k-75k, 5.9% for AGIs $75k-100k, 7.2% for AGIs $100k-200k, 8.8% for AGIs over 200k)
Earned income credit: $2,448 (reported on 35.4% of returns)
Here:
$2,448
State:
$2,286
(% of AGI for various income ranges: 9.6% for AGIs below $25k, 1.5% for AGIs $25k-50k)
Percentage of individuals using paid preparers for their 2012 taxes: 74.1%
Here:
74%
State:
64%
(% for various income ranges: 73.5% for AGIs below $25k, 75.0% for AGIs $25k-50k, 74.6% for AGIs $50k-75k, 75.3% for AGIs $75k-100k, 74.5% for AGIs $100k-200k, 75.0% for AGIs over 200k)
Averages for the 2004 tax year for zip code 90018, filed in 2005:
Average Adjusted Gross Income (AGI) in 2004: $25,757 (Individual Income Tax Returns)
Here:
$25,757
State:
$58,600
Salary/wage: $26,191 (reported on 83.2% of returns)
Here:
$26,191
State:
$49,455
(% of AGI for various income ranges: 75.3% for AGIs below $10k, 82.7% for AGIs $10k-25k, 90.9% for AGIs $25k-50k, 86.8% for AGIs $50k-75k, 84.6% for AGIs $75k-100k, 65.2% for AGIs over 100k)
Taxable interest for individuals: $796 (reported on 21.1% of returns)
This zip code:
$796
California:
$2,365
(% of AGI for various income ranges: 1.2% for AGIs below $10k, 0.3% for AGIs $10k-25k, 0.5% for AGIs $25k-50k, 0.8% for AGIs $50k-75k, 0.9% for AGIs $75k-100k, 1.4% for AGIs over 100k)
Taxable dividends: $1,526 (reported on 4.8% of returns)
Here:
$1,526
State:
$4,746
(% of AGI for various income ranges: 0.3% for AGIs below $10k, 0.1% for AGIs $10k-25k, 0.2% for AGIs $25k-50k, 0.3% for AGIs $50k-75k, 0.5% for AGIs $75k-100k, 1.0% for AGIs over 100k)
Net capital gain/loss: +$11,140 (reported on 3.6% of returns)
Here:
+$11,140
State:
+$23,418
(% of AGI for various income ranges: 0.1% for AGIs below $10k, 0.0% for AGIs $10k-25k, 0.2% for AGIs $25k-50k, 1.1% for AGIs $50k-75k, 1.4% for AGIs $75k-100k, 13.1% for AGIs over 100k)
Profit/loss from business: +$7,654 (reported on 20.8% of returns)
Here:
+$7,654
State:
+$16,826
(% of AGI for various income ranges: 34.5% for AGIs below $10k, 11.5% for AGIs $10k-25k, 2.3% for AGIs $25k-50k, 2.0% for AGIs $50k-75k, 2.6% for AGIs $75k-100k, 3.7% for AGIs over 100k)
IRA payment deduction: $2,043 (reported on 1.1% of returns)
90018:
$2,043
California:
$3,192
(% of AGI for various income ranges: 0.0% for AGIs below $10k, 0.1% for AGIs $10k-25k, 0.1% for AGIs $25k-50k, 0.1% for AGIs $50k-75k, 0.1% for AGIs $75k-100k, 0.1% for AGIs over 100k)
Self-employed pension: $11,722 (reported on 0.1% of returns)
Here:
$11,722
California:
$17,688
Total itemized deductions: $19,506 (40% of AGI, reported on 22.5% of returns)
Here:
$19,506
State:
$28,113
Here:
40.1% of AGI
State:
25.3% of AGI
(% of AGI for various income ranges: 11.3% for AGIs below $10k, 8.5% for AGIs $10k-25k, 19.1% for AGIs $25k-50k, 21.9% for AGIs $50k-75k, 24.3% for AGIs $75k-100k, 21.3% for AGIs over 100k)
Charity contributions deductions: $3,116 (6% of AGI, reported on 18.9% of returns)
Here:
$3,116
State:
$3,923
Here:
6.1% of AGI
State:
3.3% of AGI
(% of AGI for various income ranges: 0.5% for AGIs below $10k, 0.8% for AGIs $10k-25k, 2.3% for AGIs $25k-50k, 3.6% for AGIs $50k-75k, 3.9% for AGIs $75k-100k, 3.6% for AGIs over 100k)
Total tax: $2,641 (reported on 62.0% of returns)
90018:
$2,641
State:
$10,761
(% of AGI for various income ranges: 6.0% for AGIs below $10k, 3.6% for AGIs $10k-25k, 4.9% for AGIs $25k-50k, 8.0% for AGIs $50k-75k, 10.0% for AGIs $75k-100k, 14.5% for AGIs over 100k)
Earned income credit: $2,006 (reported on 38.8% of returns)
Here:
$2,006
State:
$1,763
Percentage of individuals using paid preparers for their 2004 taxes: 77.9%
Here:
78%
State:
66%
(% for various income ranges: 73.9% for AGIs below $10k, 79.9% for AGIs $10k-25k, 78.5% for AGIs $25k-50k, 77.8% for AGIs $50k-75k, 76.9% for AGIs $75k-100k, 82.1% for AGIs over 100k)
Likely homosexual households (counted as self-reported same-sex unmarried-partner households)
Lesbian couples: 0.2% of all households
Gay men: 0.2% of all households
Household received Food Stamps/SNAP in the past 12 months: 4,009 Household did not receive Food Stamps/SNAP in the past 12 months: 13,020
Women who had a birth in the past 12 months: 591 (386 now married, 205 unmarried) Women who did not have a birth in the past 12 months: 12,118 (3,771 now married, 8,390 unmarried)
Housing units in zip code 90018 with a mortgage: 3,799 (398 second mortgage, 30 home equity loan, 330 both second mortgage and home equity loan) Houses without a mortgage: 18
Median monthly owner costs for units with a mortgage: $2,846 Median monthly owner costs for units without a mortgage: $740
Residents with income below the poverty level in 2022:
This zip code:
22.1%
Whole state:
12.2%
Residents with income below 50% of the poverty level in 2022:
This zip code:
12.7%
Whole state:
6.2%
Median number of rooms in houses and condos:
Here:
5.7
State:
6.0
Median number of rooms in apartments:
Here:
3.5
State:
3.9
Notable locations in this zip code not listed on our city pages
Notable locations in zip code 90018: Washington Irving Branch Los Angeles Public Library (A), William Andrews Clark Memorial Library (B), Jefferson Branch Los Angeles Public Library (C), Home for the Armenian Aged (D), City of Los Angeles Fire Department Station 34 (E), Los Angeles Fire Department Station Number 26 (F), City of Los Angeles Fire Department Station 26 (G). Display/hide their locations on the map
Churches in zip code 90018 include: Saint Pauls Catholic Church (A), McCarty Memorial Christian Church (B), Saint Andrew Baptist Church (C), Saint Pauls Lutheran Church (D), United Church of Christ Scientist (E), Berean Seventh Day Adventist Church (F), Church of Christ (G), Church of Christian Fellowship (H), Convent of the Helpers of the Holy Souls (I). Display/hide their locations on the map
Parks in zip code 90018 include: Denker Recreation Center (1), Gramercy Park (2), Leslie N Shaw Park (3), Loren Miller Park (4), Second Avenue Park (5). Display/hide their locations on the map
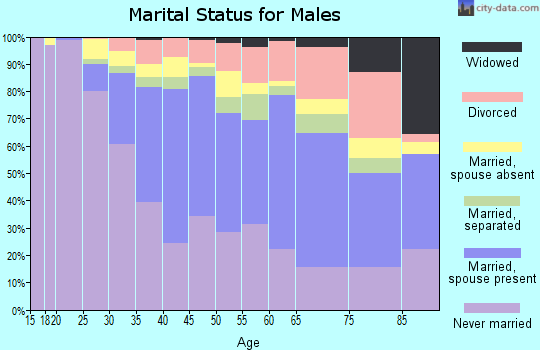
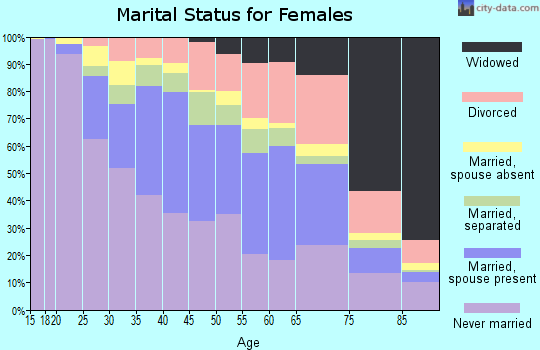
4,492 married couples with children.
3,241 single-parent households (929 men, 2,312 women).
35.1% of residents of 90018 zip code speak English at home.
55.0% of residents speak Spanish at home (55% very well, 17% well, 19% not well, 9% not at all).
1.8% of residents speak other Indo-European language at home (97% very well, 3% well).
4.9% of residents speak Asian or Pacific Island language at home (43% very well, 22% well, 26% not well, 9% not at all).
3.2% of residents speak other language at home (56% very well, 30% well, 8% not well, 6% not at all).
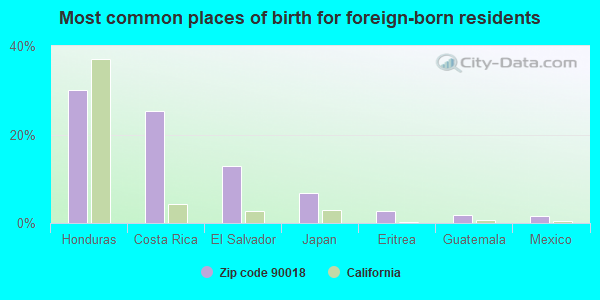
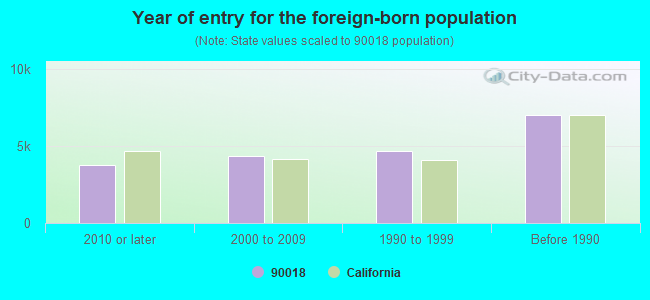
Foreign born population: 19,055 (38.5%) (46.1% of them are naturalized citizens)
Major facilities with environmental interests located in this zip code:
LA WESTERN DISTRICT STORAGE YARD (2801 EXPOSITION BLVD in LOS ANGELES, CA)
STATE MASTER (California - Hazardous Waste Tracking) - HAZARDOU WASTE PROGRAM (Resource Conservation and Recovery Act (tracking hazardous waste)) Organizations: CITY OF LOS ANGELES (CONTACT/OWNER)
Alternative names: CITY OF LA GENERAL SERVICES
LOS ANGELES TECHNOLOGY CENTER (3721 W WASHINGTON BLVD in LOS ANGELES, CA)
STATE MASTER (California - Hazardous Waste Tracking) - HAZARDOU WASTE PROGRAM Large Quantity Generators, more that 1000 kg of hazardous waste/month (Resource Conservation and Recovery Act (tracking hazardous waste)) Organizations: LA TECH CTR (CONTACT/OPERATOR)
, LAUSD (CONTACT/OWNER)
LAUSD 6TH AVE ELEM SCHOOL (3109 SIXTH AVE in LOS ANGELES, CA)
STATE MASTER (California - Hazardous Waste Tracking) - HAZARDOU WASTE PROGRAM Small Quantity Generators, between 100 kg and 1000 kg of hazardous waste/month (Resource Conservation and Recovery Act (tracking hazardous waste)) - notification Alternative names: LAUSD/ SIXTH AVE ELEM, SIXTH AVENUE ELEMENTARY
LAUSD FOSHAY JUNIOR HIGH SCHOOL (3751 S HARVARD BLVD in LOS ANGELES, CA)
STATE MASTER (California - Hazardous Waste Tracking) - HAZARDOU WASTE PROGRAM Small Quantity Generators, between 100 kg and 1000 kg of hazardous waste/month (Resource Conservation and Recovery Act (tracking hazardous waste)) - notification Alternative names: LAUSD/ FOSHAY JR
M & J REFINISHING (2429 W WASHINGTON BLVD in LOS ANGELES, CA)
STATE MASTER (California - Hazardous Waste Tracking) - HAZARDOU WASTE PROGRAM Small Quantity Generators, between 100 kg and 1000 kg of hazardous waste/month (Resource Conservation and Recovery Act (tracking hazardous waste)) - notification Organizations: JOSE SOLTERO (CONTACT/OWNER)
MELS AUTO BODY (3423 W JEFFERSON BLVD in LOS ANGELES, CA)
STATE MASTER (California - Hazardous Waste Tracking) - HAZARDOU WASTE PROGRAM Small Quantity Generators, between 100 kg and 1000 kg of hazardous waste/month (Resource Conservation and Recovery Act (tracking hazardous waste))
FOSHAY LEARNING CENTER (K-12) (3751 S. HARVARD BLVD. in LOS ANGELES, CA)
(National Center for Education Statistics) - STATE ID-6061451 Organizations: LOS ANGELES UNIFIED (SCHOOL DISTRICT)
MID CITY MAGNET (3150 W ADAMS BLVD. in LOS ANGELES, CA)
(National Center for Education Statistics) - STATE ID-1931070 Organizations: LOS ANGELES UNIFIED (SCHOOL DISTRICT)
EXXONMOBIL OIL CORP. (4380 W ADAMS BLVD in LOS ANGELES, CA)
HAZARDOUS WASTE BIENNIAL REPORTER (Resource Conservation and Recovery Act (tracking hazardous waste)) Large Quantity Generators, more that 1000 kg of hazardous waste/month (Resource Conservation and Recovery Act (tracking hazardous waste)) Organizations: EXXONMOBIL OIL CORPORATION (CONTACT/OWNER)
LAUSD--WIDNEY HS SPEC ED (2302 S. GRAMERCY PLACE in LOS ANGELES, CA)
Large Quantity Generators, more that 1000 kg of hazardous waste/month (Resource Conservation and Recovery Act (tracking hazardous waste))
CHEVRON 94125 (1907 ARLINGTON AVE. in LOS ANGELES, CA)
HAZARDOUS WASTE BIENNIAL REPORTER (Resource Conservation and Recovery Act (tracking hazardous waste)) Large Quantity Generators, more that 1000 kg of hazardous waste/month (Resource Conservation and Recovery Act (tracking hazardous waste))
A & J CO (2401 W WASHINGTON BLVD in LOS ANGELES, CA)
Small Quantity Generators, between 100 kg and 1000 kg of hazardous waste/month (Resource Conservation and Recovery Act (tracking hazardous waste)) Organizations: JUAN SOLTERO (CONTACT/OWNER)
LA SEINAN SENIOR CITIZENS CENTER (3116 W JEFFERSON BLVD in LOS ANGELES, CA)
Small Quantity Generators, between 100 kg and 1000 kg of hazardous waste/month (Resource Conservation and Recovery Act (tracking hazardous waste)) - notification Organizations: CITY OF LOS ANGELES (CONTACT/OWNER)
Housing units lacking complete plumbing facilities: 1.5% Housing units lacking complete kitchen facilities: 4.0%
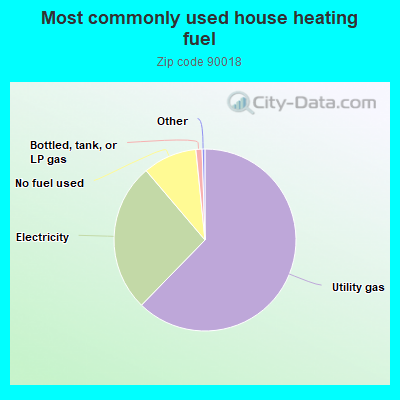
62.3%Utility gas
26.5%Electricity
9.6%No fuel used
1.1%Bottled, tank, or LP gas
Population in 1990: 48,267.
Place of birth for U.S.-born residents:
This state: 23,932
Northeast: 1,171
Midwest: 1,136
South: 2,340
West: 988
57% of the 90018 zip code residents lived in the same house 5 years ago. Out of people who lived in different houses, 92% lived in this county. Out of people who lived in different counties, 50% lived in California.
93% of the 90018 zip code residents lived in the same house 1 year ago. Out of people who lived in different houses, 76% moved from this county. Out of people who lived in different houses, 6% moved from different county within same state. Out of people who lived in different houses, 9% moved from different state. Out of people who lived in different houses, 11% moved from abroad.
Private vs. public school enrollment:
Students in private schools in grades 1 to 8 (elementary and middle school): 345
Here:
7.6%
California:
10.5%
Students in private schools in grades 9 to 12 (high school): 267
Here:
11.5%
California:
8.5%
Students in private undergraduate colleges: 445
Here:
15.6%
California:
15.9%
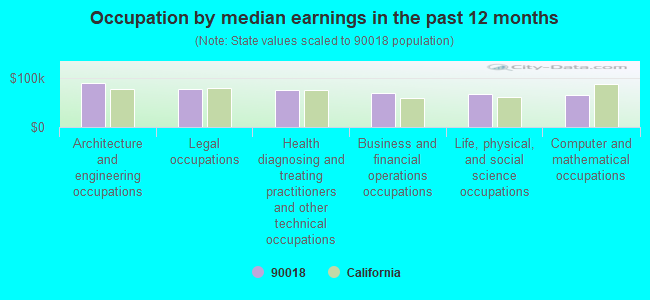
Occupation by median earnings in the past 12 months ($)
89,306Architecture and engineering occupations
76,149Legal occupations
75,784Health diagnosing and treating practitioners and other technical occupations
68,023Business and financial operations occupations
67,436Life, physical, and social science occupations
64,747Computer and mathematical occupations
Companies with federal contracts located in this zip code:
V. T. P. INC. (2820 W. JEFFERSON BLVD. in LOS ANGELES, CA; small business)
$93,950 with Air Force for Carpet Laying and Cleaning. Signed on 2000-04-04. Completion date: 2000-08-31.
ENGLEKIRK & SABOL CONSULTING S (2116 ARLINGTON AVE in LOS ANGELES, CA) : $12,200 in 4 contractsfrom 2003 to 2004
$3,100 with Army for Engineering and Technical Services. Signed on 2004-02-27. Completion date: 2004-08-23.
$3,100 with U.S. Army Corps of Engineers - civil program financing only for Engineering and Technical Services. Signed on 2004-02-27. Completion date: 2004-08-23.
$3,000 with Army for Engineering and Technical Services. Signed on 2003-10-14. Completion date: 2004-02-05.
$3,000 with U.S. Army Corps of Engineers - civil program financing only for Engineering and Technical Services. Signed on 2003-10-14. Completion date: 2004-02-05.
Top industries in this zip code by the number of employees in 2005:
Health Care and Social Assistance: General Medical and Surgical Hospitals (500-999 employees: 1 establishment)
Health Care and Social Assistance: Nursing Care Facilities (100-249: 3, 50-99: 2, 20-49: 1, 5-9: 1)
Other Services (except Public Administration): Religious Organizations (50-99: 2, 20-49: 1, 10-19: 4, 5-9: 4, 1-4: 13)
2005 - 2018 National Fire Incident Reporting System (NFIRS) incidents
According to the data from the years 2005 - 2018 the average number of fires per year is 164. The highest number of fire incidents - 252 took place in 2005, and the least - 116 in 2011. The data has a decreasing trend.
When looking into fire subcategories, the most incidents belonged to: Structure Fires (47.4%), and Mobile Property/Vehicle Fires (27.4%).
Fire incident types reported to NFIRS in Zip Code 90018


 Nearest zip codes: 90062, 90019, 90006, 90005, 90089, 90007.


 According to the data from the years 2005 - 2018 the average number of fires per year is 164. The highest number of fire incidents - 252 took place in 2005, and the least - 116 in 2011. The data has a decreasing trend.
 When looking into fire subcategories, the most incidents belonged to: Structure Fires (47.4%), and Mobile Property/Vehicle Fires (27.4%).