Estimated zip code population in 2022: 22,916 Zip code population in 2010: 24,740 Zip code population in 2000: 23,075
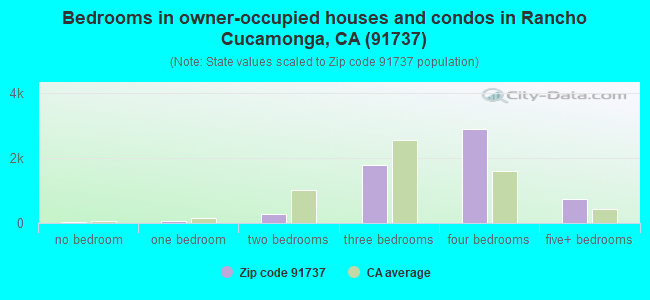
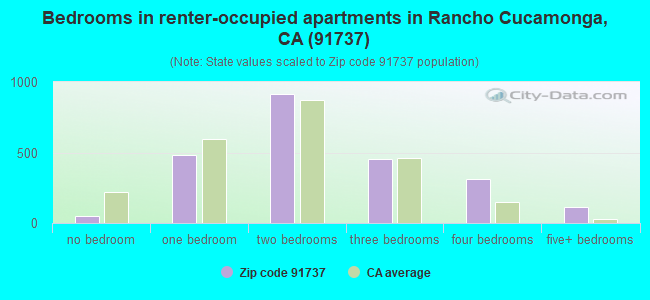
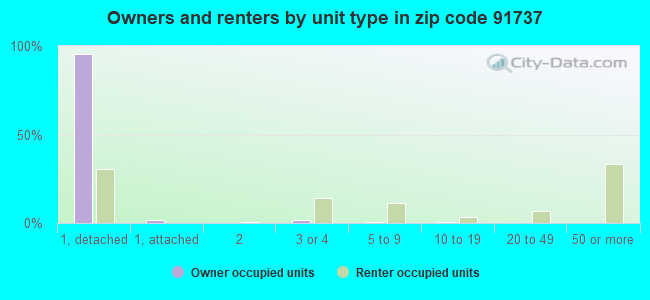
Houses and condos: 8,378 Renter-occupied apartments: 2,333
% of renters here:
29%
State:
44%
March 2022 cost of living index in zip code 91737: 83.7 (less than average, U.S. average is 100)
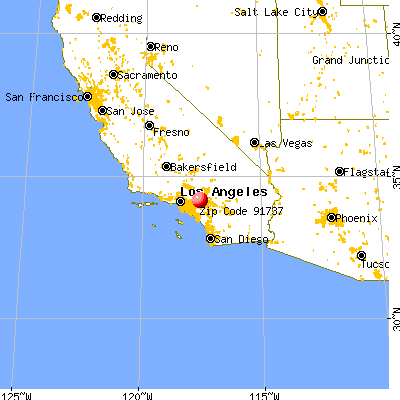
Land area: 8.4 sq. mi. Water area: 0.0 sq. mi.
Population density: 2,736 people per square mile
(average).
OSM Map
General Map
Google Map
MSN Map
OSM Map
General Map
Google Map
MSN Map
OSM Map
General Map
Google Map
MSN Map
OSM Map
General Map
Google Map
MSN Map
Please wait while loading the map...
Real estate property taxes paid for housing units in 2022:
This zip code:
0.6% ($5,414)
California:
0.7% ($4,831)
Median real estate property taxes paid for housing units with mortgages in 2022: $5,928 (0.7%) Median real estate property taxes paid for housing units with no mortgage in 2022: $4,426 (0.5%)
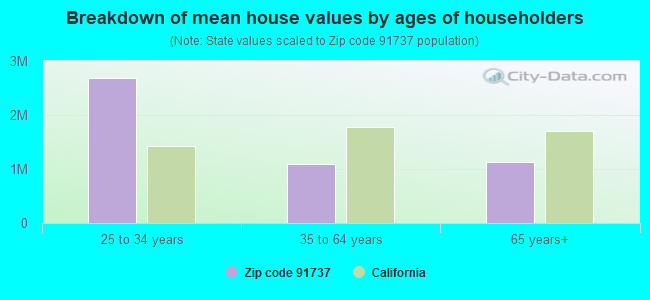
Estimated median house/condo value in 2022: $842,293
91737:
$842,293
California:
$715,900
According to our research of California and other state lists, there were 16 registered sex offenders living in 91737 zip code as of April 19, 2024. The ratio of all residents to sex offenders in zip code 91737 is 1,617 to 1. The ratio of registered sex offenders to all residents in this zip code is lower than the state average.
Median resident age:
This zip code:
44.2 years
California median age:
37.9 years
Average household size:
This zip code:
2.8 people
California:
2.8 people
Averages for the 2020 tax year for zip code 91737, filed in 2021:
Average Adjusted Gross Income (AGI) in 2020: $105,737 (Individual Income Tax Returns)
Here:
$105,737
State:
$95,910
Salary/wage: $81,971 (reported on 79.8% of returns)
Here:
$81,971
State:
$77,331
(% of AGI for various income ranges: 1222.6% for AGIs below $25k, 3715.6% for AGIs $25k-50k, 7256.3% for AGIs $50k-75k, 10668.1% for AGIs $75k-100k, 20023.9% for AGIs $100k-200k, 81686.5% for AGIs over 200k)
Taxable interest for individuals: $1,713 (reported on 43.8% of returns)
This zip code:
$1,713
California:
$2,294
(% of AGI for various income ranges: 24.3% for AGIs below $25k, 38.0% for AGIs $25k-50k, 67.1% for AGIs $50k-75k, 84.4% for AGIs $75k-100k, 126.5% for AGIs $100k-200k, 1353.0% for AGIs over 200k)
Ordinary dividends: $6,182 (reported on 21.4% of returns)
Here:
$6,182
State:
$10,949
(% of AGI for various income ranges: 30.0% for AGIs below $25k, 32.7% for AGIs $25k-50k, 77.0% for AGIs $50k-75k, 139.1% for AGIs $75k-100k, 226.8% for AGIs $100k-200k, 2723.5% for AGIs over 200k)
Net capital gain/loss in AGI: +$27,785 (reported on 21.8% of returns)
Here:
+$27,785
State:
+$49,306
(% of AGI for various income ranges: 17.1% for AGIs below $25k, 51.9% for AGIs $25k-50k, 102.1% for AGIs $50k-75k, 161.7% for AGIs $75k-100k, 443.2% for AGIs $100k-200k, 17007.3% for AGIs over 200k)
Profit/loss from business: +$16,115 (reported on 19.2% of returns)
Here:
+$16,115
State:
+$15,671
(% of AGI for various income ranges: 154.5% for AGIs below $25k, 203.9% for AGIs $25k-50k, 388.0% for AGIs $50k-75k, 482.3% for AGIs $75k-100k, 709.0% for AGIs $100k-200k, 3932.4% for AGIs over 200k)
Taxable individual retirement arrangement distribution: $25,659 (reported on 7.8% of returns)
91737:
$25,659
California:
$23,505
(% of AGI for various income ranges: 44.7% for AGIs below $25k, 100.5% for AGIs $25k-50k, 272.1% for AGIs $50k-75k, 408.6% for AGIs $75k-100k, 742.5% for AGIs $100k-200k, 1844.3% for AGIs over 200k)
Self-employed (Keogh) retirement plans: $34,877 (reported on 1.1% of returns)
91737:
$34,877
California:
$30,163
(% of AGI for various income ranges: 43.6% for AGIs $100k-200k, 1077.0% for AGIs over 200k)
Total itemized deductions: $36,988 (reported on 23.8% of returns)
Here:
$36,988
State:
$39,517
(% of AGI for various income ranges: 122.2% for AGIs below $25k, 270.0% for AGIs $25k-50k, 808.0% for AGIs $50k-75k, 1538.3% for AGIs $75k-100k, 2788.2% for AGIs $100k-200k, 12152.2% for AGIs over 200k)
Charity contributions: $8,445 (reported on 20.7% of returns)
Here:
$8,445
State:
$12,598
(% of AGI for various income ranges: 6.3% for AGIs below $25k, 24.3% for AGIs $25k-50k, 102.6% for AGIs $50k-75k, 224.7% for AGIs $75k-100k, 502.5% for AGIs $100k-200k, 3096.5% for AGIs over 200k)
Taxes paid: $9,037 (reported on 23.8% of returns)
91737:
$9,037
State:
$8,807
(% of AGI for various income ranges: 27.4% for AGIs below $25k, 60.7% for AGIs $25k-50k, 215.4% for AGIs $50k-75k, 448.4% for AGIs $75k-100k, 814.4% for AGIs $100k-200k, 2382.7% for AGIs over 200k)
Earned income credit: $1,958 (reported on 11.1% of returns)
Here:
$1,958
State:
$2,074
(% of AGI for various income ranges: 69.2% for AGIs below $25k, 67.3% for AGIs $25k-50k)
Percentage of individuals using paid preparers for their 2020 taxes: 93.1%
Here:
93%
State:
92%
(% for various income ranges: 91.8% for AGIs below $25k, 93.1% for AGIs $25k-50k, 93.2% for AGIs $50k-75k, 92.7% for AGIs $75k-100k, 93.6% for AGIs $100k-200k, 95.5% for AGIs over 200k)
Averages for the 2012 tax year for zip code 91737, filed in 2013:
Average Adjusted Gross Income (AGI) in 2012: $84,048 (Individual Income Tax Returns)
Here:
$84,048
State:
$72,726
Salary/wage: $67,897 (reported on 84.0% of returns)
Here:
$67,897
State:
$59,079
(% of AGI for various income ranges: 77.7% for AGIs below $25k, 76.3% for AGIs $25k-50k, 77.9% for AGIs $50k-75k, 77.2% for AGIs $75k-100k, 78.4% for AGIs $100k-200k, 49.8% for AGIs over 200k)
Taxable interest for individuals: $1,523 (reported on 44.9% of returns)
This zip code:
$1,523
California:
$2,146
(% of AGI for various income ranges: 1.2% for AGIs below $25k, 0.8% for AGIs $25k-50k, 0.7% for AGIs $50k-75k, 0.7% for AGIs $75k-100k, 0.6% for AGIs $100k-200k, 1.1% for AGIs over 200k)
Ordinary dividends: $5,056 (reported on 20.1% of returns)
Here:
$5,056
State:
$9,308
(% of AGI for various income ranges: 1.1% for AGIs below $25k, 0.9% for AGIs $25k-50k, 0.5% for AGIs $50k-75k, 0.6% for AGIs $75k-100k, 0.9% for AGIs $100k-200k, 2.0% for AGIs over 200k)
Net capital gain/loss in AGI: +$23,453 (reported on 17.9% of returns)
Here:
+$23,453
State:
+$30,460
(% of AGI for various income ranges: 0.5% for AGIs $75k-100k, 0.6% for AGIs $100k-200k, 13.5% for AGIs over 200k)
Profit/loss from business: +$18,156 (reported on 19.0% of returns)
Here:
+$18,156
State:
+$17,064
(% of AGI for various income ranges: 10.8% for AGIs below $25k, 6.4% for AGIs $25k-50k, 4.7% for AGIs $50k-75k, 3.9% for AGIs $75k-100k, 3.2% for AGIs $100k-200k, 3.5% for AGIs over 200k)
Taxable individual retirement arrangement distribution: $18,370 (reported on 7.6% of returns)
91737:
$18,370
California:
$19,557
(% of AGI for various income ranges: 1.7% for AGIs below $25k, 2.6% for AGIs $25k-50k, 1.8% for AGIs $50k-75k, 2.2% for AGIs $75k-100k, 1.8% for AGIs $100k-200k, 1.1% for AGIs over 200k)
Self-employment retirement plans: $30,964 (reported on 1.3% of returns)
91737:
$30,964
California:
$24,530
(% of AGI for various income ranges: 0.3% for AGIs $25k-50k, 0.3% for AGIs $100k-200k, 1.0% for AGIs over 200k)
Total itemized deductions: $34,708 (25% of AGI, reported on 50.1% of returns)
Here:
$34,708
State:
$34,004
Here:
24.9% of AGI
State:
22.7% of AGI
(% of AGI for various income ranges: 14.8% for AGIs below $25k, 18.2% for AGIs $25k-50k, 22.2% for AGIs $50k-75k, 24.4% for AGIs $75k-100k, 23.2% for AGIs $100k-200k, 18.1% for AGIs over 200k)
Charity contributions: $4,421 (reported on 44.3% of returns)
Here:
$4,421
State:
$4,659
(% of AGI for various income ranges: 0.8% for AGIs below $25k, 1.8% for AGIs $25k-50k, 2.3% for AGIs $50k-75k, 2.7% for AGIs $75k-100k, 2.5% for AGIs $100k-200k, 2.3% for AGIs over 200k)
Taxes paid: $12,949 (reported on 50.0% of returns)
91737:
$12,949
State:
$14,448
(% of AGI for various income ranges: 3.4% for AGIs below $25k, 4.1% for AGIs $25k-50k, 5.6% for AGIs $50k-75k, 7.2% for AGIs $75k-100k, 8.2% for AGIs $100k-200k, 9.3% for AGIs over 200k)
Earned income credit: $1,945 (reported on 12.7% of returns)
Here:
$1,945
State:
$2,286
(% of AGI for various income ranges: 4.9% for AGIs below $25k, 1.0% for AGIs $25k-50k)
Percentage of individuals using paid preparers for their 2012 taxes: 65.3%
Here:
65%
State:
64%
(% for various income ranges: 54.3% for AGIs below $25k, 62.0% for AGIs $25k-50k, 67.8% for AGIs $50k-75k, 70.1% for AGIs $75k-100k, 75.7% for AGIs $100k-200k, 83.1% for AGIs over 200k)
Averages for the 2004 tax year for zip code 91737, filed in 2005:
Average Adjusted Gross Income (AGI) in 2004: $73,228 (Individual Income Tax Returns)
Here:
$73,228
State:
$58,600
Salary/wage: $62,893 (reported on 86.9% of returns)
Here:
$62,893
State:
$49,455
(% of AGI for various income ranges: 245.5% for AGIs below $10k, 79.7% for AGIs $10k-25k, 81.0% for AGIs $25k-50k, 82.7% for AGIs $50k-75k, 84.6% for AGIs $75k-100k, 68.5% for AGIs over 100k)
Taxable interest for individuals: $1,385 (reported on 54.4% of returns)
This zip code:
$1,385
California:
$2,365
(% of AGI for various income ranges: 9.5% for AGIs below $10k, 1.3% for AGIs $10k-25k, 1.1% for AGIs $25k-50k, 1.0% for AGIs $50k-75k, 0.7% for AGIs $75k-100k, 1.0% for AGIs over 100k)
Taxable dividends: $2,023 (reported on 24.0% of returns)
Here:
$2,023
State:
$4,746
(% of AGI for various income ranges: 5.0% for AGIs below $10k, 1.1% for AGIs $10k-25k, 0.6% for AGIs $25k-50k, 0.5% for AGIs $50k-75k, 0.4% for AGIs $75k-100k, 0.7% for AGIs over 100k)
Net capital gain/loss: +$16,517 (reported on 21.5% of returns)
Here:
+$16,517
State:
+$23,418
(% of AGI for various income ranges: -4.1% for AGIs below $10k, -0.1% for AGIs $10k-25k, 0.6% for AGIs $25k-50k, 1.2% for AGIs $50k-75k, 1.0% for AGIs $75k-100k, 7.4% for AGIs over 100k)
Profit/loss from business: +$20,602 (reported on 20.1% of returns)
Here:
+$20,602
State:
+$16,826
(% of AGI for various income ranges: 15.3% for AGIs below $10k, 9.6% for AGIs $10k-25k, 7.5% for AGIs $25k-50k, 5.6% for AGIs $50k-75k, 5.2% for AGIs $75k-100k, 5.2% for AGIs over 100k)
IRA payment deduction: $3,583 (reported on 3.3% of returns)
91737:
$3,583
California:
$3,192
(% of AGI for various income ranges: 0.3% for AGIs $10k-25k, 0.3% for AGIs $25k-50k, 0.2% for AGIs $50k-75k, 0.2% for AGIs $75k-100k, 0.1% for AGIs over 100k)
Self-employed pension: $20,000 (reported on 1.7% of returns)
Here:
$20,000
California:
$17,688
(% of AGI for various income ranges: 0.1% for AGIs $25k-50k, 0.2% for AGIs $50k-75k, 0.2% for AGIs $75k-100k, 0.7% for AGIs over 100k)
Total itemized deductions: $30,461 (27% of AGI, reported on 56.3% of returns)
Here:
$30,461
State:
$28,113
Here:
26.7% of AGI
State:
25.3% of AGI
(% of AGI for various income ranges: 40.6% for AGIs below $10k, 18.2% for AGIs $10k-25k, 25.2% for AGIs $25k-50k, 28.8% for AGIs $50k-75k, 29.0% for AGIs $75k-100k, 21.1% for AGIs over 100k)
Charity contributions deductions: $3,812 (3% of AGI, reported on 51.9% of returns)
Here:
$3,812
State:
$3,923
Here:
3.2% of AGI
State:
3.3% of AGI
(% of AGI for various income ranges: 1.3% for AGIs below $10k, 1.5% for AGIs $10k-25k, 2.5% for AGIs $25k-50k, 3.0% for AGIs $50k-75k, 3.1% for AGIs $75k-100k, 2.7% for AGIs over 100k)
Total tax: $12,276 (reported on 82.2% of returns)
91737:
$12,276
State:
$10,761
(% of AGI for various income ranges: 10.1% for AGIs below $10k, 5.2% for AGIs $10k-25k, 6.9% for AGIs $25k-50k, 8.0% for AGIs $50k-75k, 8.7% for AGIs $75k-100k, 17.6% for AGIs over 100k)
Earned income credit: $1,599 (reported on 9.1% of returns)
Here:
$1,599
State:
$1,763
Percentage of individuals using paid preparers for their 2004 taxes: 67.4%
Here:
67%
State:
66%
(% for various income ranges: 53.1% for AGIs below $10k, 60.2% for AGIs $10k-25k, 68.3% for AGIs $25k-50k, 71.9% for AGIs $50k-75k, 72.2% for AGIs $75k-100k, 77.5% for AGIs over 100k)
Likely homosexual households (counted as self-reported same-sex unmarried-partner households)
Lesbian couples: 0.0% of all households
Gay men: 0.4% of all households
Household received Food Stamps/SNAP in the past 12 months: 729 Household did not receive Food Stamps/SNAP in the past 12 months: 7,248
Women who had a birth in the past 12 months: 320 (270 now married, 49 unmarried) Women who did not have a birth in the past 12 months: 4,717 (2,305 now married, 2,393 unmarried)
Housing units in zip code 91737 with a mortgage: 4,188 (416 second mortgage, 17 home equity loan, 311 both second mortgage and home equity loan) Houses without a mortgage: 65
Median monthly owner costs for units with a mortgage: $2,942 Median monthly owner costs for units without a mortgage: $853
Residents with income below the poverty level in 2022:
This zip code:
8.4%
Whole state:
12.2%
Residents with income below 50% of the poverty level in 2022:
This zip code:
5.0%
Whole state:
6.2%
Median number of rooms in houses and condos:
Here:
7.0
State:
6.0
Median number of rooms in apartments:
Here:
4.3
State:
3.9
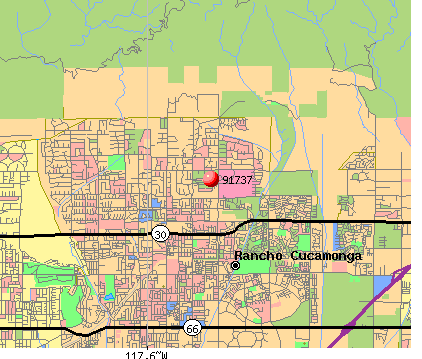
Notable locations in this zip code not listed on our city pages
Notable locations in zip code 91737: Rancho Cucamonga Fire Protection District Station 175 (A), Rancho Cucamonga Fire Protection District Station 171 (B), Wargin Hall (C), Earl Sicosky Gymnasium (D). Display/hide their locations on the map
3,599 married couples with children.
800 single-parent households (269 men, 531 women).
74.1% of residents of 91737 zip code speak English at home.
14.1% of residents speak Spanish at home (78% very well, 12% well, 8% not well, 3% not at all).
2.9% of residents speak other Indo-European language at home (71% very well, 24% well, 3% not well, 1% not at all).
7.5% of residents speak Asian or Pacific Island language at home (50% very well, 26% well, 18% not well, 6% not at all).
1.1% of residents speak other language at home (57% very well, 38% well, 2% not well, 3% not at all).
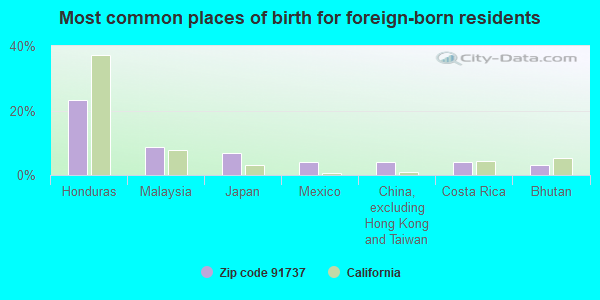
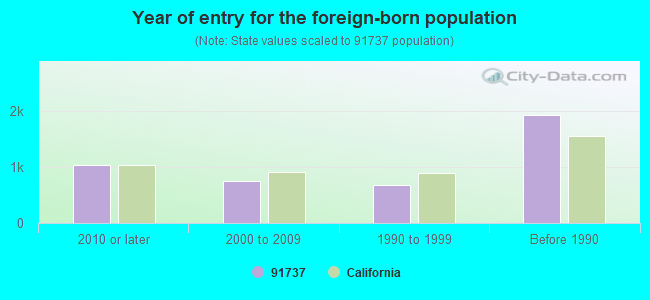
Foreign born population: 4,172 (18.2%) (63.1% of them are naturalized citizens)
This zip code:
18.2%
Whole state:
26.7%
23%Honduras
9%Malaysia
7%Japan
4%Mexico
4%China, excluding Hong Kong and Taiwan
4%Costa Rica
3%Bhutan
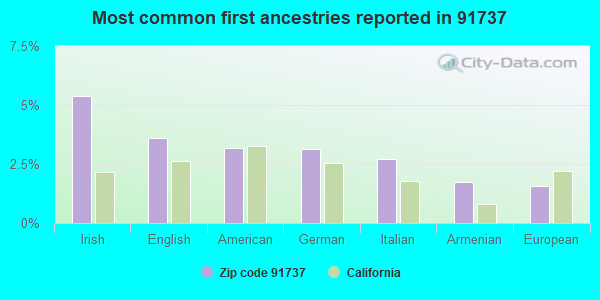
5%Irish
4%English
3%American
3%German
3%Italian
2%Armenian
2%European
Year of entry for the foreign-born population
1,0352010 or later
7542000 to 2009
6821990 to 1999
1,929Before 1990
Facilities with environmental interests located in this zip code:
HERMOSA ELEMENTARY (10133 WILSON AVE. in ALTA LOMA, CA)
(National Center for Education Statistics) - STATE ID-6104475 Organizations: ALTA LOMA ELEMENTARY (SCHOOL DISTRICT)
LOS OSOS HIGH (6001 MILLIKEN AVE. in RANCHO CUCAMONGA, CA)
(National Center for Education Statistics) - STATE ID-3631058 Organizations: CHAFFEY JOINT UNION HIGH (SCHOOL DISTRICT)
BANYAN ELEMENTARY (10900 MIRADOR DR. in ALTA LOMA, CA)
(National Center for Education Statistics) - STATE ID-6114649 Organizations: ALTA LOMA ELEMENTARY (SCHOOL DISTRICT)
CHAFFEY COLLEGE (5885 HAVEN AVE. in RANCHO CUCAMONGA, CA)
HAZARDOUS WASTE BIENNIAL REPORTER (Resource Conservation and Recovery Act (tracking hazardous waste)) Large Quantity Generators, more that 1000 kg of hazardous waste/month (Resource Conservation and Recovery Act (tracking hazardous waste))
CHAFFEY PLAZA CLEANERS (10451 LEMON AVE STE C in RANCHO CUCAMONGA, CA)
Small Quantity Generators, between 100 kg and 1000 kg of hazardous waste/month (Resource Conservation and Recovery Act (tracking hazardous waste)) - notification Organizations: SUSAN TURNER (CONTACT/OWNER)
Housing units lacking complete plumbing facilities: 0.8% Housing units lacking complete kitchen facilities: 1.0%
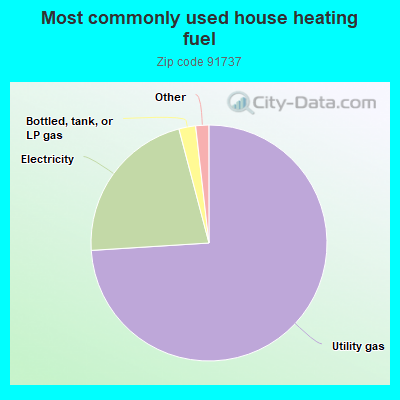
74.0%Utility gas
21.9%Electricity
2.3%Bottled, tank, or LP gas
0.7%Other fuel
0.6%Solar energy
Population in 1990: 19,708. Population change in the 1990s: +3,367 (+17.1%).
Place of birth for U.S.-born residents:
This state: 14,771
Northeast: 1,085
Midwest: 1,064
South: 1,149
West: 424
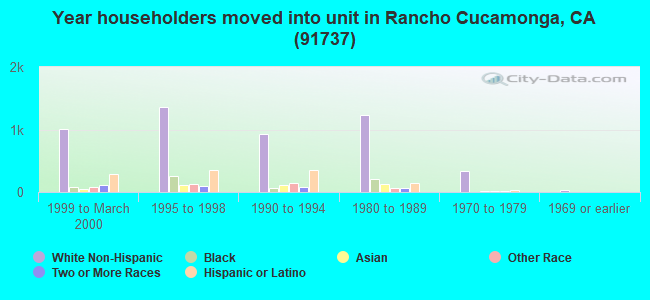
58% of the 91737 zip code residents lived in the same house 5 years ago. Out of people who lived in different houses, 63% lived in this county. Out of people who lived in different counties, 50% lived in California.
93% of the 91737 zip code residents lived in the same house 1 year ago. Out of people who lived in different houses, 52% moved from this county. Out of people who lived in different houses, 34% moved from different county within same state. Out of people who lived in different houses, 12% moved from different state. Out of people who lived in different houses, 4% moved from abroad.
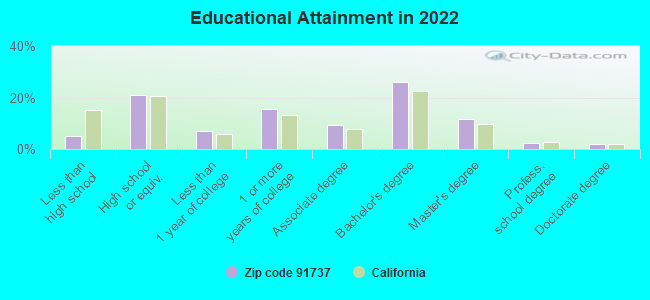
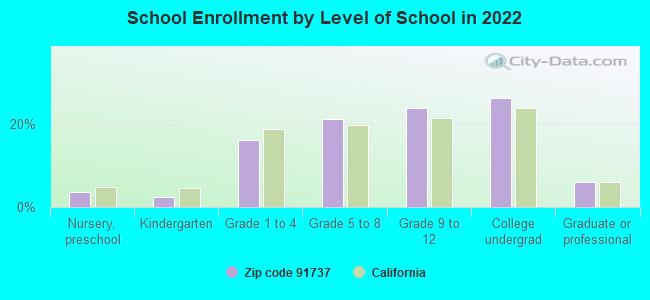
Private vs. public school enrollment:
Students in private schools in grades 1 to 8 (elementary and middle school): 358
Here:
16.2%
California:
10.5%
Students in private schools in grades 9 to 12 (high school): 116
Here:
8.3%
California:
8.5%
Students in private undergraduate colleges: 245
Here:
15.8%
California:
15.9%
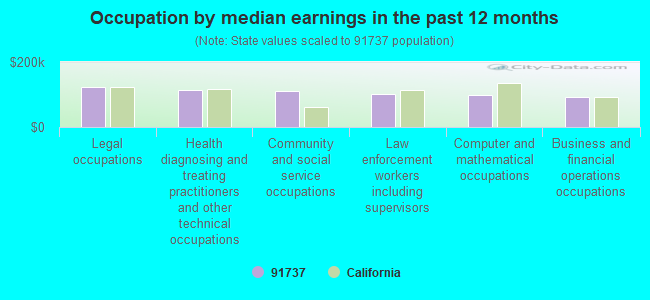
Occupation by median earnings in the past 12 months ($)
121,829Legal occupations
112,601Health diagnosing and treating practitioners and other technical occupations
110,000Community and social service occupations
99,974Law enforcement workers including supervisors
98,742Computer and mathematical occupations
92,617Business and financial operations occupations
Companies with federal contracts located in this zip code:
PRIMETEC A C , INC (9340 7TH STREET SUITE I in RANCHO CUCAMON, CA; small business) : $413,960 in 5 contractsfrom 2001 to 2003
Contracts for Trash/Garbage Collection Services - Including Portable Sanitation Services by Navy Signed by year:2000: $0; 2001: $171,660; 2002: $77,940; 2003: $164,360; 2004: $0; 2005: $0; 2006: $0.
Biggest contracts:
$171,660 with Navy for Trash/Garbage Collection Services - Including Portable Sanitation Services. Signed on 2001-10-03. Completion date: 2002-09-30.
$134,960, same as above.Signed on 2003-08-27. Completion date: 2004-08-31.
$77,940, same as above.Signed on 2002-10-04. Completion date: 2003-08-31.
$29,400, same as above.Signed on 2003-06-26. Completion date: 2003-08-31.
QUALITY FOAM SERVICE (9766 19TH ST # 114 in ALTA LOMA, CA; small business) : $132,563 in 3 contractsfrom 2005 to 2006
$69,354 with Navy for Maintenance, Repair and Rebuilding of Equipment -- Fire Fighting, Rescue, and Safety Equipment; and Environmental Protection Equipment and Materials. Signed on 2005-02-25. Completion date: 2006-02-24.
$32,705 with Air Force for Maintenance, Repair and Rebuilding of Equipment -- Water Purification and Sewage Treatment Equipment. Taking place in AZ. Signed on 2005-07-27. Completion date: 2005-08-26.
$30,504 with Navy for Maintenance, Repair and Rebuilding of Equipment -- Fire Fighting, Rescue, and Safety Equipment; and Environmental Protection Equipment and Materials. Signed on 2006-02-22. Completion date: 2007-02-24.
A M H INC (10335 ALMOND ST in RANCHO CUCAMON, CA; small business) : $93,320 in 5 contractsfrom 2003 to 2005
Contracts for Building Components, Prefabricated, Fencing, Fences, Gates and Components, Installation of Equipment -- Weapons, Cabinets, Lockers, Bins, and Shelving by Army, Department of Defense Signed by year:2000: $0; 2001: $0; 2002: $0; 2003: $47,495; 2004: $31,250; 2005: $14,575; 2006: $0.
Biggest contracts:
$31,250 with Army for Building Components, Prefabricated. Signed on 2004-03-09. Completion date: 2004-04-30.
$29,445 with Army for Fencing, Fences, Gates and Components. Signed on 2003-10-01. Completion date: 2003-11-30.
$14,575 with Army for Installation of Equipment -- Weapons. Signed on 2005-09-15. Completion date: 2005-10-17.
$13,230 with Department of Defense for Cabinets, Lockers, Bins, and Shelving. Signed on 2003-05-19. Completion date: 2003-06-27.
Top industries in this zip code by the number of employees in 2005:
2005 - 2018 National Fire Incident Reporting System (NFIRS) incidents
According to the data from the years 2005 - 2018 the average number of fires per year is 24. The highest number of fires - 60 took place in 2011, and the least - 0 in 2007. The data has an increasing trend.
When looking into fire subcategories, the most incidents belonged to: Outside Fires (37.2%), and Structure Fires (31.2%).
Fire incident types reported to NFIRS in Zip Code 91737


 Nearest zip codes: 91701, 91730, 91739, 91784, 91764, 91786.


 According to the data from the years 2005 - 2018 the average number of fires per year is 24. The highest number of fires - 60 took place in 2011, and the least - 0 in 2007. The data has an increasing trend.
 When looking into fire subcategories, the most incidents belonged to: Outside Fires (37.2%), and Structure Fires (31.2%).