Estimated zip code population in 2022: 29,184 Zip code population in 2010: 30,485 Zip code population in 2000: 30,795
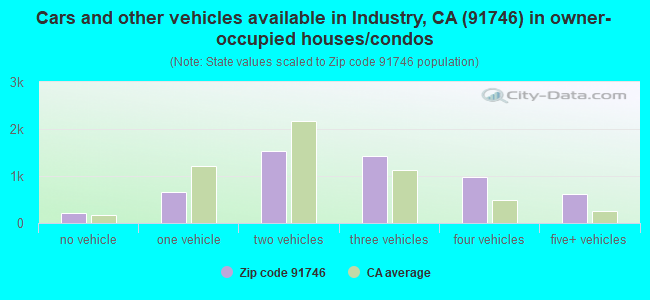
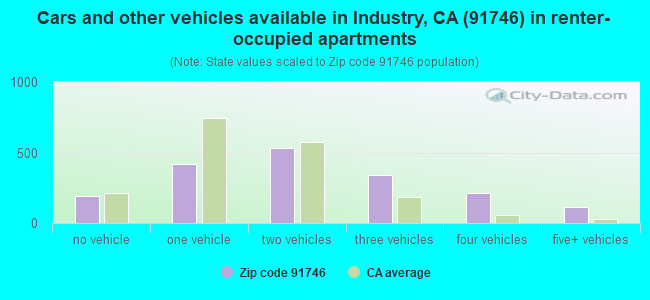
Houses and condos: 7,492 Renter-occupied apartments: 1,810
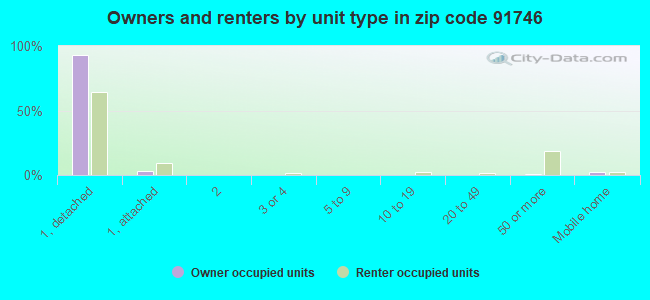
% of renters here:
25%
State:
44%
March 2022 cost of living index in zip code 91746: 132.8 (high, U.S. average is 100)
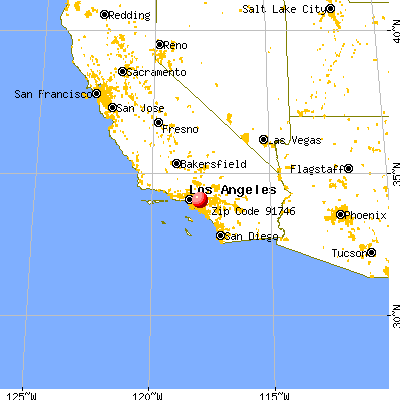
Land area: 5.6 sq. mi. Water area: 0.2 sq. mi.
Population density: 5,240 people per square mile
(average).
OSM Map
General Map
Google Map
MSN Map
OSM Map
General Map
Google Map
MSN Map
OSM Map
General Map
Google Map
MSN Map
OSM Map
General Map
Google Map
MSN Map
Please wait while loading the map...
Real estate property taxes paid for housing units in 2022:
This zip code:
0.5% ($3,558)
California:
0.7% ($4,831)
Median real estate property taxes paid for housing units with mortgages in 2022: $4,166 (0.6%) Median real estate property taxes paid for housing units with no mortgage in 2022: $2,699 (0.4%)
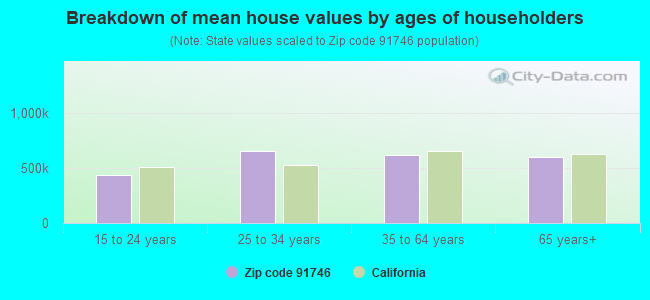
Estimated median house/condo value in 2022: $646,949
91746:
$646,949
California:
$715,900
According to our research of California and other state lists, there were 17 registered sex offenders living in 91746 zip code as of April 19, 2024. The ratio of all residents to sex offenders in zip code 91746 is 1,869 to 1. The ratio of registered sex offenders to all residents in this zip code is much lower than the state average.
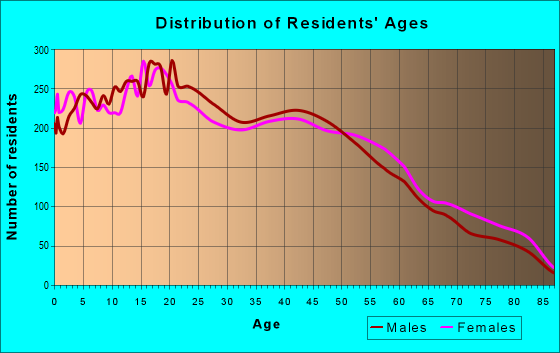
Median resident age:
This zip code:
39.4 years
California median age:
37.9 years
Average household size:
This zip code:
4.0 people
California:
2.8 people
Averages for the 2020 tax year for zip code 91746, filed in 2021:
Average Adjusted Gross Income (AGI) in 2020: $47,037 (Individual Income Tax Returns)
Here:
$47,037
State:
$95,910
Salary/wage: $43,191 (reported on 83.0% of returns)
Here:
$43,191
State:
$77,331
(% of AGI for various income ranges: 1240.4% for AGIs below $25k, 4029.0% for AGIs $25k-50k, 7488.8% for AGIs $50k-75k, 11120.4% for AGIs $75k-100k, 20138.3% for AGIs $100k-200k, 92996.7% for AGIs over 200k)
Taxable interest for individuals: $1,267 (reported on 22.7% of returns)
This zip code:
$1,267
California:
$2,294
(% of AGI for various income ranges: 7.1% for AGIs below $25k, 6.1% for AGIs $25k-50k, 12.1% for AGIs $50k-75k, 33.0% for AGIs $75k-100k, 48.1% for AGIs $100k-200k, 10306.7% for AGIs over 200k)
Ordinary dividends: $2,299 (reported on 5.2% of returns)
Here:
$2,299
State:
$10,949
(% of AGI for various income ranges: 4.2% for AGIs below $25k, 3.7% for AGIs $25k-50k, 9.8% for AGIs $50k-75k, 26.4% for AGIs $75k-100k, 45.2% for AGIs $100k-200k, 2903.3% for AGIs over 200k)
Net capital gain/loss in AGI: +$27,555 (reported on 7.2% of returns)
Here:
+$27,555
State:
+$49,306
(% of AGI for various income ranges: 2.4% for AGIs $25k-50k, 12.0% for AGIs $50k-75k, 47.0% for AGIs $75k-100k, 325.5% for AGIs $100k-200k, 89943.3% for AGIs over 200k)
Profit/loss from business: +$8,423 (reported on 17.2% of returns)
Here:
+$8,423
State:
+$15,671
(% of AGI for various income ranges: 232.5% for AGIs below $25k, 181.6% for AGIs $25k-50k, 118.5% for AGIs $50k-75k, 179.6% for AGIs $75k-100k, 336.9% for AGIs $100k-200k, 5190.0% for AGIs over 200k)
Taxable individual retirement arrangement distribution: $11,463 (reported on 2.6% of returns)
91746:
$11,463
California:
$23,505
(% of AGI for various income ranges: 20.8% for AGIs below $25k, 18.8% for AGIs $25k-50k, 54.0% for AGIs $50k-75k, 92.6% for AGIs $75k-100k, 237.4% for AGIs $100k-200k)
Total itemized deductions: $32,179 (reported on 9.1% of returns)
Here:
$32,179
State:
$39,517
(% of AGI for various income ranges: 58.3% for AGIs below $25k, 163.2% for AGIs $25k-50k, 468.0% for AGIs $50k-75k, 1033.6% for AGIs $75k-100k, 2018.4% for AGIs $100k-200k, 30080.0% for AGIs over 200k)
Charity contributions: $6,960 (reported on 7.3% of returns)
Here:
$6,960
State:
$12,598
(% of AGI for various income ranges: 2.2% for AGIs below $25k, 16.3% for AGIs $25k-50k, 50.2% for AGIs $50k-75k, 120.5% for AGIs $75k-100k, 280.2% for AGIs $100k-200k, 12040.0% for AGIs over 200k)
Taxes paid: $8,335 (reported on 9.1% of returns)
91746:
$8,335
State:
$8,807
(% of AGI for various income ranges: 13.8% for AGIs below $25k, 48.9% for AGIs $25k-50k, 145.1% for AGIs $50k-75k, 330.0% for AGIs $75k-100k, 648.6% for AGIs $100k-200k, 1923.3% for AGIs over 200k)
Earned income credit: $2,114 (reported on 20.5% of returns)
Here:
$2,114
State:
$2,074
(% of AGI for various income ranges: 100.9% for AGIs below $25k, 78.5% for AGIs $25k-50k, 1.3% for AGIs $50k-75k)
Percentage of individuals using paid preparers for their 2020 taxes: 90.6%
Here:
91%
State:
92%
(% for various income ranges: 89.3% for AGIs below $25k, 91.6% for AGIs $25k-50k, 90.6% for AGIs $50k-75k, 91.0% for AGIs $75k-100k, 91.6% for AGIs $100k-200k, 100.0% for AGIs over 200k)
Averages for the 2012 tax year for zip code 91746, filed in 2013:
Average Adjusted Gross Income (AGI) in 2012: $36,474 (Individual Income Tax Returns)
Here:
$36,474
State:
$72,726
Salary/wage: $34,357 (reported on 85.2% of returns)
Here:
$34,357
State:
$59,079
(% of AGI for various income ranges: 75.3% for AGIs below $25k, 87.4% for AGIs $25k-50k, 88.1% for AGIs $50k-75k, 86.8% for AGIs $75k-100k, 83.2% for AGIs $100k-200k, 32.2% for AGIs over 200k)
Taxable interest for individuals: $719 (reported on 21.6% of returns)
This zip code:
$719
California:
$2,146
(% of AGI for various income ranges: 0.3% for AGIs below $25k, 0.2% for AGIs $25k-50k, 0.2% for AGIs $50k-75k, 0.2% for AGIs $75k-100k, 0.4% for AGIs $100k-200k, 2.7% for AGIs over 200k)
Ordinary dividends: $1,825 (reported on 4.1% of returns)
Here:
$1,825
State:
$9,308
(% of AGI for various income ranges: 0.1% for AGIs below $25k, 0.2% for AGIs $50k-75k, 0.1% for AGIs $75k-100k, 0.8% for AGIs $100k-200k)
Net capital gain/loss in AGI: +$3,534 (reported on 2.7% of returns)
Here:
+$3,534
State:
+$30,460
(% of AGI for various income ranges: 0.3% for AGIs $100k-200k, 3.1% for AGIs over 200k)
Profit/loss from business: +$9,240 (reported on 16.6% of returns)
Here:
+$9,240
State:
+$17,064
(% of AGI for various income ranges: 14.0% for AGIs below $25k, 4.1% for AGIs $25k-50k, 1.3% for AGIs $50k-75k, 1.1% for AGIs $75k-100k, 0.8% for AGIs $100k-200k)
Taxable individual retirement arrangement distribution: $10,788 (reported on 3.1% of returns)
91746:
$10,788
California:
$19,557
(% of AGI for various income ranges: 1.0% for AGIs below $25k, 0.5% for AGIs $25k-50k, 0.8% for AGIs $50k-75k, 1.2% for AGIs $75k-100k, 2.0% for AGIs $100k-200k)
Total itemized deductions: $22,728 (33% of AGI, reported on 26.2% of returns)
Here:
$22,728
State:
$34,004
Here:
32.8% of AGI
State:
22.7% of AGI
(% of AGI for various income ranges: 9.0% for AGIs below $25k, 14.0% for AGIs $25k-50k, 19.0% for AGIs $50k-75k, 19.7% for AGIs $75k-100k, 19.9% for AGIs $100k-200k, 23.6% for AGIs over 200k)
Charity contributions: $2,201 (reported on 19.5% of returns)
Here:
$2,201
State:
$4,659
(% of AGI for various income ranges: 0.3% for AGIs below $25k, 0.9% for AGIs $25k-50k, 1.4% for AGIs $50k-75k, 1.6% for AGIs $75k-100k, 1.8% for AGIs $100k-200k, 1.8% for AGIs over 200k)
Taxes paid: $7,254 (reported on 26.2% of returns)
91746:
$7,254
State:
$14,448
(% of AGI for various income ranges: 1.7% for AGIs below $25k, 3.1% for AGIs $25k-50k, 5.0% for AGIs $50k-75k, 5.8% for AGIs $75k-100k, 6.8% for AGIs $100k-200k, 17.5% for AGIs over 200k)
Earned income credit: $2,402 (reported on 29.1% of returns)
Here:
$2,402
State:
$2,286
(% of AGI for various income ranges: 8.2% for AGIs below $25k, 1.5% for AGIs $25k-50k)
Percentage of individuals using paid preparers for their 2012 taxes: 75.8%
Here:
76%
State:
64%
(% for various income ranges: 73.1% for AGIs below $25k, 78.0% for AGIs $25k-50k, 79.4% for AGIs $50k-75k, 79.4% for AGIs $75k-100k, 77.6% for AGIs $100k-200k, 80.0% for AGIs over 200k)
Averages for the 2004 tax year for zip code 91746, filed in 2005:
Average Adjusted Gross Income (AGI) in 2004: $33,917 (Individual Income Tax Returns)
Here:
$33,917
State:
$58,600
Salary/wage: $30,617 (reported on 88.3% of returns)
Here:
$30,617
State:
$49,455
(% of AGI for various income ranges: 87.5% for AGIs below $10k, 84.1% for AGIs $10k-25k, 90.2% for AGIs $25k-50k, 91.0% for AGIs $50k-75k, 88.2% for AGIs $75k-100k, 39.0% for AGIs over 100k)
Taxable interest for individuals: $806 (reported on 28.3% of returns)
This zip code:
$806
California:
$2,365
(% of AGI for various income ranges: 2.0% for AGIs below $10k, 0.5% for AGIs $10k-25k, 0.4% for AGIs $25k-50k, 0.3% for AGIs $50k-75k, 0.8% for AGIs $75k-100k, 1.4% for AGIs over 100k)
Taxable dividends: $1,142 (reported on 5.5% of returns)
Here:
$1,142
State:
$4,746
(% of AGI for various income ranges: 0.4% for AGIs below $10k, 0.2% for AGIs $10k-25k, 0.1% for AGIs $25k-50k, 0.2% for AGIs $50k-75k, 0.2% for AGIs $75k-100k, 0.3% for AGIs over 100k)
Net capital gain/loss: +$9,445 (reported on 4.4% of returns)
Here:
+$9,445
State:
+$23,418
(% of AGI for various income ranges: -0.2% for AGIs below $10k, -0.0% for AGIs $10k-25k, 0.1% for AGIs $25k-50k, 0.4% for AGIs $50k-75k, 1.0% for AGIs $75k-100k, 5.6% for AGIs over 100k)
Profit/loss from business: +$9,294 (reported on 14.7% of returns)
Here:
+$9,294
State:
+$16,826
(% of AGI for various income ranges: 14.2% for AGIs below $10k, 8.8% for AGIs $10k-25k, 4.1% for AGIs $25k-50k, 1.4% for AGIs $50k-75k, 2.2% for AGIs $75k-100k, 1.8% for AGIs over 100k)
IRA payment deduction: $2,522 (reported on 1.2% of returns)
91746:
$2,522
California:
$3,192
(% of AGI for various income ranges: 0.1% for AGIs $10k-25k, 0.1% for AGIs $25k-50k, 0.1% for AGIs $50k-75k, 0.1% for AGIs $75k-100k, 0.1% for AGIs over 100k)
Total itemized deductions: $19,472 (31% of AGI, reported on 31.2% of returns)
Here:
$19,472
State:
$28,113
Here:
31.4% of AGI
State:
25.3% of AGI
(% of AGI for various income ranges: 8.0% for AGIs below $10k, 11.1% for AGIs $10k-25k, 18.6% for AGIs $25k-50k, 22.9% for AGIs $50k-75k, 22.8% for AGIs $75k-100k, 16.5% for AGIs over 100k)
Charity contributions deductions: $2,279 (3% of AGI, reported on 26.1% of returns)
Here:
$2,279
State:
$3,923
Here:
3.4% of AGI
State:
3.3% of AGI
(% of AGI for various income ranges: 0.3% for AGIs below $10k, 0.6% for AGIs $10k-25k, 1.5% for AGIs $25k-50k, 2.3% for AGIs $50k-75k, 2.5% for AGIs $75k-100k, 2.5% for AGIs over 100k)
Total tax: $4,435 (reported on 63.5% of returns)
91746:
$4,435
State:
$10,761
(% of AGI for various income ranges: 3.9% for AGIs below $10k, 3.4% for AGIs $10k-25k, 4.8% for AGIs $25k-50k, 6.3% for AGIs $50k-75k, 8.3% for AGIs $75k-100k, 22.0% for AGIs over 100k)
Earned income credit: $1,908 (reported on 27.1% of returns)
Here:
$1,908
State:
$1,763
Percentage of individuals using paid preparers for their 2004 taxes: 76.7%
Here:
77%
State:
66%
(% for various income ranges: 70.1% for AGIs below $10k, 78.0% for AGIs $10k-25k, 78.4% for AGIs $25k-50k, 78.5% for AGIs $50k-75k, 75.4% for AGIs $75k-100k, 78.6% for AGIs over 100k)
Household received Food Stamps/SNAP in the past 12 months: 1,049 Household did not receive Food Stamps/SNAP in the past 12 months: 6,241
Women who had a birth in the past 12 months: 360 (223 now married, 138 unmarried) Women who did not have a birth in the past 12 months: 6,830 (2,295 now married, 4,553 unmarried)
Housing units in zip code 91746 with a mortgage: 3,682 (222 second mortgage, 6 home equity loan, 81 both second mortgage and home equity loan) Houses without a mortgage: 142
Median monthly owner costs for units with a mortgage: $2,222 Median monthly owner costs for units without a mortgage: $513
Residents with income below the poverty level in 2022:
This zip code:
11.8%
Whole state:
12.2%
Residents with income below 50% of the poverty level in 2022:
This zip code:
7.8%
Whole state:
6.2%
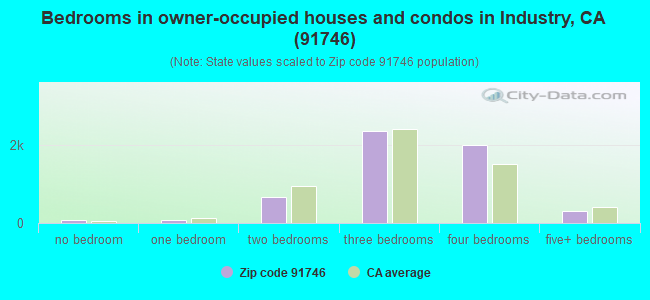
Median number of rooms in houses and condos:
Here:
5.9
State:
6.0
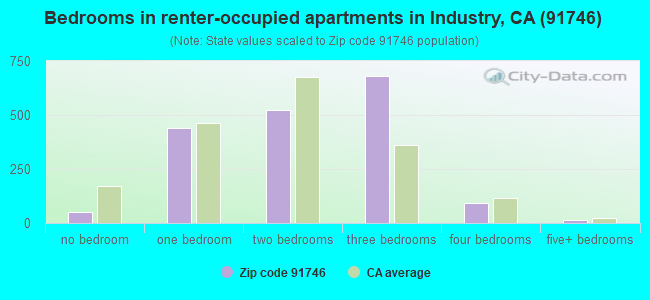
Median number of rooms in apartments:
Here:
4.5
State:
3.9
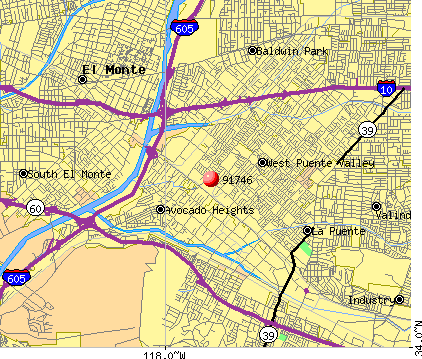
Notable locations in this zip code not listed on our city pages
Notable locations in zip code 91746: Vineland Drive-In (A), Sunkist Branch County of Los Angeles Public Library (B), Los Angeles County Fire Department Station 87 (C). Display/hide their locations on the map
Churches in zip code 91746 include: First Fundamental Bible Church (A), Saint Louis of France Church (B), Tri-City Southern Baptist Church (C). Display/hide their locations on the map
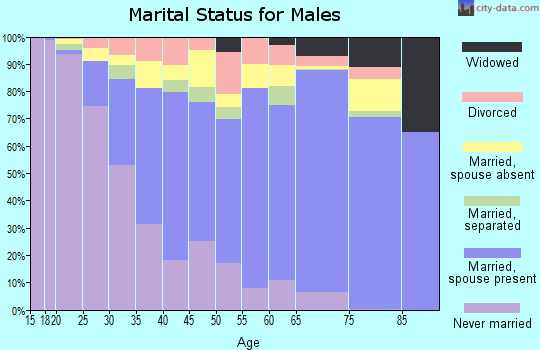
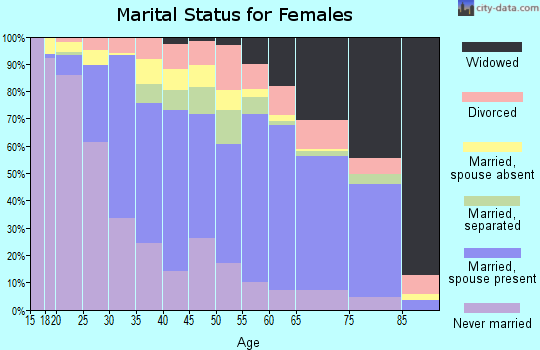
2,910 married couples with children.
926 single-parent households (137 men, 789 women).
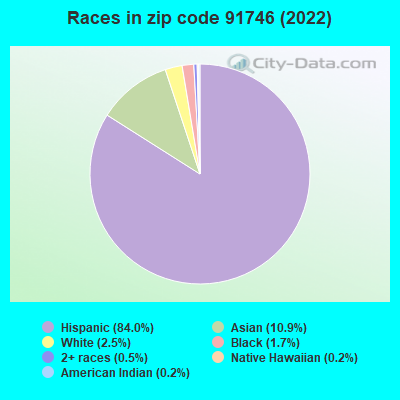
24.4% of residents of 91746 zip code speak English at home.
65.9% of residents speak Spanish at home (65% very well, 15% well, 14% not well, 7% not at all).
0.6% of residents speak other Indo-European language at home (67% very well, 29% well, 4% not well).
9.3% of residents speak Asian or Pacific Island language at home (43% very well, 26% well, 21% not well, 10% not at all).
0.1% of residents speak other language at home (62% very well, 38% not at all).
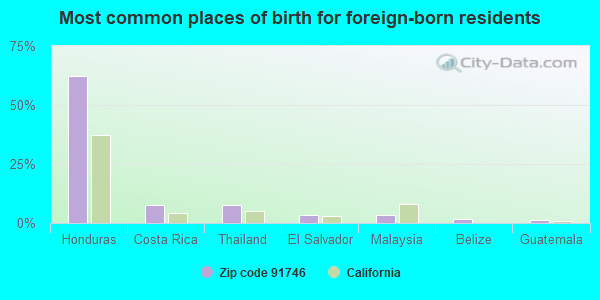
Foreign born population: 11,107 (38.1%) (58.9% of them are naturalized citizens)
This zip code:
38.1%
Whole state:
26.7%
62%Honduras
8%Costa Rica
8%Thailand
4%El Salvador
3%Malaysia
2%Belize
1%Guatemala
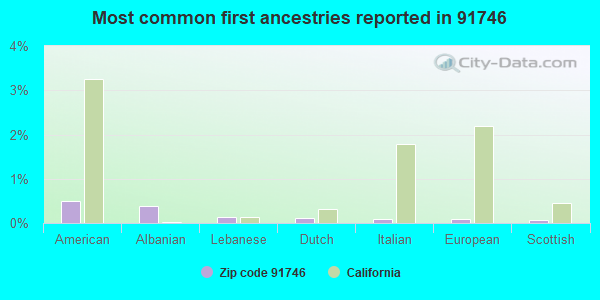
1%American
0%Albanian
0%Lebanese
0%Dutch
0%Italian
0%European
0%Scottish
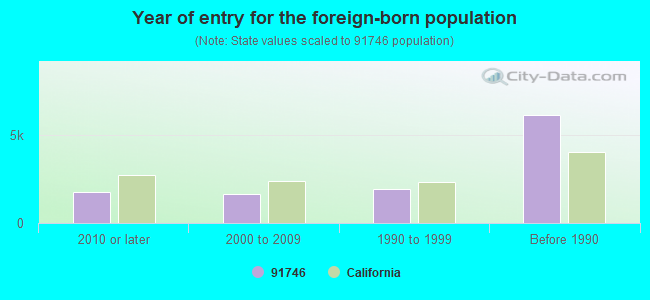
Year of entry for the foreign-born population
1,7662010 or later
1,6322000 to 2009
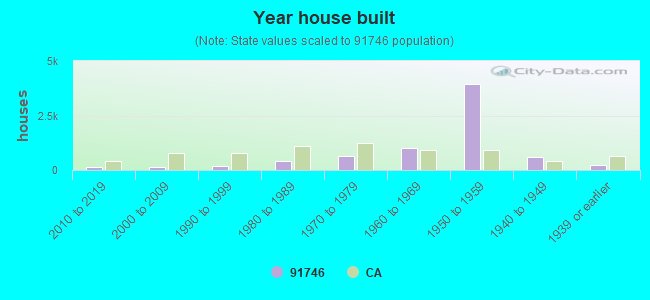
1,9461990 to 1999
6,106Before 1990
Major facilities with environmental interests located in this zip code:
HEARTLAND INDUSTRIES (425 SOUTH 9TH AVENUE in CITY OF INDUSTRY, CA)
AIR MAJOR (AIRS/AFS) SUPERFUND (Superfund database) STATE MASTER (California - Hazardous Waste Tracking) - HAZARDOU WASTE PROGRAM COMPLIANCE ACTIVITY (Tracking inspections of insecticide, fungicide, and rodenticide, and toxic substances) CRITERIA AND HAZARDOUS AIR POLLUTANT INVENTORY (Inventory of air pollution sources) HAZARDOUS WASTE BIENNIAL REPORTER (Resource Conservation and Recovery Act (tracking hazardous waste)) - ICIS-, ENFORCEMENT/COMPLIANCE ACTIVITY Large Quantity Generators, more that 1000 kg of hazardous waste/month (Resource Conservation and Recovery Act (tracking hazardous waste)) - ICIS-, ENFORCEMENT/COMPLIANCE ACTIVITY TRI REPORTER (Tracking of toxic chemicals releasing facilities) Business SIC classification: PERFUMES, COSMETICS, AND OTHER TOILET PREPARATIONS; LIQUEFIED PETROLEUM GAS (BOTTLED GAS) DEALERS Business NAICS classification: ALL OTHER BUSINESS SUPPORT SERVICES. Organizations: JAMES BODNAR (CONTACT/OPERATOR)
, OUTSOURCING SERVICES GROUP (CONTACT/OWNER)
Alternative names: AEROSOL SERVICES CO INC
MERCURY PLASTICS INCORPORATED (14849 SALT LAKE AVE in CITY OF INDUSTRY, CA)
AIR MAJOR (AIRS/AFS) STATE MASTER (California - Hazardous Waste Tracking) - HAZARDOU WASTE PROGRAM CRITERIA AND HAZARDOUS AIR POLLUTANT INVENTORY (Inventory of air pollution sources) Large Quantity Generators, more that 1000 kg of hazardous waste/month (Resource Conservation and Recovery Act (tracking hazardous waste)) - ICIS-, ENFORCEMENT/COMPLIANCE ACTIVITY TRI REPORTER (Tracking of toxic chemicals releasing facilities) Business SIC classification: PLASTICS, FOIL, AND COATED PAPER BAGS; UNSUPPORTED PLASTICS FILM AND SHEET Business NAICS classification: UNSUPPORTED PLASTICS BAG MANUFACTURING.
HOUSE OF PACKAGING INC (13170 EAST TEMPLE AVENUE in LA PUENTE, CA)
AIR MAJOR (AIRS/AFS) STATE MASTER (California - Hazardous Waste Tracking) - HAZARDOU WASTE PROGRAM CRITERIA AND HAZARDOUS AIR POLLUTANT INVENTORY (Inventory of air pollution sources) Small Quantity Generators, between 100 kg and 1000 kg of hazardous waste/month (Resource Conservation and Recovery Act (tracking hazardous waste)) - notification TRI REPORTER (Tracking of toxic chemicals releasing facilities) Business SIC classification: FOLDING PAPERBOARD BOXES, INCLUDING SANITARY; COMMERCIAL PRINTING, LITHOGRAPHIC Business NAICS classification: FOLDING PAPERBOARD BOX MANUFACTURING.; SETUP PAPERBOARD BOX MANUFACTURING. Organizations: COAST CARTON CORP (CONTACT/OWNER)
EXIDE TECHNOLGIES INCORPORATED (14500 NELSON AVENUE in CITY OF INDUSTRY, CA)
STATE MASTER (California - Hazardous Waste Tracking) - HAZARDOU WASTE PROGRAM CRITERIA AND HAZARDOUS AIR POLLUTANT INVENTORY (Inventory of air pollution sources) HAZARDOUS WASTE BIENNIAL REPORTER (Resource Conservation and Recovery Act (tracking hazardous waste)) Large Quantity Generators, more that 1000 kg of hazardous waste/month (Resource Conservation and Recovery Act (tracking hazardous waste)) - notification TRI REPORTER (Tracking of toxic chemicals releasing facilities) Business SIC classification: STORAGE BATTERIES Business NAICS classification: STORAGE BATTERY MANUFACTURING. Alternative names: EXIDE CORP., EXIDE TECHNOLOGIES, GNB TECHNOLOGIES
FLINT INK CORPORATION (13055 EAST TEMPLE AVENUE in CITY OF INDUSTRY, CA)
AIR MAJOR (AIRS/AFS) STATE MASTER (California - Hazardous Waste Tracking) - HAZARDOU WASTE PROGRAM Conditionally Exempt Small Quantity Generators, less than 100 kg/month of hazardous waste (Resource Conservation and Recovery Act (tracking hazardous waste)) TSD (Resource Conservation and Recovery Act (tracking hazardous waste)) TRI REPORTER (Tracking of toxic chemicals releasing facilities) Business SIC classification: PRINTING INK Organizations: FLINK INK N AMERICAN CORP (CONTACT/OPERATOR)
Alternative names: FLINT INK NORTH AMERICA CORP
MCCONNELL CABINETS INCORPORATED (13110 LOUDEN LANE in CITY OF INDUSTRY, CA)
AIR MAJOR (AIRS/AFS) STATE MASTER (California - Hazardous Waste Tracking) - HAZARDOU WASTE PROGRAM CRITERIA AND HAZARDOUS AIR POLLUTANT INVENTORY (Inventory of air pollution sources) Small Quantity Generators, between 100 kg and 1000 kg of hazardous waste/month (Resource Conservation and Recovery Act (tracking hazardous waste)) - notification TRI REPORTER (Tracking of toxic chemicals releasing facilities) Business SIC classification: WOOD KITCHEN CABINETS; STORAGE BATTERIES Alternative names: EXIDE CORP.
ADMIRAL TRANSPORTATION (300 N BALDWIN PARK BLVD in CITY OF INDUSTRY, CA)
STATE MASTER (California - Hazardous Waste Tracking) - HAZARDOU WASTE PROGRAM TRANSPORTER (Resource Conservation and Recovery Act (tracking hazardous waste)) Organizations: ROBERT BARTH (CONTACT/OWNER)
LAGUNA CLAY CO (14400 LOMITAS AVE in CITY OF INDUSTRY, CA)
STATE MASTER (California - Hazardous Waste Tracking) - HAZARDOU WASTE PROGRAM Small Quantity Generators, between 100 kg and 1000 kg of hazardous waste/month (Resource Conservation and Recovery Act (tracking hazardous waste)) - notification TRI REPORTER (Tracking of toxic chemicals releasing facilities) Business SIC classification: POTTERY PRODUCTS Business NAICS classification: ALL OTHER NONMETALLIC MINERAL MINING. Organizations: WESTWOOD CERAMIC SUPPLY (CONTACT/OWNER)
FRESH START BAKERIES INC (649 SOUTH 7TH AVENUE in LA PUENTE, CA)
STATE MASTER (California - Hazardous Waste Tracking) - HAZARDOU WASTE PROGRAM Small Quantity Generators, between 100 kg and 1000 kg of hazardous waste/month (Resource Conservation and Recovery Act (tracking hazardous waste)) - notification Organizations: CAMPBELL SOUP CO (CONTACT/OWNER)
MERCADO LATINO INC (245 BALDWIN PARK BLVD in CITY OF INDUSTRY, CA)
STATE MASTER (California - Hazardous Waste Tracking) - HAZARDOU WASTE PROGRAM Small Quantity Generators, between 100 kg and 1000 kg of hazardous waste/month (Resource Conservation and Recovery Act (tracking hazardous waste)) - notification Organizations: JORGE RODRIGUEZ (CONTACT/OWNER)
GOLDEN STATE FOODS (640 S SIXTH AVE in CITY OF INDUSTRY, CA)
STATE MASTER (California - Hazardous Waste Tracking) - HAZARDOU WASTE PROGRAM Small Quantity Generators, between 100 kg and 1000 kg of hazardous waste/month (Resource Conservation and Recovery Act (tracking hazardous waste)) - notification Organizations: JAMES WILLIAMS (CONTACT/OWNER)
CACIQUE INCORPORATED (14940 PROCTOR in CITY OF INDUSTRY, CA)
(Integrated Compliance Information System) - ICIS-09-1999-0095, FORMAL ENFORCEMENT ACTION COMPLIANCE ACTIVITY (Tracking inspections of insecticide, fungicide, and rodenticide, and toxic substances) TRI REPORTER (Tracking of toxic chemicals releasing facilities) Business SIC classification: NATURAL, PROCESSED, AND IMITATION CHEESE; FLUID MILK
NAFTA DISTRIBUTORS (450 N BALDWIN PARK BLVD in CITY OF INDUSTRY, CA)
(Integrated Compliance Information System) - ICIS-09-2000-0412, FORMAL ENFORCEMENT ACTION COMPLIANCE ACTIVITY (Tracking inspections of insecticide, fungicide, and rodenticide, and toxic substances)
Housing units lacking complete plumbing facilities: 0.5% Housing units lacking complete kitchen facilities: 1.0%
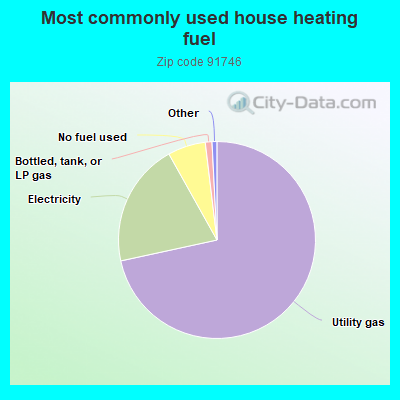
71.6%Utility gas
20.3%Electricity
6.2%No fuel used
1.1%Bottled, tank, or LP gas
Population in 1990: 30,330. Population change in the 1990s: +465 (+1.5%).
Place of birth for U.S.-born residents:
This state: 16,676
Northeast: 206
Midwest: 54
South: 404
West: 316
70% of the 91746 zip code residents lived in the same house 5 years ago. Out of people who lived in different houses, 89% lived in this county. Out of people who lived in different counties, 50% lived in California.
97% of the 91746 zip code residents lived in the same house 1 year ago. Out of people who lived in different houses, 84% moved from this county. Out of people who lived in different houses, 2% moved from different county within same state. Out of people who lived in different houses, 10% moved from different state. Out of people who lived in different houses, 18% moved from abroad.
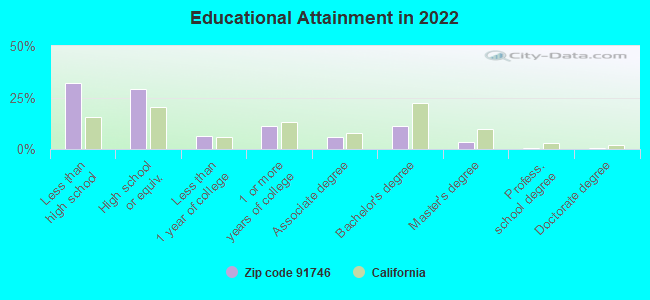
Private vs. public school enrollment:
Students in private schools in grades 1 to 8 (elementary and middle school): 35
Here:
1.3%
California:
10.5%
Students in private schools in grades 9 to 12 (high school): 97
Here:
6.5%
California:
8.5%
Students in private undergraduate colleges: 138
Here:
6.4%
California:
15.9%
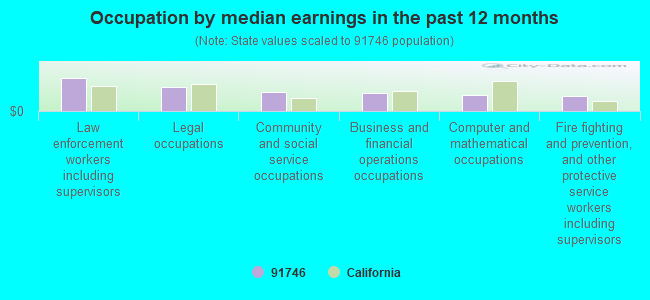
Occupation by median earnings in the past 12 months ($)
133,160Law enforcement workers including supervisors
95,122Legal occupations
75,603Community and social service occupations
71,353Business and financial operations occupations
65,680Computer and mathematical occupations
61,520Fire fighting and prevention, and other protective service workers including supervisors
Companies with biggest federal contracts located in this zip code:
DLJ PRODUCE INC (13260 DAUM DR in CITY OF INDUST, CA; small business) : $16,609,443 in 510 contractsfrom 1999 to 2006
Contracts for Fruits and Vegetables, Special Dietary Foods and Food Specialty Preparations, Sugar, Confectionery, and Nuts, Bakery and Cereal Products by Defense Logistics Agency Signed by year:2000: $1,077,658; 2001: $3,237,562; 2002: $2,213,641; 2003: $1,236,386; 2004: $3,289,292; 2005: $3,756,490; 2006: $1,494,502.
Biggest contracts:
$217,948 with Defense Logistics Agency for Fruits and Vegetables. Signed on 2001-05-28. Completion date: 2001-05-28.
$111,219, same as above.Signed on 2004-06-17. Completion date: 2004-06-17.
$73,521 with Defense Logistics Agency for Special Dietary Foods and Food Specialty Preparations. Signed on 2004-10-08. Completion date: 2004-10-08.
$69,917 with Defense Logistics Agency for Fruits and Vegetables. Signed on 2001-05-23. Completion date: 2001-05-23.
ACS INC (15338 VALLEY BLVD in CITY OF INDUST, CA; small business) : $4,889,040 in 29 contractsfrom 2002 to 2006
Contracts for Radio and Television Communication Equipment, Airborne, Intercommunication and Public Address Systems, Airborne, Miscellaneous Communication Equipment, Maintenance, Repair and Rebuilding of Equipment -- Aircraft Components and Accessories, and moreby Navy, Air Force, Army, Indian Health Service, and others Signed by year:2000: $0; 2001: $0; 2002: $881,113; 2003: $719,830; 2004: $1,902,632; 2005: $523,310; 2006: $862,155.
Biggest contracts:
$1,067,480 with Navy for Radio and Television Communication Equipment, Airborne. Signed on 2004-04-29. Completion date: 2003-01-04.
$849,555, same as above.Signed on 2006-03-16. Completion date: 2003-01-04.
$770,770, same as above.Signed on 2004-11-18. Completion date: 2003-01-04.
$548,117, same as above.Signed on 2002-04-08. Completion date: 2003-10-08.
SUN MECHANICAL COMPANY (14825 PROCTOR AVE in CITY OF INDUST, CA; small business) : $3,815,155 in 25 contractsfrom 2002 to 2006
Contracts for Construction of Structures and Facilities -- Miscellaneous Buildings, Construction of Structures and Facilities -- Other Non-Building Facilities, Maintenance, Repair or Alteration of Real Property -- Miscellaneous Buildings, Maintenance, Repair or Alteration of Real Property -- Dining Facilities, and moreby Navy Signed by year:2000: $0; 2001: $0; 2002: $473,346; 2003: $1,263,450; 2004: -$195,381; 2005: $1,357,298; 2006: $916,442.
Biggest contracts:
$733,099 with Navy for Construction of Structures and Facilities -- Miscellaneous Buildings. Signed on 2005-08-18. Completion date: 2006-02-12.
$438,132, same as above.Signed on 2005-06-27. Completion date: 2005-12-09.
$435,500 with Navy for Construction of Structures and Facilities -- Other Non-Building Facilities. Signed on 2003-09-26. Completion date: 2004-02-09.
$364,000 with Navy for Construction of Structures and Facilities -- Miscellaneous Buildings. Signed on 2006-03-30. Completion date: 2006-08-14.
INTERNATIONAL COMPUTER POWER, (530 BALDWIN PARK BOULEVARD in CITY OF INDUST, CA; small business)
$380,000 with Air Force for Engineering -- Basic Research (R&D). Signed on 1999-12-02. Completion date: 2001-05-15.
KV BLUEPRINT INC (14736 VALLEY BLVD in LA PUENTE, CA; small business) : $165,116 in 28 contractsfrom 2002 to 2006
Contracts for Lease or Rental of Equipment -- Automatic Data Processing Equipment (Including Firmware), Software, Supplies and Support Equipment, Lease or Rental of Equipment -- Office Machines, Text Processing Systems and Visible Record Equipment, Miscellaneous Office Machines, Lease or Rental of Equipment -- Special Industry Machinery, and moreby Army Signed by year:2000: $0; 2001: $0; 2002: $10,125; 2003: $12,379; 2004: $73,099; 2005: $51,876; 2006: $17,637.
Biggest contracts:
$30,888 with Army for Lease or Rental of Equipment -- Automatic Data Processing Equipment (Including Firmware), Software, Supplies and Support Equipment. Signed on 2004-10-19. Completion date: 2004-11-18.
$19,655, same as above.Signed on 2004-11-19. Completion date: 2004-12-18.
$18,133 with Army for Lease or Rental of Equipment -- Office Machines, Text Processing Systems and Visible Record Equipment. Signed on 2005-08-24. Completion date: 2005-10-05.
$13,155, same as above.Signed on 2005-05-11. Completion date: 2005-05-31.
AREMAC HEAT TREATING, INC (330 9TH AVENUE in CITY OF INDUST, CA; small business)
$78,634 with Defense Logistics Agency for Airframe Structural Components. Signed on 2002-08-16. Completion date: 2003-11-15.
FAMILIAR FOODS INC (14314 LOMITAS AVE in CITY OF INDUST, CA; small business) : $49,781 in 7 contractsfrom 2004 to 2006
Contracts for Food Items For Resale, Non-Food Items For Resale by Defense Commissary Agency Signed by year:2000: $0; 2001: $0; 2002: $0; 2003: $0; 2004: $10,773; 2005: $27,852; 2006: $11,156.
Biggest contracts:
$11,803 with Defense Commissary Agency for Food Items For Resale. Signed on 2005-04-01. Completion date: 2005-08-31.
$11,156 with Defense Commissary Agency for Non-Food Items For Resale. Signed on 2006-01-01. Completion date: 2006-03-31.
$8,342, same as above.Signed on 2005-10-01. Completion date: 2005-12-31.
$5,731 with Defense Commissary Agency for Food Items For Resale. Signed on 2004-10-01. Completion date: 2005-02-28.
ALPHA COMPUTER INC (148 S 8TH AVE STE D in CITY OF INDUST, CA; small business) : $34,003 in 6 contractsfrom 2003 to 2006
Contracts for ADPE System Configuration, ADP Input/Output and Storage Devices, Electrical and Electronic Properties Measuring and Testing Instruments by Navy Signed by year:2000: $0; 2001: $0; 2002: $0; 2003: $13,814; 2004: $9,792; 2005: $0; 2006: $10,397.
Biggest contracts:
$13,333 with Navy for ADPE System Configuration. Signed on 2003-11-25. Completion date: 2003-12-08.
$10,397 with Navy for ADP Input/Output and Storage Devices. Signed on 2006-04-26. Completion date: 2006-05-08.
$9,576 with Navy for Electrical and Electronic Properties Measuring and Testing Instruments. Signed on 2004-09-23. Completion date: 2004-09-30.
$427 with Navy for ADPE System Configuration. Signed on 2003-11-25. Completion date: 2003-12-08.
ORBIT COMMUNICATION SYSTEMS, I (15340 EAST VALLEY BLVD in CITY OF INDUST, CA; small business) : $10,939 in 2 contractsfrom 2005 to 2006
$7,350 with Navy for Training Aids. Signed on 2005-04-25. Completion date: 2006-02-25.
$3,589 with Navy for Communications Security Equipment and Components. Signed on 2006-04-05. Completion date: 2006-04-30.
DIXIE DIESEL & ELECTRIC, INC (14835 PROCTOR AVE #A in CITY OF INDUST, CA; small business)
$8,531 with Navy for Maintenance, Repair and Rebuilding of Equipment -- Engines, Turbines, and Components. Signed on 2003-03-19. Completion date: 2003-04-04.
Top industries in this zip code by the number of employees in 2005:
Administrative and Support and Waste Management and Remediation Services: Employment Placement Agencies (over 1000 employees: 1 establishment, 1-4 employees: 1 establishment)
Wholesale Trade: Other Grocery and Related Products Merchant Wholesalers (250-499: 1, 50-99: 3, 10-19: 3, 5-9: 2, 1-4: 6)
Administrative and Support and Waste Management and Remediation Services: Temporary Help Services (100-249: 2, 50-99: 1, 10-19: 1)
Construction: Other Foundation, Structure, and Building Exterior Contractors (250-499: 1, 10-19: 1, 5-9: 1)
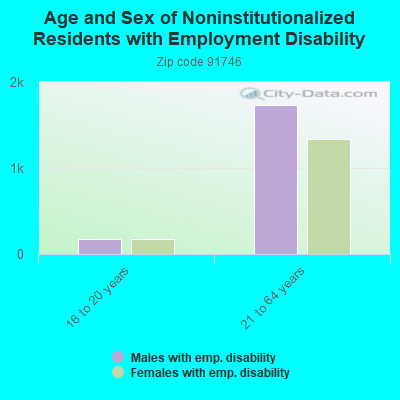
People in group quarters in 2010:
88 people in other noninstitutional facilities
51 people in group homes intended for adults
10 people in college/university student housing
5 people in emergency and transitional shelters (with sleeping facilities) for people experiencing homelessness
4 people in residential treatment centers for adults
People in group quarters in 2000:
46 people in college dormitories (includes college quarters off campus)
28 people in homes or halfway houses for drug/alcohol abuse
21 people in religious group quarters
6 people in homes for the mentally retarded
Fatal accident statistics in 2014:
Fatal accident count: 3
Vehicles involved in fatal accidents: 3
Fatal accidents caused by drunken drivers: 0
Fatalities: 4
Persons involved in fatal accidents: 4
Pedestrians involved in fatal accidents: 2
Fatal accident statistics in 2012:
Fatal accident count: 5
Vehicles involved in fatal accidents: 7
Fatal accidents caused by drunken drivers: 2
Fatalities: 5
Persons involved in fatal accidents: 8
Pedestrians involved in fatal accidents: 2
Home Mortgage Disclosure Act Aggregated Statistics For Year 2009 (Based on 2 full and 20 partial tracts)
A) FHA, FSA/RHS & VA Home Purchase Loans
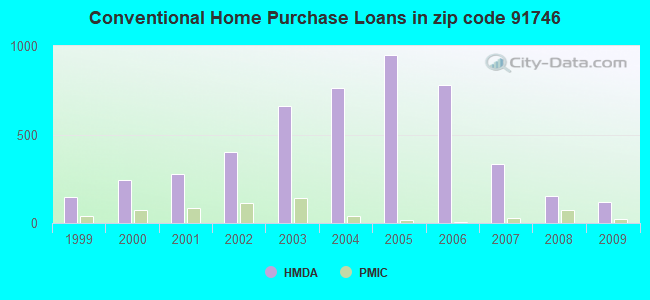
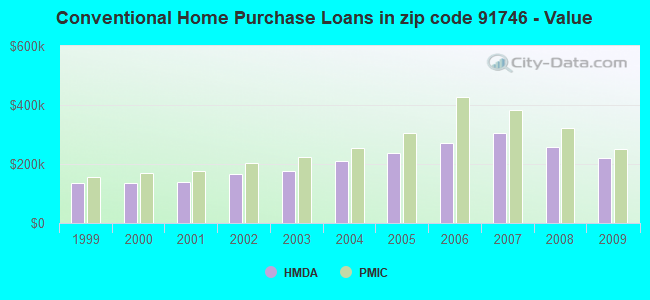
B) Conventional Home Purchase Loans
C) Refinancings
D) Home Improvement Loans
E) Loans on Dwellings For 5+ Families
F) Non-occupant Loans on < 5 Family Dwellings (A B C & D)
G) Loans On Manufactured Home Dwelling (A B C & D)
Number
Average Value
Number
Average Value
Number
Average Value
Number
Average Value
Number
Average Value
Number
Average Value
Number
Average Value
LOANS ORIGINATED
158
$264,546
119
$220,134
480
$228,768
33
$134,216
1
$458,360
40
$204,508
1
$71,580
APPLICATIONS APPROVED, NOT ACCEPTED
25
$241,739
24
$264,954
106
$220,245
12
$185,982
0
$0
6
$200,252
2
$50,995
APPLICATIONS DENIED
35
$254,982
58
$217,166
263
$242,736
43
$82,552
1
$580,200
22
$220,880
3
$37,687
APPLICATIONS WITHDRAWN
19
$261,632
36
$253,321
144
$254,362
15
$166,787
0
$0
8
$197,618
0
$0
FILES CLOSED FOR INCOMPLETENESS
11
$285,678
18
$264,233
37
$265,939
6
$216,545
0
$0
4
$406,752
0
$0
Aggregated Statistics For Year 2008 (Based on 2 full and 20 partial tracts)
A) FHA, FSA/RHS & VA Home Purchase Loans
B) Conventional Home Purchase Loans
C) Refinancings
D) Home Improvement Loans
E) Loans on Dwellings For 5+ Families
F) Non-occupant Loans on < 5 Family Dwellings (A B C & D)
G) Loans On Manufactured Home Dwelling (A B C & D)
Number
Average Value
Number
Average Value
Number
Average Value
Number
Average Value
Number
Average Value
Number
Average Value
Number
Average Value
LOANS ORIGINATED
66
$290,296
152
$256,836
462
$251,003
71
$165,376
3
$296,377
59
$229,814
4
$67,128
APPLICATIONS APPROVED, NOT ACCEPTED
4
$327,140
52
$262,183
170
$247,552
10
$167,637
0
$0
22
$300,740
5
$62,754
APPLICATIONS DENIED
22
$303,099
115
$290,298
485
$294,417
59
$88,590
0
$0
43
$273,983
17
$80,104
APPLICATIONS WITHDRAWN
11
$288,443
49
$286,473
164
$263,246
16
$188,335
0
$0
6
$242,917
0
$0
FILES CLOSED FOR INCOMPLETENESS
4
$296,788
14
$343,281
86
$308,519
7
$212,850
0
$0
10
$249,371
0
$0
Aggregated Statistics For Year 2007 (Based on 2 full and 20 partial tracts)
A) FHA, FSA/RHS & VA Home Purchase Loans
B) Conventional Home Purchase Loans
C) Refinancings
D) Home Improvement Loans
E) Loans on Dwellings For 5+ Families
F) Non-occupant Loans on < 5 Family Dwellings (A B C & D)
G) Loans On Manufactured Home Dwelling (A B C & D)
Number
Average Value
Number
Average Value
Number
Average Value
Number
Average Value
Number
Average Value
Number
Average Value
Number
Average Value
LOANS ORIGINATED
0
$0
332
$306,552
1,250
$291,494
216
$191,558
3
$1,425,373
96
$265,113
11
$47,847
APPLICATIONS APPROVED, NOT ACCEPTED
0
$0
102
$304,841
367
$303,105
67
$162,232
0
$0
38
$303,866
10
$85,011
APPLICATIONS DENIED
0
$0
257
$294,271
1,004
$316,483
210
$154,232
0
$0
85
$285,652
27
$66,741
APPLICATIONS WITHDRAWN
2
$12,740
79
$353,279
336
$320,008
58
$206,170
1
$3,106,320
31
$307,010
0
$0
FILES CLOSED FOR INCOMPLETENESS
0
$0
38
$343,411
136
$334,788
15
$136,819
0
$0
1
$354,160
1
$14,760
Aggregated Statistics For Year 2006 (Based on 2 full and 20 partial tracts)
A) FHA, FSA/RHS & VA Home Purchase Loans
B) Conventional Home Purchase Loans
C) Refinancings
D) Home Improvement Loans
E) Loans on Dwellings For 5+ Families
F) Non-occupant Loans on < 5 Family Dwellings (A B C & D)
G) Loans On Manufactured Home Dwelling (A B C & D)
Number
Average Value
Number
Average Value
Number
Average Value
Number
Average Value
Number
Average Value
Number
Average Value
Number
Average Value
LOANS ORIGINATED
1
$418,780
780
$272,416
1,738
$291,512
299
$195,036
7
$854,819
132
$253,952
7
$64,339
APPLICATIONS APPROVED, NOT ACCEPTED
1
$139,480
173
$249,840
404
$288,724
60
$188,647
1
$18,210
34
$231,010
16
$58,441
APPLICATIONS DENIED
0
$0
351
$275,355
928
$308,896
225
$177,455
1
$3,032,360
60
$259,690
13
$65,868
APPLICATIONS WITHDRAWN
0
$0
186
$273,180
548
$299,084
69
$233,084
0
$0
34
$285,341
0
$0
FILES CLOSED FOR INCOMPLETENESS
0
$0
54
$259,521
219
$275,181
6
$337,050
0
$0
6
$227,523
0
$0
Aggregated Statistics For Year 2005 (Based on 2 full and 20 partial tracts)
A) FHA, FSA/RHS & VA Home Purchase Loans
B) Conventional Home Purchase Loans
C) Refinancings
D) Home Improvement Loans
E) Loans on Dwellings For 5+ Families
F) Non-occupant Loans on < 5 Family Dwellings (A B C & D)
G) Loans On Manufactured Home Dwelling (A B C & D)
Number
Average Value
Number
Average Value
Number
Average Value
Number
Average Value
Number
Average Value
Number
Average Value
Number
Average Value
LOANS ORIGINATED
3
$246,063
950
$237,752
2,076
$256,408
316
$180,553
0
$0
205
$229,040
8
$159,665
APPLICATIONS APPROVED, NOT ACCEPTED
0
$0
197
$230,389
394
$238,615
58
$153,194
0
$0
35
$205,250
8
$59,409
APPLICATIONS DENIED
0
$0
339
$227,110
880
$255,440
190
$132,351
0
$0
56
$230,880
27
$119,274
APPLICATIONS WITHDRAWN
2
$76,490
203
$244,254
718
$261,706
93
$159,828
2
$222,975
52
$236,545
7
$167,101
FILES CLOSED FOR INCOMPLETENESS
0
$0
51
$238,234
256
$258,098
12
$208,457
0
$0
20
$247,376
1
$81,180
Aggregated Statistics For Year 2004 (Based on 2 full and 20 partial tracts)
A) FHA, FSA/RHS & VA Home Purchase Loans
B) Conventional Home Purchase Loans
C) Refinancings
D) Home Improvement Loans
E) Loans on Dwellings For 5+ Families
F) Non-occupant Loans on < 5 Family Dwellings (A B C & D)
G) Loans On Manufactured Home Dwelling (A B C & D)
Number
Average Value
Number
Average Value
Number
Average Value
Number
Average Value
Number
Average Value
Number
Average Value
Number
Average Value
LOANS ORIGINATED
13
$249,929
760
$210,137
2,203
$207,143
249
$140,362
3
$561,413
152
$196,784
7
$81,144
APPLICATIONS APPROVED, NOT ACCEPTED
0
$0
145
$233,774
429
$204,903
57
$129,338
0
$0
34
$193,288
3
$60,710
APPLICATIONS DENIED
2
$282,125
217
$202,231
926
$211,302
207
$134,377
0
$0
50
$166,461
9
$71,323
APPLICATIONS WITHDRAWN
6
$234,512
97
$195,584
721
$205,052
60
$133,027
1
$440,950
16
$158,278
1
$59,040
FILES CLOSED FOR INCOMPLETENESS
2
$301,705
26
$242,546
212
$206,128
11
$111,639
0
$0
10
$175,160
0
$0
Aggregated Statistics For Year 2003 (Based on 2 full and 20 partial tracts)
A) FHA, FSA/RHS & VA Home Purchase Loans
B) Conventional Home Purchase Loans
C) Refinancings
D) Home Improvement Loans
E) Loans on Dwellings For 5+ Families
F) Non-occupant Loans on < 5 Family Dwellings (A B C & D)
Number
Average Value
Number
Average Value
Number
Average Value
Number
Average Value
Number
Average Value
Number
Average Value
LOANS ORIGINATED
101
$210,333
663
$177,829
3,191
$164,896
72
$50,015
1
$792,550
187
$148,205
APPLICATIONS APPROVED, NOT ACCEPTED
5
$244,714
113
$191,300
582
$163,560
18
$53,492
0
$0
45
$164,711
APPLICATIONS DENIED
8
$224,582
170
$192,582
1,023
$166,156
88
$42,573
0
$0
68
$162,620
APPLICATIONS WITHDRAWN
10
$220,751
103
$189,913
951
$171,372
28
$50,621
0
$0
22
$136,643
FILES CLOSED FOR INCOMPLETENESS
1
$201,430
26
$193,156
160
$175,185
12
$46,505
0
$0
9
$155,354
Aggregated Statistics For Year 2002 (Based on 2 full and 16 partial tracts)
A) FHA, FSA/RHS & VA Home Purchase Loans
B) Conventional Home Purchase Loans
C) Refinancings
D) Home Improvement Loans
E) Loans on Dwellings For 5+ Families
F) Non-occupant Loans on < 5 Family Dwellings (A B C & D)
Number
Average Value
Number
Average Value
Number
Average Value
Number
Average Value
Number
Average Value
Number
Average Value
LOANS ORIGINATED
87
$179,296
400
$166,701
1,370
$160,070
44
$40,911
3
$542,397
90
$127,538
APPLICATIONS APPROVED, NOT ACCEPTED
8
$157,170
42
$161,199
217
$156,235
15
$33,271
0
$0
7
$154,870
APPLICATIONS DENIED
14
$181,898
91
$124,575
453
$146,481
59
$19,563
1
$623,620
22
$147,086
APPLICATIONS WITHDRAWN
8
$182,744
42
$196,691
477
$154,512
31
$34,098
0
$0
7
$152,356
FILES CLOSED FOR INCOMPLETENESS
1
$215,000
22
$191,555
161
$159,042
0
$0
0
$0
8
$189,576
Aggregated Statistics For Year 2001 (Based on 2 full and 16 partial tracts)
A) FHA, FSA/RHS & VA Home Purchase Loans
B) Conventional Home Purchase Loans
C) Refinancings
D) Home Improvement Loans
E) Loans on Dwellings For 5+ Families
F) Non-occupant Loans on < 5 Family Dwellings (A B C & D)
Number
Average Value
Number
Average Value
Number
Average Value
Number
Average Value
Number
Average Value
Number
Average Value
LOANS ORIGINATED
145
$166,865
277
$137,401
1,015
$139,744
56
$38,401
2
$837,570
96
$130,482
APPLICATIONS APPROVED, NOT ACCEPTED
11
$154,321
33
$131,356
158
$135,692
15
$47,923
0
$0
12
$110,559
APPLICATIONS DENIED
25
$160,586
76
$114,182
561
$133,284
108
$25,866
0
$0
44
$122,005
APPLICATIONS WITHDRAWN
23
$161,536
45
$163,176
422
$154,186
47
$39,266
0
$0
7
$114,727
FILES CLOSED FOR INCOMPLETENESS
6
$126,530
16
$107,821
88
$153,619
6
$34,763
0
$0
6
$141,105
Aggregated Statistics For Year 2000 (Based on 2 full and 16 partial tracts)
A) FHA, FSA/RHS & VA Home Purchase Loans
B) Conventional Home Purchase Loans
C) Refinancings
D) Home Improvement Loans
F) Non-occupant Loans on < 5 Family Dwellings (A B C & D)
Number
Average Value
Number
Average Value
Number
Average Value
Number
Average Value
Number
Average Value
LOANS ORIGINATED
150
$154,657
244
$137,215
274
$110,601
58
$34,187
25
$93,594
APPLICATIONS APPROVED, NOT ACCEPTED
2
$168,885
33
$148,158
58
$100,447
41
$25,640
2
$186,030
APPLICATIONS DENIED
23
$140,148
115
$142,711
282
$105,383
70
$27,392
8
$88,108
APPLICATIONS WITHDRAWN
22
$149,624
44
$122,891
142
$111,887
14
$36,809
5
$74,356
FILES CLOSED FOR INCOMPLETENESS
12
$115,391
14
$179,549
72
$134,592
4
$57,622
5
$102,966
Aggregated Statistics For Year 1999 (Based on 1 full and 9 partial tracts)
A) FHA, FSA/RHS & VA Home Purchase Loans
B) Conventional Home Purchase Loans
C) Refinancings
D) Home Improvement Loans
E) Loans on Dwellings For 5+ Families
F) Non-occupant Loans on < 5 Family Dwellings (A B C & D)


 Nearest zip codes: 91732, 91745, 91744, 91790, 91706, 90601.