Estimated zip code population in 2022: 44,926 Zip code population in 2010: 46,457 Zip code population in 2000: 46,520
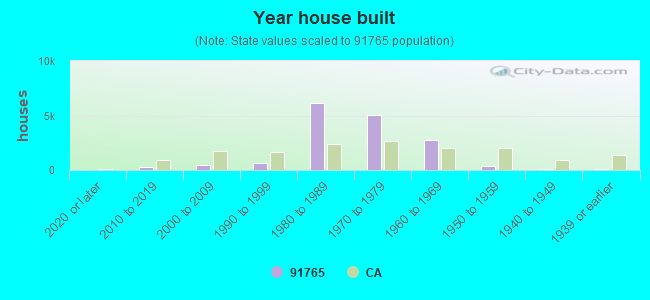
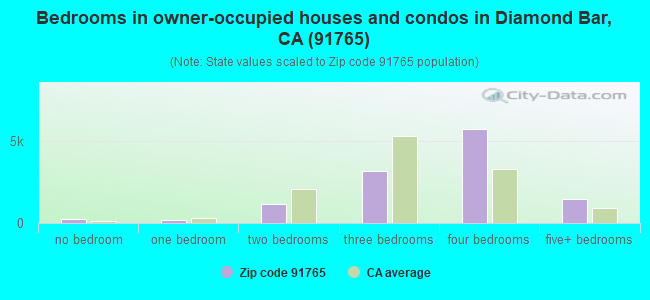
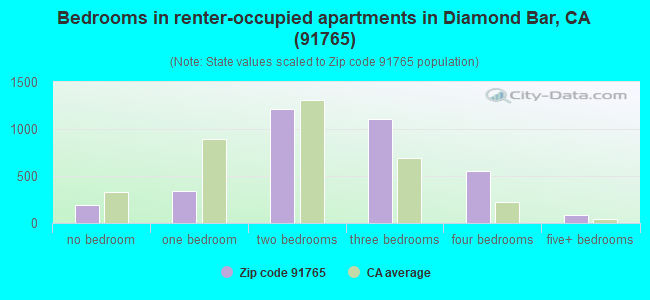
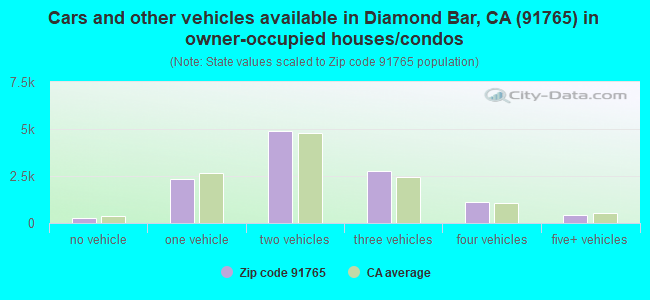
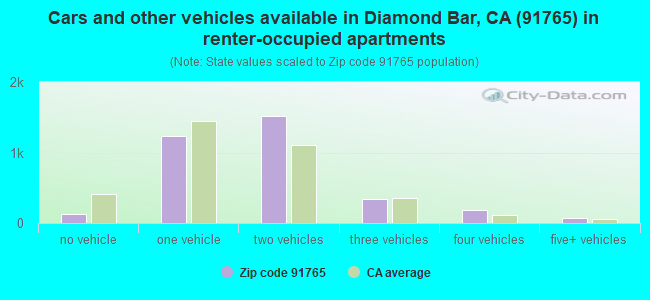
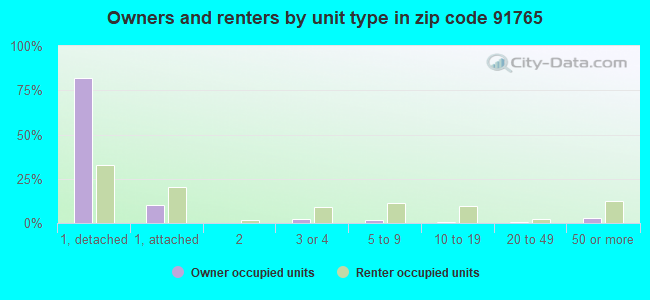
Houses and condos: 15,977 Renter-occupied apartments: 3,492
% of renters here:
23%
State:
44%
March 2022 cost of living index in zip code 91765: 136.1 (high, U.S. average is 100)
Land area: 18.9 sq. mi. Water area: 0.0 sq. mi.
Population density: 2,375 people per square mile
(low).
OSM Map
General Map
Google Map
MSN Map
OSM Map
General Map
Google Map
MSN Map
OSM Map
General Map
Google Map
MSN Map
OSM Map
General Map
Google Map
MSN Map
Please wait while loading the map...
Real estate property taxes paid for housing units in 2022:
This zip code:
0.7% ($6,402)
California:
0.7% ($4,831)
Median real estate property taxes paid for housing units with mortgages in 2022: $6,821 (0.7%) Median real estate property taxes paid for housing units with no mortgage in 2022: $5,700 (0.6%)
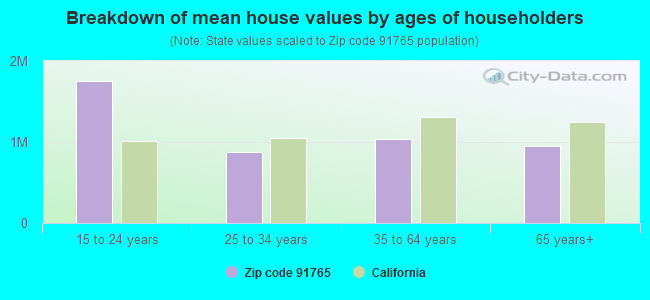
Estimated median house/condo value in 2022: $911,787
91765:
$911,787
California:
$715,900
According to our research of California and other state lists, there were 22 registered sex offenders living in 91765 zip code as of April 16, 2024. The ratio of all residents to sex offenders in zip code 91765 is 2,190 to 1. The ratio of registered sex offenders to all residents in this zip code is much lower than the state average.
Median resident age:
This zip code:
45.6 years
California median age:
37.9 years
Average household size:
This zip code:
2.9 people
California:
2.8 people
Averages for the 2020 tax year for zip code 91765, filed in 2021:
Average Adjusted Gross Income (AGI) in 2020: $96,110 (Individual Income Tax Returns)
Here:
$96,110
State:
$95,910
Salary/wage: $77,413 (reported on 76.7% of returns)
Here:
$77,413
State:
$77,331
(% of AGI for various income ranges: 1178.6% for AGIs below $25k, 3719.4% for AGIs $25k-50k, 7399.3% for AGIs $50k-75k, 10864.6% for AGIs $75k-100k, 20935.7% for AGIs $100k-200k, 96134.6% for AGIs over 200k)
Taxable interest for individuals: $2,456 (reported on 45.9% of returns)
This zip code:
$2,456
California:
$2,294
(% of AGI for various income ranges: 55.6% for AGIs below $25k, 83.4% for AGIs $25k-50k, 97.8% for AGIs $50k-75k, 160.2% for AGIs $75k-100k, 251.4% for AGIs $100k-200k, 2409.4% for AGIs over 200k)
Ordinary dividends: $8,582 (reported on 27.6% of returns)
Here:
$8,582
State:
$10,949
(% of AGI for various income ranges: 28.2% for AGIs below $25k, 67.3% for AGIs $25k-50k, 97.8% for AGIs $50k-75k, 148.7% for AGIs $75k-100k, 327.4% for AGIs $100k-200k, 8234.2% for AGIs over 200k)
Net capital gain/loss in AGI: +$26,202 (reported on 28.7% of returns)
Here:
+$26,202
State:
+$49,306
(% of AGI for various income ranges: 25.4% for AGIs below $25k, 111.3% for AGIs $25k-50k, 198.5% for AGIs $50k-75k, 312.2% for AGIs $75k-100k, 784.1% for AGIs $100k-200k, 29241.0% for AGIs over 200k)
Profit/loss from business: +$14,842 (reported on 21.5% of returns)
Here:
+$14,842
State:
+$15,671
(% of AGI for various income ranges: 262.8% for AGIs below $25k, 441.1% for AGIs $25k-50k, 334.2% for AGIs $50k-75k, 365.5% for AGIs $75k-100k, 641.2% for AGIs $100k-200k, 4981.8% for AGIs over 200k)
Taxable individual retirement arrangement distribution: $23,595 (reported on 7.7% of returns)
91765:
$23,595
California:
$23,505
(% of AGI for various income ranges: 56.7% for AGIs below $25k, 113.7% for AGIs $25k-50k, 199.2% for AGIs $50k-75k, 316.0% for AGIs $75k-100k, 700.4% for AGIs $100k-200k, 2653.0% for AGIs over 200k)
Self-employed (Keogh) retirement plans: $24,711 (reported on 0.8% of returns)
91765:
$24,711
California:
$30,163
(% of AGI for various income ranges: 9.1% for AGIs $25k-50k, 51.3% for AGIs $100k-200k, 610.8% for AGIs over 200k)
Total itemized deductions: $35,737 (reported on 19.3% of returns)
Here:
$35,737
State:
$39,517
(% of AGI for various income ranges: 119.7% for AGIs below $25k, 360.7% for AGIs $25k-50k, 768.9% for AGIs $50k-75k, 1222.6% for AGIs $75k-100k, 2558.7% for AGIs $100k-200k, 11667.8% for AGIs over 200k)
Charity contributions: $9,110 (reported on 15.8% of returns)
Here:
$9,110
State:
$12,598
(% of AGI for various income ranges: 5.6% for AGIs below $25k, 34.9% for AGIs $25k-50k, 96.7% for AGIs $50k-75k, 165.9% for AGIs $75k-100k, 444.7% for AGIs $100k-200k, 3721.2% for AGIs over 200k)
Taxes paid: $9,038 (reported on 19.3% of returns)
91765:
$9,038
State:
$8,807
(% of AGI for various income ranges: 32.1% for AGIs below $25k, 99.6% for AGIs $25k-50k, 217.1% for AGIs $50k-75k, 381.1% for AGIs $75k-100k, 753.4% for AGIs $100k-200k, 2140.2% for AGIs over 200k)
Earned income credit: $1,758 (reported on 10.6% of returns)
Here:
$1,758
State:
$2,074
(% of AGI for various income ranges: 61.9% for AGIs below $25k, 59.9% for AGIs $25k-50k, 0.7% for AGIs $50k-75k)
Percentage of individuals using paid preparers for their 2020 taxes: 92.2%
Here:
92%
State:
92%
(% for various income ranges: 91.1% for AGIs below $25k, 92.0% for AGIs $25k-50k, 93.8% for AGIs $50k-75k, 93.4% for AGIs $75k-100k, 92.2% for AGIs $100k-200k, 92.9% for AGIs over 200k)
Averages for the 2012 tax year for zip code 91765, filed in 2013:
Average Adjusted Gross Income (AGI) in 2012: $77,601 (Individual Income Tax Returns)
Here:
$77,601
State:
$72,726
Salary/wage: $65,799 (reported on 81.5% of returns)
Here:
$65,799
State:
$59,079
(% of AGI for various income ranges: 73.3% for AGIs below $25k, 76.8% for AGIs $25k-50k, 78.0% for AGIs $50k-75k, 78.0% for AGIs $75k-100k, 77.8% for AGIs $100k-200k, 50.3% for AGIs over 200k)
Taxable interest for individuals: $1,756 (reported on 48.4% of returns)
This zip code:
$1,756
California:
$2,146
(% of AGI for various income ranges: 1.9% for AGIs below $25k, 1.0% for AGIs $25k-50k, 0.8% for AGIs $50k-75k, 0.7% for AGIs $75k-100k, 0.7% for AGIs $100k-200k, 1.7% for AGIs over 200k)
Ordinary dividends: $5,807 (reported on 24.3% of returns)
Here:
$5,807
State:
$9,308
(% of AGI for various income ranges: 1.8% for AGIs below $25k, 0.8% for AGIs $25k-50k, 0.9% for AGIs $50k-75k, 0.9% for AGIs $75k-100k, 0.9% for AGIs $100k-200k, 3.8% for AGIs over 200k)
Net capital gain/loss in AGI: +$10,322 (reported on 22.0% of returns)
Here:
+$10,322
State:
+$30,460
(% of AGI for various income ranges: 0.3% for AGIs $75k-100k, 0.8% for AGIs $100k-200k, 8.9% for AGIs over 200k)
Profit/loss from business: +$17,073 (reported on 20.9% of returns)
Here:
+$17,073
State:
+$17,064
(% of AGI for various income ranges: 16.3% for AGIs below $25k, 9.0% for AGIs $25k-50k, 4.1% for AGIs $50k-75k, 3.5% for AGIs $75k-100k, 3.4% for AGIs $100k-200k, 3.2% for AGIs over 200k)
Taxable individual retirement arrangement distribution: $19,629 (reported on 7.8% of returns)
91765:
$19,629
California:
$19,557
(% of AGI for various income ranges: 2.9% for AGIs below $25k, 2.1% for AGIs $25k-50k, 2.3% for AGIs $50k-75k, 2.2% for AGIs $75k-100k, 2.2% for AGIs $100k-200k, 1.3% for AGIs over 200k)
Self-employment retirement plans: $23,896 (reported on 1.1% of returns)
91765:
$23,896
California:
$24,530
(% of AGI for various income ranges: 0.3% for AGIs $25k-50k, 0.2% for AGIs $75k-100k, 0.3% for AGIs $100k-200k, 0.6% for AGIs over 200k)
Total itemized deductions: $32,280 (25% of AGI, reported on 48.4% of returns)
Here:
$32,280
State:
$34,004
Here:
25.3% of AGI
State:
22.7% of AGI
(% of AGI for various income ranges: 16.5% for AGIs below $25k, 18.1% for AGIs $25k-50k, 19.9% for AGIs $50k-75k, 21.5% for AGIs $75k-100k, 21.5% for AGIs $100k-200k, 19.4% for AGIs over 200k)
Charity contributions: $3,878 (reported on 40.5% of returns)
Here:
$3,878
State:
$4,659
(% of AGI for various income ranges: 0.9% for AGIs below $25k, 1.5% for AGIs $25k-50k, 2.0% for AGIs $50k-75k, 2.2% for AGIs $75k-100k, 2.4% for AGIs $100k-200k, 2.0% for AGIs over 200k)
Taxes paid: $13,378 (reported on 48.2% of returns)
91765:
$13,378
State:
$14,448
(% of AGI for various income ranges: 4.5% for AGIs below $25k, 5.1% for AGIs $25k-50k, 6.4% for AGIs $50k-75k, 7.5% for AGIs $75k-100k, 8.7% for AGIs $100k-200k, 10.5% for AGIs over 200k)
Earned income credit: $1,963 (reported on 12.7% of returns)
Here:
$1,963
State:
$2,286
(% of AGI for various income ranges: 4.8% for AGIs below $25k, 1.0% for AGIs $25k-50k)
Percentage of individuals using paid preparers for their 2012 taxes: 65.3%
Here:
65%
State:
64%
(% for various income ranges: 61.5% for AGIs below $25k, 65.1% for AGIs $25k-50k, 66.8% for AGIs $50k-75k, 66.4% for AGIs $75k-100k, 67.3% for AGIs $100k-200k, 76.7% for AGIs over 200k)
Averages for the 2004 tax year for zip code 91765, filed in 2005:
Average Adjusted Gross Income (AGI) in 2004: $65,931 (Individual Income Tax Returns)
Here:
$65,931
State:
$58,600
Salary/wage: $57,025 (reported on 83.9% of returns)
Here:
$57,025
State:
$49,455
(% of AGI for various income ranges: 76.4% for AGIs $10k-25k, 80.2% for AGIs $25k-50k, 83.0% for AGIs $50k-75k, 84.0% for AGIs $75k-100k, 62.5% for AGIs over 100k)
Taxable interest for individuals: $2,031 (reported on 58.0% of returns)
This zip code:
$2,031
California:
$2,365
(% of AGI for various income ranges: 2.4% for AGIs $10k-25k, 1.5% for AGIs $25k-50k, 1.2% for AGIs $50k-75k, 1.0% for AGIs $75k-100k, 2.0% for AGIs over 100k)
Taxable dividends: $3,806 (reported on 27.7% of returns)
Here:
$3,806
State:
$4,746
(% of AGI for various income ranges: 1.1% for AGIs $10k-25k, 0.7% for AGIs $25k-50k, 0.6% for AGIs $50k-75k, 0.6% for AGIs $75k-100k, 2.2% for AGIs over 100k)
Net capital gain/loss: +$14,410 (reported on 25.4% of returns)
Here:
+$14,410
State:
+$23,418
(% of AGI for various income ranges: -0.3% for AGIs $10k-25k, 0.5% for AGIs $25k-50k, 0.7% for AGIs $50k-75k, 1.1% for AGIs $75k-100k, 9.4% for AGIs over 100k)
Profit/loss from business: +$17,675 (reported on 21.1% of returns)
Here:
+$17,675
State:
+$16,826
(% of AGI for various income ranges: 12.6% for AGIs $10k-25k, 9.5% for AGIs $25k-50k, 4.8% for AGIs $50k-75k, 4.2% for AGIs $75k-100k, 4.7% for AGIs over 100k)
IRA payment deduction: $3,798 (reported on 6.0% of returns)
91765:
$3,798
California:
$3,192
(% of AGI for various income ranges: 0.4% for AGIs $10k-25k, 0.7% for AGIs $25k-50k, 0.5% for AGIs $50k-75k, 0.4% for AGIs $75k-100k, 0.2% for AGIs over 100k)
Self-employed pension: $17,434 (reported on 1.7% of returns)
Here:
$17,434
California:
$17,688
(% of AGI for various income ranges: 0.1% for AGIs $10k-25k, 0.3% for AGIs $25k-50k, 0.2% for AGIs $50k-75k, 0.3% for AGIs $75k-100k, 0.6% for AGIs over 100k)
Total itemized deductions: $27,765 (27% of AGI, reported on 54.6% of returns)
Here:
$27,765
State:
$28,113
Here:
26.8% of AGI
State:
25.3% of AGI
(% of AGI for various income ranges: 19.0% for AGIs $10k-25k, 24.9% for AGIs $25k-50k, 27.3% for AGIs $50k-75k, 26.1% for AGIs $75k-100k, 20.5% for AGIs over 100k)
Charity contributions deductions: $3,615 (3% of AGI, reported on 47.8% of returns)
Here:
$3,615
State:
$3,923
Here:
3.3% of AGI
State:
3.3% of AGI
(% of AGI for various income ranges: 1.2% for AGIs $10k-25k, 2.3% for AGIs $25k-50k, 2.8% for AGIs $50k-75k, 2.9% for AGIs $75k-100k, 2.6% for AGIs over 100k)
Total tax: $10,908 (reported on 80.0% of returns)
91765:
$10,908
State:
$10,761
(% of AGI for various income ranges: 5.1% for AGIs $10k-25k, 7.0% for AGIs $25k-50k, 8.2% for AGIs $50k-75k, 9.1% for AGIs $75k-100k, 17.3% for AGIs over 100k)
Earned income credit: $1,483 (reported on 9.8% of returns)
Here:
$1,483
State:
$1,763
Percentage of individuals using paid preparers for their 2004 taxes: 67.7%
Here:
68%
State:
66%
(% for various income ranges: 59.0% for AGIs below $10k, 65.8% for AGIs $10k-25k, 68.9% for AGIs $25k-50k, 70.5% for AGIs $50k-75k, 69.6% for AGIs $75k-100k, 73.2% for AGIs over 100k)
Household received Food Stamps/SNAP in the past 12 months: 859 Household did not receive Food Stamps/SNAP in the past 12 months: 14,253
Women who had a birth in the past 12 months: 347 (271 now married, 75 unmarried) Women who did not have a birth in the past 12 months: 9,418 (4,264 now married, 5,131 unmarried)
Housing units in zip code 91765 with a mortgage: 7,558 (729 second mortgage, 5 home equity loan, 610 both second mortgage and home equity loan) Houses without a mortgage: 70
Median monthly owner costs for units with a mortgage: $2,878 Median monthly owner costs for units without a mortgage: $893
Residents with income below the poverty level in 2022:
This zip code:
9.8%
Whole state:
12.2%
Residents with income below 50% of the poverty level in 2022:
This zip code:
4.1%
Whole state:
6.2%
Median number of rooms in houses and condos:
Here:
6.6
State:
6.0
Median number of rooms in apartments:
Here:
4.5
State:
3.9
Notable locations in this zip code not listed on our city pages
Notable locations in zip code 91765: Diamond Bar Golf Course (A), Diamond Bar Branch County of Los Angeles Public Library (B), Los Angeles County Fire Department Station 120 (C), Los Angeles County Fire Department Station 121 (D). Display/hide their locations on the map
Parks in zip code 91765 include: Carlton Peterson Park (1), Sycamore Canyon Park (2), Heritage Park (3), Maple Hill Park (4), Paul C Grow Park (5), Summit Ridge Park (6). Display/hide their locations on the map
6,292 married couples with children.
1,361 single-parent households (429 men, 932 women).
41.0% of residents of 91765 zip code speak English at home.
9.5% of residents speak Spanish at home (80% very well, 13% well, 7% not well, 1% not at all).
4.2% of residents speak other Indo-European language at home (74% very well, 18% well, 4% not well, 3% not at all).
44.6% of residents speak Asian or Pacific Island language at home (44% very well, 33% well, 19% not well, 5% not at all).
1.1% of residents speak other language at home (73% very well, 18% well, 8% not well).
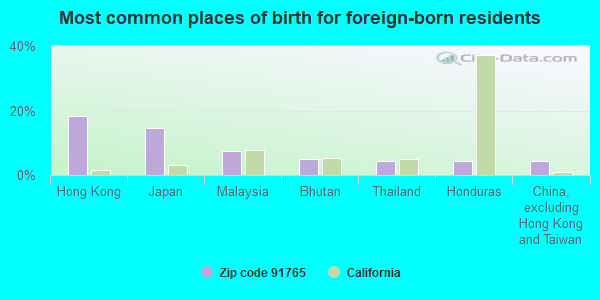
Foreign born population: 20,320 (45.2%) (71.4% of them are naturalized citizens)
This zip code:
45.2%
Whole state:
26.7%
18%Hong Kong
14%Japan
7%Malaysia
5%Bhutan
4%Thailand
4%Honduras
4%China, excluding Hong Kong and Taiwan
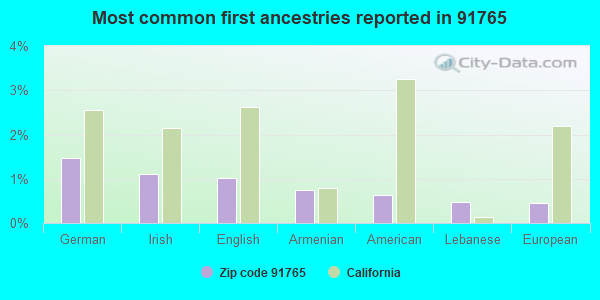
1%German
1%Irish
1%English
1%Armenian
1%American
0%Lebanese
0%European
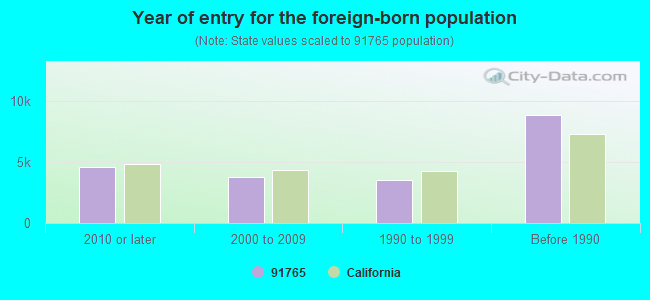
Year of entry for the foreign-born population
4,6132010 or later
3,7642000 to 2009
3,5411990 to 1999
8,865Before 1990
Major facilities with environmental interests located in this zip code:
CHEVRON STATION NO 94524 (150 S DIAMOND BAR BLVD in DIAMOND BAR, CA)
STATE MASTER (California - Hazardous Waste Tracking) - HAZARDOU WASTE PROGRAM Small Quantity Generators, between 100 kg and 1000 kg of hazardous waste/month (Resource Conservation and Recovery Act (tracking hazardous waste)) - notification STATE MASTER (California - Used Oil Recycling System ) - USED OIL RECYCLING Organizations: CHEVRON PRODUCTS CO (CONTACT/OWNER)
Alternative names: PATHFINDER CHEVRON
CHEVRON STATION NO 91175 (21095 GOLDEN SPRINGS DRIVE in DIAMOND BAR, CA)
STATE MASTER (California - Hazardous Waste Tracking) - HAZARDOU WASTE PROGRAM HAZARDOUS WASTE BIENNIAL REPORTER (Resource Conservation and Recovery Act (tracking hazardous waste)) Large Quantity Generators, more that 1000 kg of hazardous waste/month (Resource Conservation and Recovery Act (tracking hazardous waste)) Small Quantity Generators, between 100 kg and 1000 kg of hazardous waste/month (Resource Conservation and Recovery Act (tracking hazardous waste)) - notification Organizations: CHEVRON PRODUCTS CO (CONTACT/OWNER)
Alternative names: CHEVRON NO 91175
GOODRICH CORPORATION (1550 SOUTH VALLEY VISTA DRIVE in DIAMOND BAR, CA)
STATE MASTER (California - Hazardous Waste Tracking) - HAZARDOU WASTE PROGRAM Small Quantity Generators, between 100 kg and 1000 kg of hazardous waste/month (Resource Conservation and Recovery Act (tracking hazardous waste)) - notification Business NAICS classification: ALL OTHER MISCELLANEOUS FABRICATED METAL PRODUCT MANUFACTURING.; OTHER MOTOR VEHICLE ELECTRICAL AND ELECTRONIC EQUIPMENT MANUFACTURING. Alternative names: T R W AERONAUTICAL SYSTEMS
FAIRPLEX FAIRGROUNDS (1101 W MC KINNLEY in POMONA, CA)
STATE MASTER (California - Hazardous Waste Tracking) - HAZARDOU WASTE PROGRAM Small Quantity Generators, between 100 kg and 1000 kg of hazardous waste/month (Resource Conservation and Recovery Act (tracking hazardous waste)) - notification Organizations: LA COUNTY FAIR ASC (CONTACT/OWNER)
CHEVRON 98559 (2707 DIAMOND BAR BLVD in DIAMOND BAR, CA) . Federal Facility
STATE MASTER (California - Hazardous Waste Tracking) - HAZARDOU WASTE PROGRAM Small Quantity Generators, between 100 kg and 1000 kg of hazardous waste/month (Resource Conservation and Recovery Act (tracking hazardous waste)) - notification Organizations: CHEVRON USA PRODUCTS CO (CONTACT/OWNER)
Alternative names: CHEVRON STATION SW89095
CHEVRON STATION 90679 (150 S DIAMOND BAR BLVD in DIAMOND BAR, CA)
STATE MASTER (California - Hazardous Waste Tracking) - HAZARDOU WASTE PROGRAM Small Quantity Generators, between 100 kg and 1000 kg of hazardous waste/month (Resource Conservation and Recovery Act (tracking hazardous waste)) - notification Organizations: CHEVRON PRODUCTS CO (CONTACT/OWNER)
EVERGREEN ELEMENTARY (2450 S. EVERGREEN SPRINGS in DIAMOND BAR, CA)
(National Center for Education Statistics) - STATE ID-6023378 Organizations: WALNUT VALLEY UNIFIED (SCHOOL DISTRICT)
GOLDEN SPRINGS ELEMENTARY (245 S. BALLENA DR. in DIAMOND BAR, CA)
(National Center for Education Statistics) - STATE ID-6021836 Organizations: POMONA UNIFIED (SCHOOL DISTRICT)
LORBEER MIDDLE (501 DIAMOND BAR BLVD. in DIAMOND BAR, CA)
(National Center for Education Statistics) - STATE ID-6066781 Organizations: POMONA UNIFIED (SCHOOL DISTRICT)
MAPLE HILL ELEMENTARY (1350 MAPLE HILL ROAD in DIAMOND BAR, CA)
(National Center for Education Statistics) - STATE ID-6100309 Organizations: WALNUT VALLEY UNIFIED (SCHOOL DISTRICT)
CHAPARRAL MIDDLE (1408 S. SPRUCE TREE DR. in DIAMOND BAR, CA)
(National Center for Education Statistics) - STATE ID-6096358 Organizations: WALNUT VALLEY UNIFIED (SCHOOL DISTRICT)
CASTLE ROCK ELEMENTARY (2975 CASTLE ROCK ROAD in DIAMOND BAR, CA)
(National Center for Education Statistics) - STATE ID-6023352 Organizations: WALNUT VALLEY UNIFIED (SCHOOL DISTRICT)
EXXONMOBIL OIL CORP NO 10604 (350 S DIAMOND BAR in DIAMOND BAR, CA)
HAZARDOUS WASTE BIENNIAL REPORTER (Resource Conservation and Recovery Act (tracking hazardous waste)) Large Quantity Generators, more that 1000 kg of hazardous waste/month (Resource Conservation and Recovery Act (tracking hazardous waste)) Organizations: EXXONMOBIL OIL CORPORATION (CONTACT/OPERATOR)
Alternative names: EXXONMOBIL OIL CORP.
Housing units lacking complete plumbing facilities: 0.2% Housing units lacking complete kitchen facilities: 1.4%
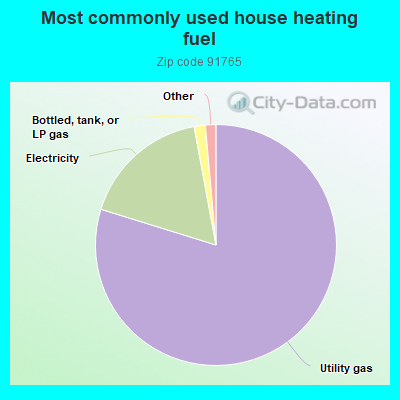
79.8%Utility gas
17.3%Electricity
1.5%Bottled, tank, or LP gas
0.8%Solar energy
0.7%No fuel used
Population in 1990: 41,920. Population change in the 1990s: +4,600 (+11.0%).
Place of birth for U.S.-born residents:
This state: 20,646
Northeast: 837
Midwest: 989
South: 962
West: 768
62% of the 91765 zip code residents lived in the same house 5 years ago. Out of people who lived in different houses, 72% lived in this county. Out of people who lived in different counties, 50% lived in California.
93% of the 91765 zip code residents lived in the same house 1 year ago. Out of people who lived in different houses, 40% moved from this county. Out of people who lived in different houses, 24% moved from different county within same state. Out of people who lived in different houses, 20% moved from different state. Out of people who lived in different houses, 23% moved from abroad.
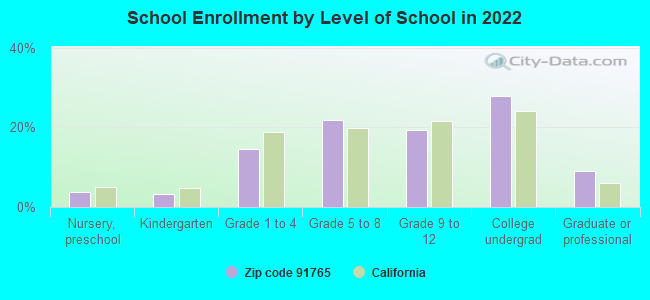
Private vs. public school enrollment:
Students in private schools in grades 1 to 8 (elementary and middle school): 404
Here:
9.9%
California:
10.5%
Students in private schools in grades 9 to 12 (high school): 149
Here:
6.8%
California:
8.5%
Students in private undergraduate colleges: 372
Here:
11.8%
California:
15.9%
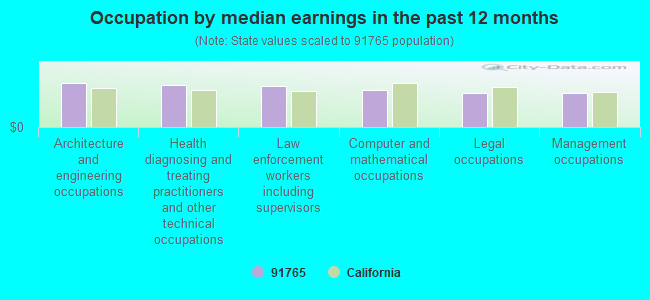
Occupation by median earnings in the past 12 months ($)
116,720Architecture and engineering occupations
110,251Health diagnosing and treating practitioners and other technical occupations
109,771Law enforcement workers including supervisors
96,892Computer and mathematical occupations
89,270Legal occupations
88,968Management occupations
Companies with biggest federal contracts located in this zip code (DIAMOND BAR, CA):
GEOFON, INC (22632 GOLDEN SPRINGS DRIVE; small business) : $36,004,152 in 178 contractsfrom 1999 to 2006
Contracts for Other Environmental Services, Studies, and Analytical Support, Maintenance, Repair or Alteration of Real Property -- Other Non-Building Facilities, Other Professional Services, Hazardous Substance Removal, Cleanup, and Disposal Services and Operational Support, and moreby Navy, Army, U.S. Army Corps of Engineers - civil program financing only, Federal Technology Service, and others Signed by year:2000: $6,912,472; 2001: $4,413,315; 2002: $2,108,764; 2003: $10,521,765; 2004: $5,538,854; 2005: $3,593,634; 2006: $2,397,164.
Biggest contracts:
$4,993,554 with Navy for Other Environmental Services, Studies, and Analytical Support. Signed on 2003-09-16. Completion date: 2007-08-30.
$2,632,058, same as above.Signed on 2004-02-26. Completion date: 2005-07-20.
$2,142,835 with Army for Other Environmental Services, Studies, and Analytical Support. Taking place in NV. Signed on 2005-05-09. Completion date: 2006-05-08.
$2,139,433 with Navy for Maintenance, Repair or Alteration of Real Property -- Other Non-Building Facilities. Taking place in AZ. Signed on 2000-01-31. Completion date: 2001-02-09.
LUCAS WESTERN INC (1550 S VALLEY VISTA DRIVE) : $23,108,977 in 110 contractsfrom 1999 to 2006
Contracts for Aircraft Ground Servicing Equipment, Miscellaneous Aircraft Accessories and Components, Motors, Electrical, Maintenance, Repair and Rebuilding of Equipment -- Engines, Turbines, and Components, and moreby Navy, Army, Air Force, United States Coast Guard (disused code: now 7008), and others Signed by year:2000: $294,894; 2001: $608,205; 2002: $2,247,843; 2003: $10,970,317; 2004: $4,268,011; 2005: $3,855,788; 2006: $713,443.
Biggest contracts:
$3,587,290 with Navy for Aircraft Ground Servicing Equipment. Signed on 2004-06-02. Completion date: 2005-04-02.
$2,541,748 with Army for Miscellaneous Aircraft Accessories and Components. Signed on 2003-11-26. Completion date: 2004-11-25.
$2,073,230, same as above.Signed on 2005-07-08. Completion date: 2006-12-31.
$1,859,913, same as above.Signed on 2003-01-09. Completion date: 2007-09-30.
GOODRICH CORPORATION (1550 SOUTH VALLEY VISTA DR) : $20,586,684 in 241 contractsfrom 2003 to 2006
Contracts for Miscellaneous Aircraft Accessories and Components, Aircraft Ground Servicing Equipment, Motors, Electrical, Cable, Cord, and Wire Assemblies: Communications Equipment, and moreby Army, Navy, Defense Logistics Agency, Air Force, and others Signed by year:2000: $0; 2001: $0; 2002: $0; 2003: $162,192; 2004: $7,743,652; 2005: $8,861,718; 2006: $3,819,122.
Biggest contracts:
$3,623,424 with Army for Miscellaneous Aircraft Accessories and Components. Signed on 2005-08-31. Completion date: 2008-12-31.
$921,256, same as above.Signed on 2006-04-19. Completion date: 2008-12-31.
$896,000, same as above.Signed on 2004-08-23. Completion date: 2008-12-31.
$800,000, same as above.Signed on 2004-12-28. Completion date: 2008-12-31.
LUCAS WESTERN INC (1550 S VALLEY VISTA DRIVE) : $15,519,587 in 81 contractsfrom 1999 to 2005
Contracts for Winches, Hoists, Cranes, and Derricks, Miscellaneous Aircraft Accessories and Components, Maintenance, Repair and Rebuilding of Equipment -- Aircraft and Airframe Structural Components, Valves, Powered, and moreby Navy, Army, Air Force, Defense Logistics Agency, and others Signed by year:2000: $1,558,598; 2001: $3,073,018; 2002: $5,622,960; 2003: $0; 2004: -$32,278; 2005: $1,274,574; 2006: $0.
Biggest contracts:
$4,022,715 with Navy for Winches, Hoists, Cranes, and Derricks. Signed on 1999-10-01. Completion date: 2000-03-15.
$2,479,884 with Army for Miscellaneous Aircraft Accessories and Components. Signed on 2002-09-29. Completion date: 2007-09-30.
$1,683,006, same as above.Signed on 2002-01-24. Completion date: 2002-10-30.
$1,274,574, same as above.Signed on 2005-09-27. Completion date: 2007-09-30.
ELECTRO DISTRIBUTING INTERNATI (1537 MEADOWGLEN ROAD; small business) : $460,922 in 12 contractsfrom 2001 to 2003
Contracts for ADP Support Equipment, ADP Input/Output and Storage Devices, ADP Central Processing Unit (CPU, Computer), Digital, Electrical Hardware and Supplies by Army, Navy, NASA, Air Force, and others Signed by year:2000: $0; 2001: $137,104; 2002: $317,818; 2003: $6,000; 2004: $0; 2005: $0; 2006: $0.
Biggest contracts:
$116,200 with Army for ADP Support Equipment. Taking place in NE. Signed on 2002-05-31. Completion date: 2002-06-19.
$54,425 with Army for ADP Input/Output and Storage Devices. Taking place in NE. Signed on 2001-05-14. Completion date: 2001-05-29.
$51,842, same as above.Signed on 2002-05-28. Completion date: 2002-06-13.
$40,750 with Army for ADP Support Equipment. Taking place in NE. Signed on 2002-06-28. Completion date: 2002-07-25.
SEMA (1575 S VALLEY VISTA DR)
$62,365 with Army for Signs, Advertising Displays, and Identification Plates. Signed on 2004-04-09. Completion date: 2004-11-05.
ILAHI ENGINEERING INC (1144 S DIAMOND BAR BLVD; small business)
$57,840 with U.S. Special Operations Command for Miscellaneous Aircraft Accessories and Components. Signed on 2004-04-27. Completion date: 2004-05-19.
FLOWERS, TIFFANY M (324 S DIAMOND BAR BLVD #2; small business)
$52,990 with Navy for Miscellaneous Prefabricated Structures. Taking place in HI. Signed on 2004-09-21. Completion date: 2004-12-27.
SPARTAN TEMPORARY SERVICE (324 S DIAMOND BAR, SUITE 2; small business) : $13,827 in 2 contractsfrom 2001 to 2002
$7,214 with U.S. Army Corps of Engineers - civil program financing only for Personal Care Services (includes such services as barber and beauty shop, shoe repairs, tailoring, etc.). Signed on 2002-01-09. Completion date: 2002-03-11.
$6,613, same as above.Signed on 2001-10-03. Completion date: 2001-12-15.
VAKIL, VIRESH (20955 PATHFINDER RD; small business)
$6,728 with Navy for Miscellaneous Electrical and Electronic Components. Signed on 2005-03-14. Completion date: 2005-03-14.
Top industries in this zip code by the number of employees in 2005:


 Nearest zip codes: 91789, 92823, 91748, 91768, 91766, 91709.