Estimated zip code population in 2022: 12,427 Zip code population in 2010: 13,154 Zip code population in 2000: 13,938
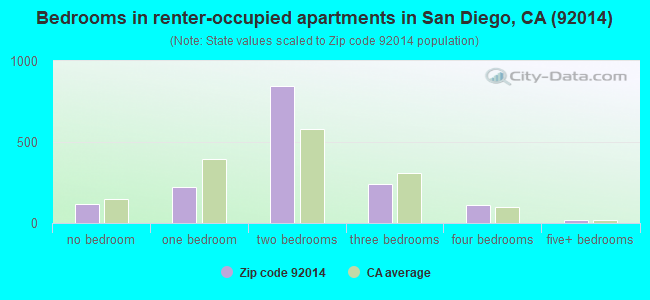
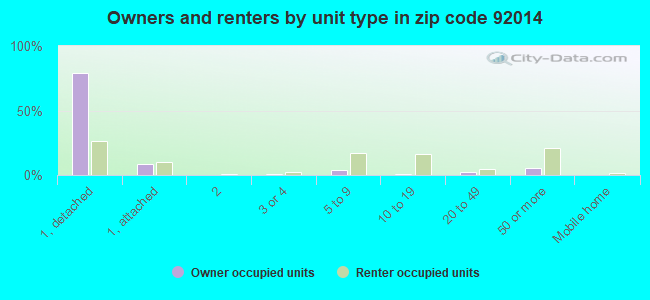
Houses and condos: 6,656 Renter-occupied apartments: 1,554
% of renters here:
28%
State:
44%
March 2022 cost of living index in zip code 92014: 128.5 (high, U.S. average is 100)
Land area: 6.0 sq. mi. Water area: 0.5 sq. mi.
Population density: 2,061 people per square mile
(low).
OSM Map
General Map
Google Map
MSN Map
OSM Map
General Map
Google Map
MSN Map
OSM Map
General Map
Google Map
MSN Map
OSM Map
General Map
Google Map
MSN Map
Please wait while loading the map...
Real estate property taxes paid for housing units in 2022:
This zip code:
0.5% ($9,914)
California:
0.7% ($4,831)
Median real estate property taxes paid for housing units with mortgages in 2022: $10,330 (0.5%) Median real estate property taxes paid for housing units with no mortgage in 2022: $7,337 (0.3%)
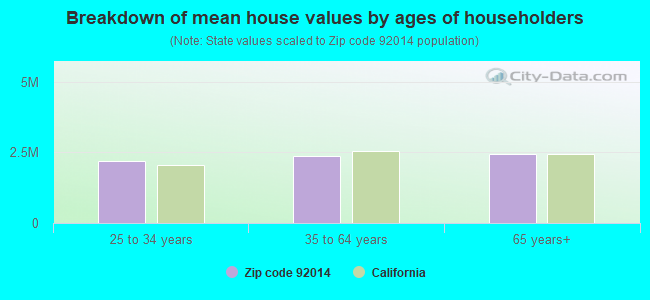
Estimated median house/condo value in 2022: $2,171,698
92014:
$2,171,698
California:
$715,900
Median resident age:
This zip code:
53.8 years
California median age:
37.9 years
Average household size:
This zip code:
2.2 people
California:
2.8 people
Averages for the 2020 tax year for zip code 92014, filed in 2021:
Average Adjusted Gross Income (AGI) in 2020: $318,363 (Individual Income Tax Returns)
Here:
$318,363
State:
$95,910
Salary/wage: $209,792 (reported on 66.3% of returns)
Here:
$209,792
State:
$77,331
(% of AGI for various income ranges: 1229.9% for AGIs below $25k, 3685.2% for AGIs $25k-50k, 6499.2% for AGIs $50k-75k, 10153.6% for AGIs $75k-100k, 19172.2% for AGIs $100k-200k, 168573.7% for AGIs over 200k)
Taxable interest for individuals: $8,523 (reported on 63.9% of returns)
This zip code:
$8,523
California:
$2,294
(% of AGI for various income ranges: 73.1% for AGIs below $25k, 235.5% for AGIs $25k-50k, 234.1% for AGIs $50k-75k, 324.3% for AGIs $75k-100k, 868.5% for AGIs $100k-200k, 6421.0% for AGIs over 200k)
Ordinary dividends: $29,271 (reported on 57.7% of returns)
Here:
$29,271
State:
$10,949
(% of AGI for various income ranges: 203.4% for AGIs below $25k, 439.3% for AGIs $25k-50k, 699.5% for AGIs $50k-75k, 1263.6% for AGIs $75k-100k, 2402.0% for AGIs $100k-200k, 20403.7% for AGIs over 200k)
Net capital gain/loss in AGI: +$121,014 (reported on 56.4% of returns)
Here:
+$121,014
State:
+$49,306
(% of AGI for various income ranges: 87.9% for AGIs below $25k, 303.6% for AGIs $25k-50k, 411.0% for AGIs $50k-75k, 962.9% for AGIs $75k-100k, 2238.9% for AGIs $100k-200k, 96747.5% for AGIs over 200k)
Profit/loss from business: +$58,265 (reported on 25.6% of returns)
Here:
+$58,265
State:
+$15,671
(% of AGI for various income ranges: 268.7% for AGIs below $25k, 781.2% for AGIs $25k-50k, 962.6% for AGIs $50k-75k, 885.4% for AGIs $75k-100k, 2077.5% for AGIs $100k-200k, 17476.1% for AGIs over 200k)
Taxable individual retirement arrangement distribution: $44,169 (reported on 15.7% of returns)
92014:
$44,169
California:
$23,505
(% of AGI for various income ranges: 100.3% for AGIs below $25k, 294.5% for AGIs $25k-50k, 535.4% for AGIs $50k-75k, 1173.2% for AGIs $75k-100k, 2574.0% for AGIs $100k-200k, 6015.7% for AGIs over 200k)
Self-employed (Keogh) retirement plans: $38,725 (reported on 4.8% of returns)
92014:
$38,725
California:
$30,163
(% of AGI for various income ranges: 140.3% for AGIs $50k-75k, 247.6% for AGIs $100k-200k, 2359.2% for AGIs over 200k)
Total itemized deductions: $66,351 (reported on 34.9% of returns)
Here:
$66,351
State:
$39,517
(% of AGI for various income ranges: 457.6% for AGIs below $25k, 912.9% for AGIs $25k-50k, 1288.7% for AGIs $50k-75k, 1909.3% for AGIs $75k-100k, 4037.8% for AGIs $100k-200k, 26345.1% for AGIs over 200k)
Charity contributions: $33,784 (reported on 30.4% of returns)
Here:
$33,784
State:
$12,598
(% of AGI for various income ranges: 17.6% for AGIs below $25k, 67.9% for AGIs $25k-50k, 118.2% for AGIs $50k-75k, 205.0% for AGIs $75k-100k, 520.7% for AGIs $100k-200k, 14259.8% for AGIs over 200k)
Taxes paid: $9,190 (reported on 34.9% of returns)
92014:
$9,190
State:
$8,807
(% of AGI for various income ranges: 88.5% for AGIs below $25k, 172.6% for AGIs $25k-50k, 265.6% for AGIs $50k-75k, 448.6% for AGIs $75k-100k, 926.0% for AGIs $100k-200k, 3014.5% for AGIs over 200k)
Earned income credit: $1,145 (reported on 3.9% of returns)
Here:
$1,145
State:
$2,074
(% of AGI for various income ranges: 31.5% for AGIs below $25k, 28.8% for AGIs $25k-50k)
Percentage of individuals using paid preparers for their 2020 taxes: 93.1%
Here:
93%
State:
92%
(% for various income ranges: 89.7% for AGIs below $25k, 92.5% for AGIs $25k-50k, 91.9% for AGIs $50k-75k, 95.0% for AGIs $75k-100k, 92.5% for AGIs $100k-200k, 95.5% for AGIs over 200k)
Averages for the 2012 tax year for zip code 92014, filed in 2013:
Average Adjusted Gross Income (AGI) in 2012: $224,833 (Individual Income Tax Returns)
Here:
$224,833
State:
$72,726
Salary/wage: $148,245 (reported on 68.3% of returns)
Here:
$148,245
State:
$59,079
(% of AGI for various income ranges: 56.0% for AGIs below $25k, 62.7% for AGIs $25k-50k, 55.0% for AGIs $50k-75k, 56.2% for AGIs $75k-100k, 55.3% for AGIs $100k-200k, 41.8% for AGIs over 200k)
Taxable interest for individuals: $7,472 (reported on 63.0% of returns)
This zip code:
$7,472
California:
$2,146
(% of AGI for various income ranges: 4.8% for AGIs below $25k, 2.8% for AGIs $25k-50k, 2.6% for AGIs $50k-75k, 2.8% for AGIs $75k-100k, 2.0% for AGIs $100k-200k, 2.0% for AGIs over 200k)
Ordinary dividends: $23,128 (reported on 52.8% of returns)
Here:
$23,128
State:
$9,308
(% of AGI for various income ranges: 9.7% for AGIs below $25k, 6.2% for AGIs $25k-50k, 7.2% for AGIs $50k-75k, 5.3% for AGIs $75k-100k, 5.2% for AGIs $100k-200k, 5.3% for AGIs over 200k)
Net capital gain/loss in AGI: +$92,389 (reported on 50.8% of returns)
Here:
+$92,389
State:
+$30,460
(% of AGI for various income ranges: 0.4% for AGIs below $25k, 2.7% for AGIs $25k-50k, 1.5% for AGIs $50k-75k, 2.0% for AGIs $75k-100k, 3.9% for AGIs $100k-200k, 26.0% for AGIs over 200k)
Profit/loss from business: +$35,751 (reported on 28.4% of returns)
Here:
+$35,751
State:
+$17,064
(% of AGI for various income ranges: 19.7% for AGIs below $25k, 8.6% for AGIs $25k-50k, 8.4% for AGIs $50k-75k, 6.5% for AGIs $75k-100k, 6.3% for AGIs $100k-200k, 3.7% for AGIs over 200k)
Taxable individual retirement arrangement distribution: $36,956 (reported on 17.9% of returns)
92014:
$36,956
California:
$19,557
(% of AGI for various income ranges: 6.5% for AGIs below $25k, 4.6% for AGIs $25k-50k, 4.5% for AGIs $50k-75k, 6.6% for AGIs $75k-100k, 6.9% for AGIs $100k-200k, 2.0% for AGIs over 200k)
Self-employment retirement plans: $35,355 (reported on 5.1% of returns)
92014:
$35,355
California:
$24,530
(% of AGI for various income ranges: 1.1% for AGIs below $25k, 2.3% for AGIs $50k-75k, 1.0% for AGIs $100k-200k, 0.8% for AGIs over 200k)
Total itemized deductions: $70,022 (21% of AGI, reported on 61.8% of returns)
Here:
$70,022
State:
$34,004
Here:
20.6% of AGI
State:
22.7% of AGI
(% of AGI for various income ranges: 42.7% for AGIs below $25k, 23.1% for AGIs $25k-50k, 23.0% for AGIs $50k-75k, 21.6% for AGIs $75k-100k, 23.2% for AGIs $100k-200k, 17.9% for AGIs over 200k)
Charity contributions: $13,803 (reported on 53.1% of returns)
Here:
$13,803
State:
$4,659
(% of AGI for various income ranges: 1.4% for AGIs below $25k, 1.6% for AGIs $25k-50k, 2.0% for AGIs $50k-75k, 1.9% for AGIs $75k-100k, 2.1% for AGIs $100k-200k, 3.6% for AGIs over 200k)
Taxes paid: $35,131 (reported on 61.3% of returns)
92014:
$35,131
State:
$14,448
(% of AGI for various income ranges: 11.2% for AGIs below $25k, 5.5% for AGIs $25k-50k, 6.4% for AGIs $50k-75k, 6.9% for AGIs $75k-100k, 9.1% for AGIs $100k-200k, 10.0% for AGIs over 200k)
Earned income credit: $1,031 (reported on 4.8% of returns)
Here:
$1,031
State:
$2,286
(% of AGI for various income ranges: 1.6% for AGIs below $25k, 0.2% for AGIs $25k-50k)
Percentage of individuals using paid preparers for their 2012 taxes: 66.7%
Here:
67%
State:
64%
(% for various income ranges: 58.9% for AGIs below $25k, 56.0% for AGIs $25k-50k, 64.0% for AGIs $50k-75k, 62.9% for AGIs $75k-100k, 68.2% for AGIs $100k-200k, 81.8% for AGIs over 200k)
Averages for the 2004 tax year for zip code 92014, filed in 2005:
Average Adjusted Gross Income (AGI) in 2004: $158,698 (Individual Income Tax Returns)
Here:
$158,698
State:
$58,600
Salary/wage: $113,989 (reported on 68.8% of returns)
Here:
$113,989
State:
$49,455
(% of AGI for various income ranges: 58.0% for AGIs $10k-25k, 63.2% for AGIs $25k-50k, 59.5% for AGIs $50k-75k, 58.1% for AGIs $75k-100k, 43.7% for AGIs over 100k)
Taxable interest for individuals: $7,724 (reported on 69.5% of returns)
This zip code:
$7,724
California:
$2,365
(% of AGI for various income ranges: 5.5% for AGIs $10k-25k, 3.9% for AGIs $25k-50k, 3.8% for AGIs $50k-75k, 3.1% for AGIs $75k-100k, 2.9% for AGIs over 100k)
Taxable dividends: $10,691 (reported on 56.9% of returns)
Here:
$10,691
State:
$4,746
(% of AGI for various income ranges: 5.9% for AGIs $10k-25k, 4.4% for AGIs $25k-50k, 3.8% for AGIs $50k-75k, 4.8% for AGIs $75k-100k, 3.2% for AGIs over 100k)
Net capital gain/loss: +$60,315 (reported on 54.2% of returns)
Here:
+$60,315
State:
+$23,418
(% of AGI for various income ranges: 1.4% for AGIs $10k-25k, 2.3% for AGIs $25k-50k, 2.0% for AGIs $50k-75k, 3.3% for AGIs $75k-100k, 21.7% for AGIs over 100k)
Profit/loss from business: +$34,710 (reported on 28.5% of returns)
Here:
+$34,710
State:
+$16,826
(% of AGI for various income ranges: 17.2% for AGIs $10k-25k, 10.1% for AGIs $25k-50k, 9.2% for AGIs $50k-75k, 8.4% for AGIs $75k-100k, 5.2% for AGIs over 100k)
IRA payment deduction: $3,733 (reported on 3.8% of returns)
92014:
$3,733
California:
$3,192
(% of AGI for various income ranges: 0.4% for AGIs $10k-25k, 0.3% for AGIs $25k-50k, 0.3% for AGIs $50k-75k, 0.3% for AGIs $75k-100k, 0.0% for AGIs over 100k)
Self-employed pension: $24,545 (reported on 6.8% of returns)
Here:
$24,545
California:
$17,688
(% of AGI for various income ranges: 0.5% for AGIs $10k-25k, 0.7% for AGIs $25k-50k, 0.9% for AGIs $50k-75k, 1.2% for AGIs $75k-100k, 1.0% for AGIs over 100k)
Total itemized deductions: $52,272 (19% of AGI, reported on 57.6% of returns)
Here:
$52,272
State:
$28,113
Here:
19.2% of AGI
State:
25.3% of AGI
(% of AGI for various income ranges: 33.0% for AGIs $10k-25k, 22.4% for AGIs $25k-50k, 24.6% for AGIs $50k-75k, 27.0% for AGIs $75k-100k, 16.5% for AGIs over 100k)
Charity contributions deductions: $7,980 (3% of AGI, reported on 51.5% of returns)
Here:
$7,980
State:
$3,923
Here:
2.8% of AGI
State:
3.3% of AGI
(% of AGI for various income ranges: 1.8% for AGIs $10k-25k, 1.8% for AGIs $25k-50k, 2.3% for AGIs $50k-75k, 2.4% for AGIs $75k-100k, 2.5% for AGIs over 100k)
Total tax: $40,821 (reported on 84.1% of returns)
92014:
$40,821
State:
$10,761
(% of AGI for various income ranges: 6.6% for AGIs $10k-25k, 9.3% for AGIs $25k-50k, 11.6% for AGIs $50k-75k, 12.4% for AGIs $75k-100k, 21.7% for AGIs over 100k)
Earned income credit: $749 (reported on 4.2% of returns)
Here:
$749
State:
$1,763
Percentage of individuals using paid preparers for their 2004 taxes: 67.1%
Here:
67%
State:
66%
(% for various income ranges: 61.3% for AGIs below $10k, 62.5% for AGIs $10k-25k, 55.4% for AGIs $25k-50k, 64.9% for AGIs $50k-75k, 66.4% for AGIs $75k-100k, 78.0% for AGIs over 100k)
Household received Food Stamps/SNAP in the past 12 months: 100 Household did not receive Food Stamps/SNAP in the past 12 months: 5,354
Women who had a birth in the past 12 months: 77 (77 now married, 0 unmarried) Women who did not have a birth in the past 12 months: 1,858 (1,065 now married, 779 unmarried)
Housing units in zip code 92014 with a mortgage: 2,494 (137 second mortgage, 143 both second mortgage and home equity loan) Houses without a mortgage: 70
Median monthly owner costs for units with a mortgage: $3,876 Median monthly owner costs for units without a mortgage: $1,365
Residents with income below the poverty level in 2022:
This zip code:
4.0%
Whole state:
12.2%
Residents with income below 50% of the poverty level in 2022:
This zip code:
2.8%
Whole state:
6.2%
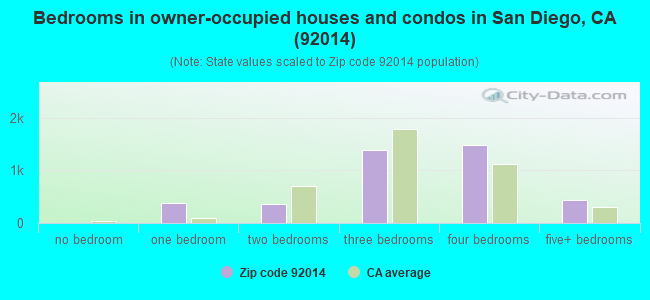
Median number of rooms in houses and condos:
Here:
7.0
State:
6.0
Median number of rooms in apartments:
Here:
4.1
State:
3.9
Notable locations in this zip code not listed on our city pages
Notable locations in zip code 92014: Del Mar Race Track (A), Del Mar Branch San Diego County Library (B), Del Mar Fire Department (C). Display/hide their locations on the map
Shopping Centers: Del Mar Plaza Shopping Center (1), Plaza Carmel Shopping Center (2), Del Mar Heights Village Shopping Center (3), Del Mar Heights Shopping Center (4). Display/hide their locations on the map
Parks in zip code 92014 include: North Bluff Preserve (1), San Diego County Fairgrounds (2), Seagrove Park (3), Surf and Turf Recreation Center (4). Display/hide their locations on the map
In group quarters: 50 (-1 institutionalized population)
Size of family households: 2,324 2-persons, 513 3-persons, 684 4-persons, 100 5-persons, 18 7-or-more-persons
Size of nonfamily households: 1,375 1-person, 583 2-persons, 24 4-persons
1,639 married couples with children.
284 single-parent households (90 men, 194 women).
91.1% of residents of 92014 zip code speak English at home.
2.5% of residents speak Spanish at home (79% very well, 21% well).
4.1% of residents speak other Indo-European language at home (92% very well, 7% well, 1% not well).
2.4% of residents speak Asian or Pacific Island language at home (87% very well, 9% well, 4% not well).
0.4% of residents speak other language at home (100% very well).
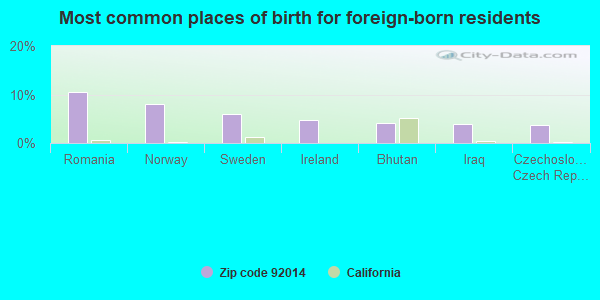
Foreign born population: 1,834 (14.8%) (82.2% of them are naturalized citizens)
This zip code:
14.8%
Whole state:
26.7%
11%Romania
8%Norway
6%Sweden
5%Ireland
4%Bhutan
4%Iraq
4%Czechoslovakia (includes Czech Republic and Slovakia)
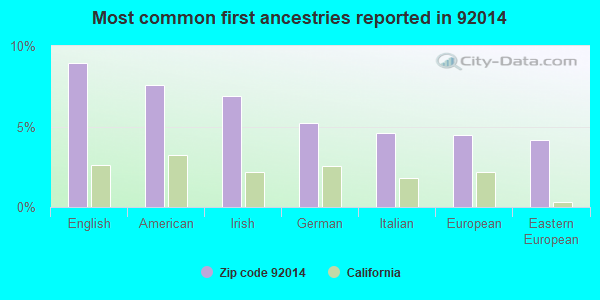
9%English
8%American
7%Irish
5%German
5%Italian
4%European
4%Eastern European
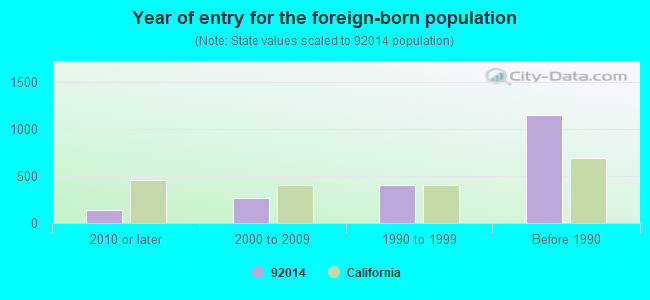
Year of entry for the foreign-born population
1402010 or later
2672000 to 2009
4001990 to 1999
1,145Before 1990
Facilities with environmental interests located in this zip code:
FOOTE PHOTO CO (2260 JIMMY DURANTE BLVD in DEL MAR, CA)
STATE MASTER (California - Hazardous Waste Tracking) - HAZARDOU WASTE PROGRAM Small Quantity Generators, between 100 kg and 1000 kg of hazardous waste/month (Resource Conservation and Recovery Act (tracking hazardous waste)) - notification Organizations: ROBIN GRAY (CONTACT/OWNER)
CHEVRON NO 98561 (941 CAMINO DEL MAR in DEL MAR, CA)
CRITERIA AND HAZARDOUS AIR POLLUTANT INVENTORY (Inventory of air pollution sources) HAZARDOUS WASTE BIENNIAL REPORTER (Resource Conservation and Recovery Act (tracking hazardous waste)) Large Quantity Generators, more that 1000 kg of hazardous waste/month (Resource Conservation and Recovery Act (tracking hazardous waste)) Business SIC classification: GASOLINE SERVICE STATIONS Organizations: CHEVRON PRODUCTS CO (CONTACT/OWNER)
Alternative names: DEL MAR ULTRAMAR / CHEVRON
EXXONMOBIL OIL CORP. (2750 VIA DE LA VALLE in DEL MAR, CA)
HAZARDOUS WASTE BIENNIAL REPORTER (Resource Conservation and Recovery Act (tracking hazardous waste)) Large Quantity Generators, more that 1000 kg of hazardous waste/month (Resource Conservation and Recovery Act (tracking hazardous waste)) Organizations: EXXONMOBIL OIL CORPORATION (CONTACT/OWNER)
CHEVRON STATION 94038 (3063 CARMEL VALLEY RD in DEL MAR, CA)
Small Quantity Generators, between 100 kg and 1000 kg of hazardous waste/month (Resource Conservation and Recovery Act (tracking hazardous waste)) Organizations: CHEVRON USA PRODUCTS CO (CONTACT/OWNER)
MOBIL OIL / DEL MAR (2750 VIA DE LA VALLE & SAN AND in DEL MAR, CA)
CRITERIA AND HAZARDOUS AIR POLLUTANT INVENTORY (Inventory of air pollution sources) Business SIC classification: GASOLINE SERVICE STATIONS
CA ST OF 22ND DISTRICT AGRIC A (2260 JIMMY DURANTE BL in DEL MAR, CA)
CRITERIA AND HAZARDOUS AIR POLLUTANT INVENTORY (Inventory of air pollution sources) Business SIC classification: AMUSEMENT AND RECREATION SERVICES
Housing units lacking complete plumbing facilities: 0.5% Housing units lacking complete kitchen facilities: 0.5%
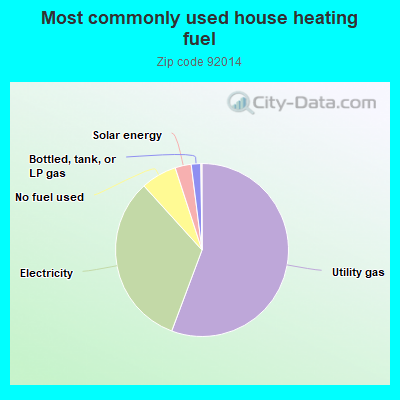
55.7%Utility gas
32.6%Electricity
6.7%No fuel used
3.0%Solar energy
1.8%Bottled, tank, or LP gas
Population in 1990: 19,885.
Place of birth for U.S.-born residents:
This state: 4,704
Northeast: 2,046
Midwest: 1,759
South: 951
West: 804
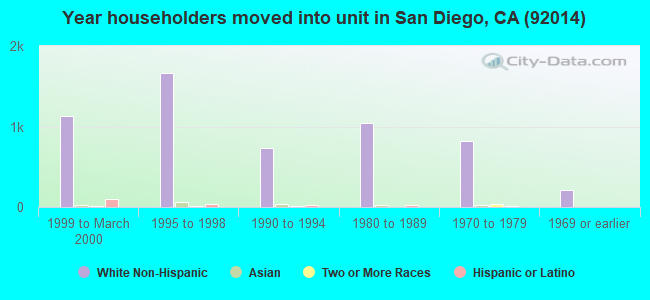
55% of the 92014 zip code residents lived in the same house 5 years ago. Out of people who lived in different houses, 60% lived in this county. Out of people who lived in different counties, 50% lived in California.
86% of the 92014 zip code residents lived in the same house 1 year ago. Out of people who lived in different houses, 55% moved from this county. Out of people who lived in different houses, 22% moved from different county within same state. Out of people who lived in different houses, 21% moved from different state. Out of people who lived in different houses, 1% moved from abroad.
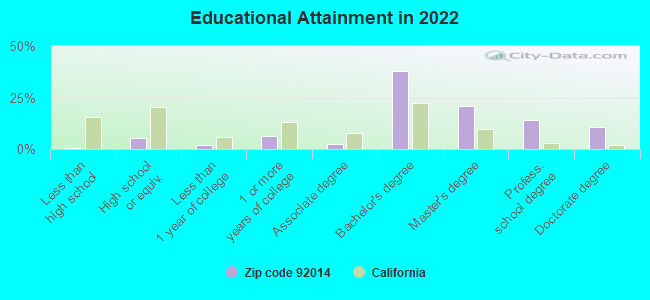
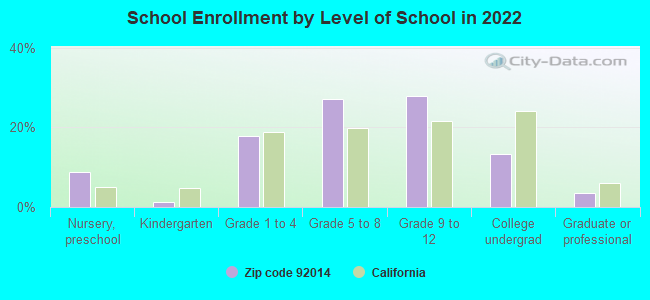
Private vs. public school enrollment:
Students in private schools in grades 1 to 8 (elementary and middle school): 269
Here:
28.5%
California:
10.5%
Students in private schools in grades 9 to 12 (high school): 165
Here:
28.7%
California:
8.5%
Students in private undergraduate colleges: 74
Here:
26.8%
California:
15.9%
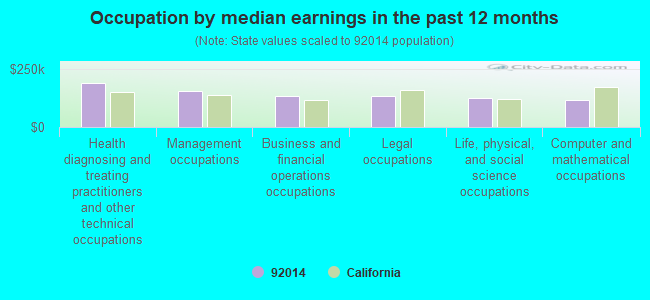
Occupation by median earnings in the past 12 months ($)
188,896Health diagnosing and treating practitioners and other technical occupations
156,159Management occupations
135,228Business and financial operations occupations
133,391Legal occupations
123,247Life, physical, and social science occupations
117,707Computer and mathematical occupations
Companies with biggest federal contracts located in this zip code (DEL MAR, CA):
TMMT, INC (4664 VISTA DE LA TIERRA; small business) : $3,436,968 in 12 contractsfrom 2000 to 2004
Contracts for Defense Aircraft -- Management and Support (R&D), Defense Aircraft -- Basic Research (R&D), Weapons -- Management and Support (R&D), Defense Missile and Space Systems -- Applied Research and Exploratory Development (R&D), and moreby Air Force, Navy Signed by year:2000: $99,964; 2001: $474,925; 2002: $818,392; 2003: $543,762; 2004: $1,499,925; 2005: $0; 2006: $0.
Biggest contracts:
$749,996 with Air Force for Defense Aircraft -- Management and Support (R&D). Signed on 2004-03-29. Completion date: 2006-07-17.
$375,000 with Air Force for Defense Aircraft -- Basic Research (R&D). Signed on 2004-07-28. Completion date: 2006-09-22.
$375,000 with Air Force for Weapons -- Management and Support (R&D). Signed on 2002-05-14. Completion date: 2004-09-30.
$375,000 with Air Force for Defense Missile and Space Systems -- Applied Research and Exploratory Development (R&D). Signed on 2001-04-06. Completion date: 2003-08-13.
REMEC INC (3790 VIA DE LA VALLE; small business) 750 employees, $0 revenue. : $2,306,529 in 24 contractsfrom 1999 to 2001
Contracts for Miscellaneous Communication Equipment, Electronic Modules, Oscillators and Piezoelectric Crystals, Amplifiers, and moreby Air Force, Defense Logistics Agency, Navy Signed by year:2000: $825,922; 2001: $1,421,287; 2002: $0; 2003: $0; 2004: $0; 2005: $0; 2006: $0.
Biggest contracts:
$343,000 with Air Force for Miscellaneous Communication Equipment. Signed on 2001-09-30. Completion date: 2003-06-30.
$291,250 with Air Force for Electronic Modules. Signed on 2001-05-14. Completion date: 2002-06-28.
$276,608 with Air Force for Oscillators and Piezoelectric Crystals. Signed on 2001-07-16. Completion date: 2002-10-31.
$258,364 with Air Force for Amplifiers. Signed on 2001-08-31. Completion date: 2002-10-31.
LUTRONIX CORPORATION (13627 PORTOFINO DR; small business) : $898,546 in 4 contractsfrom 1999 to 2002
$373,458 with Army for Other Defense -- Basic Research (R&D). Signed on 2001-05-15. Completion date: 2002-05-15.
$355,575, same as above.Signed on 2002-04-16. Completion date: 2003-04-16.
$99,537 with Army for Other ADP and Telecommunications Services (includes data storage on tapes, compact disks, etc.). Signed on 2000-04-27. Completion date: 2000-08-31.
$69,976 with Army for Other Defense -- Basic Research (R&D). Signed on 1999-12-07. Completion date: 2000-12-10.
POLYCOMP TECHNOLOGIES, INC (13963 RECUERDO DR; small business) : $739,909 in 5 contractsfrom 2000 to 2003
Contracts for Physical Sciences -- Management and Support (R&D), Defense Aircraft -- Management and Support (R&D), Other Defense -- Basic Research (R&D), Other Research and Development -- Advanced Development (R&D) by Air Force, Navy Signed by year:2000: $251,821; 2001: $248,140; 2002: $169,949; 2003: $69,999; 2004: $0; 2005: $0; 2006: $0.
Biggest contracts:
$251,821 with Air Force for Physical Sciences -- Management and Support (R&D). Signed on 2000-07-11. Completion date: 2002-07-14.
$248,140, same as above.Signed on 2001-03-01. Completion date: 2002-07-14.
$99,956 with Air Force for Defense Aircraft -- Management and Support (R&D). Signed on 2002-04-05. Completion date: 2003-01-20.
$69,999 with Navy for Other Defense -- Basic Research (R&D). Taking place in WA. Signed on 2003-07-08. Completion date: 2003-12-22.
SUSAN M JONES (2113 CAMINITO DEL BARCO; small business) : $436,339 in 9 contractsfrom 1999 to 2005
Contracts for Other Medical Services, Dentistry Services by Navy Signed by year:2000: $51,952; 2001: $71,127; 2002: $75,168; 2003: $80,688; 2004: $0; 2005: $93,600; 2006: $0.
Biggest contracts:
$93,600 with Navy for Other Medical Services. Signed on 2005-10-20. Completion date: 2006-09-30.
$79,648 with Navy for Dentistry Services. Signed on 2003-10-01. Completion date: 2004-09-30.
$75,168, same as above.Signed on 2002-10-01. Completion date: 2003-09-30.
$73,080, same as above.Signed on 2001-10-01. Completion date: 2001-09-20.
UNIVERSITY OF CALIFORNIA-SAN D (13756 DURANGE)
$213,629 with National Institutes of Health for Biomedical -- Applied Research and Exploratory Development (R&D). Signed on 2004-04-15. Completion date: 2004-10-31.
HOAR, J P & ASSOCIATES INC (386 13TH ST; small business) : $63,200 in 2 contractsfrom 2005 to 2006
$31,600 with Army for Education Services. Signed on 2006-01-12. Completion date: 2005-12-31.
$31,600, same as above.Signed on 2005-01-12. Completion date: 2005-12-31.
PRISM INFOSYSTEMS (12878 CAMINITO DE LAS OLAS; small business) : $55,691 in 2 contractsfrom 2000 to 2005
$31,482 with Navy for Maintenance, Repair and Rebuilding of Equipment -- Automatic Data Processing Equipment (Including Firmware), Software, Supplies and Support Equipment. Signed on 2000-09-23. Completion date: 2001-03-20.
$24,209 with Navy for Modification of Equipment -- Hardware and Abrasives. Signed on 2005-09-15. Completion date: 2006-04-19.
HOMELAND SECURITY TECHNOLOGY I (1201 COMINO DELMAR; small business) : $40,652 in 2 contractsin 2005
$36,252 with Navy for Individual Equipment. Signed on 2005-08-09. Completion date: 2005-08-19.
$4,400 with Navy for Motor Vehicle Maintenance and Repair Shop Specialized Equipment. Signed on 2005-01-12. Completion date: 2005-01-14.
SANDGLASS SYSTEMS (4463 NORTH LN; small business)
$4,765 with Army for ADP Software. Taking place in VA. Signed on 2002-07-25. Completion date: 2002-08-12.
Top industries in this zip code by the number of employees in 2005:
2005 - 2018 National Fire Incident Reporting System (NFIRS) incidents
According to the data from the years 2005 - 2018 the average number of fire incidents per year is 27. The highest number of reported fires - 54 took place in 2017, and the least - 2 in 2006. The data has a rising trend.
When looking into fire subcategories, the most incidents belonged to: Structure Fires (58.3%), and Mobile Property/Vehicle Fires (17.1%).
Fire incident types reported to NFIRS in Zip Code 92014

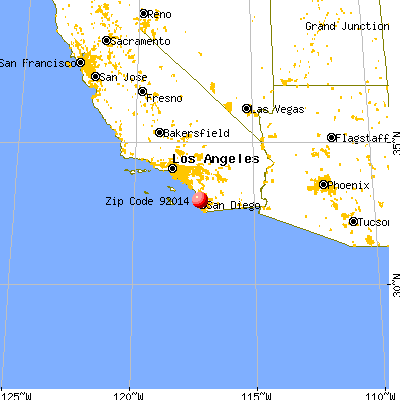


 Nearest zip codes: 92075, 92130, 92091, 92007, 92121, 92067.
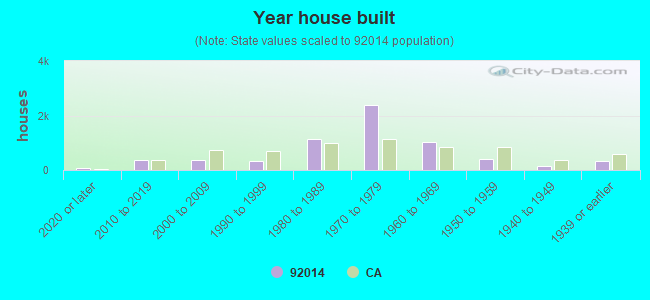


 According to the data from the years 2005 - 2018 the average number of fire incidents per year is 27. The highest number of reported fires - 54 took place in 2017, and the least - 2 in 2006. The data has a rising trend.
 When looking into fire subcategories, the most incidents belonged to: Structure Fires (58.3%), and Mobile Property/Vehicle Fires (17.1%).