Estimated zip code population in 2022: 52,578 Zip code population in 2010: 42,906 Zip code population in 2000: 6,748
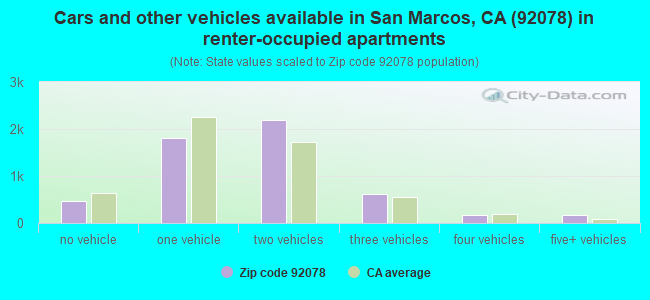
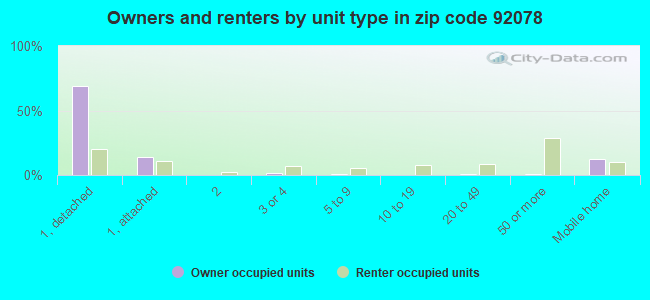
Houses and condos: 19,361 Renter-occupied apartments: 5,439
% of renters here:
30%
State:
44%
March 2022 cost of living index in zip code 92078: 123.1 (high, U.S. average is 100)
Land area: 16.7 sq. mi. Water area: 0.1 sq. mi.
Population density: 3,149 people per square mile
(average).
OSM Map
General Map
Google Map
MSN Map
OSM Map
General Map
Google Map
MSN Map
OSM Map
General Map
Google Map
MSN Map
OSM Map
General Map
Google Map
MSN Map
Please wait while loading the map...
Real estate property taxes paid for housing units in 2022:
This zip code:
0.8% ($6,778)
California:
0.7% ($4,831)
Median real estate property taxes paid for housing units with mortgages in 2022: $7,896 (0.8%) Median real estate property taxes paid for housing units with no mortgage in 2022: $3,783 (0.6%)
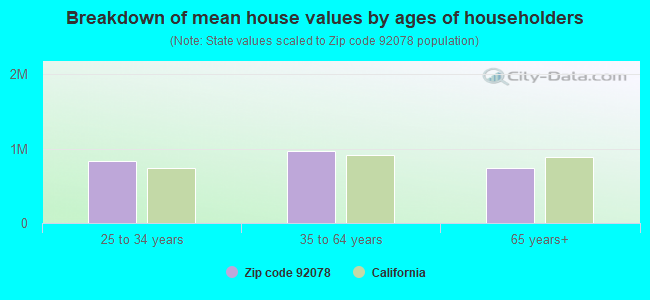
Estimated median house/condo value in 2022: $855,214
92078:
$855,214
California:
$715,900
According to our research of California and other state lists, there were 2 registered sex offenders living in 92078 zip code as of April 24, 2024. The ratio of all residents to sex offenders in zip code 92078 is 24,349 to 1. The ratio of registered sex offenders to all residents in this zip code is much lower than the state average.
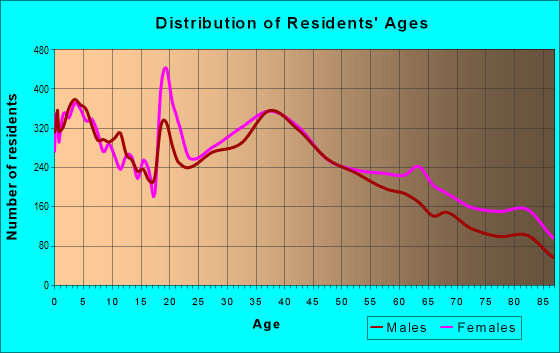
Median resident age:
This zip code:
38.3 years
California median age:
37.9 years
Average household size:
This zip code:
2.8 people
California:
2.8 people
Averages for the 2020 tax year for zip code 92078, filed in 2021:
Average Adjusted Gross Income (AGI) in 2020: $104,272 (Individual Income Tax Returns)
Here:
$104,272
State:
$95,910
Salary/wage: $96,033 (reported on 77.8% of returns)
Here:
$96,033
State:
$77,331
(% of AGI for various income ranges: 1112.0% for AGIs below $25k, 3732.9% for AGIs $25k-50k, 6753.1% for AGIs $50k-75k, 10650.2% for AGIs $75k-100k, 21097.6% for AGIs $100k-200k, 90183.7% for AGIs over 200k)
Taxable interest for individuals: $1,423 (reported on 44.4% of returns)
This zip code:
$1,423
California:
$2,294
(% of AGI for various income ranges: 32.6% for AGIs below $25k, 35.4% for AGIs $25k-50k, 75.8% for AGIs $50k-75k, 104.0% for AGIs $75k-100k, 154.6% for AGIs $100k-200k, 663.5% for AGIs over 200k)
Ordinary dividends: $5,407 (reported on 28.2% of returns)
Here:
$5,407
State:
$10,949
(% of AGI for various income ranges: 49.3% for AGIs below $25k, 88.1% for AGIs $25k-50k, 139.2% for AGIs $50k-75k, 250.3% for AGIs $75k-100k, 384.7% for AGIs $100k-200k, 1766.3% for AGIs over 200k)
Net capital gain/loss in AGI: +$20,122 (reported on 28.1% of returns)
Here:
+$20,122
State:
+$49,306
(% of AGI for various income ranges: 18.6% for AGIs below $25k, 58.2% for AGIs $25k-50k, 120.9% for AGIs $50k-75k, 298.1% for AGIs $75k-100k, 686.7% for AGIs $100k-200k, 11350.1% for AGIs over 200k)
Profit/loss from business: +$16,365 (reported on 19.8% of returns)
Here:
+$16,365
State:
+$15,671
(% of AGI for various income ranges: 185.6% for AGIs below $25k, 263.9% for AGIs $25k-50k, 398.9% for AGIs $50k-75k, 568.8% for AGIs $75k-100k, 875.0% for AGIs $100k-200k, 2817.9% for AGIs over 200k)
Taxable individual retirement arrangement distribution: $21,582 (reported on 10.4% of returns)
92078:
$21,582
California:
$23,505
(% of AGI for various income ranges: 78.7% for AGIs below $25k, 161.6% for AGIs $25k-50k, 320.4% for AGIs $50k-75k, 594.3% for AGIs $75k-100k, 851.9% for AGIs $100k-200k, 1309.6% for AGIs over 200k)
Self-employed (Keogh) retirement plans: $22,508 (reported on 1.0% of returns)
92078:
$22,508
California:
$30,163
(% of AGI for various income ranges: 35.5% for AGIs $50k-75k, 43.7% for AGIs $100k-200k, 402.1% for AGIs over 200k)
Total itemized deductions: $35,457 (reported on 23.7% of returns)
Here:
$35,457
State:
$39,517
(% of AGI for various income ranges: 127.0% for AGIs below $25k, 273.8% for AGIs $25k-50k, 762.8% for AGIs $50k-75k, 1305.9% for AGIs $75k-100k, 2721.2% for AGIs $100k-200k, 9647.4% for AGIs over 200k)
Charity contributions: $6,094 (reported on 19.5% of returns)
Here:
$6,094
State:
$12,598
(% of AGI for various income ranges: 6.7% for AGIs below $25k, 21.9% for AGIs $25k-50k, 68.7% for AGIs $50k-75k, 118.1% for AGIs $75k-100k, 315.3% for AGIs $100k-200k, 1782.8% for AGIs over 200k)
Taxes paid: $9,090 (reported on 23.7% of returns)
92078:
$9,090
State:
$8,807
(% of AGI for various income ranges: 27.5% for AGIs below $25k, 65.5% for AGIs $25k-50k, 194.9% for AGIs $50k-75k, 385.6% for AGIs $75k-100k, 827.5% for AGIs $100k-200k, 2134.8% for AGIs over 200k)
Earned income credit: $1,892 (reported on 8.7% of returns)
Here:
$1,892
State:
$2,074
(% of AGI for various income ranges: 58.7% for AGIs below $25k, 53.1% for AGIs $25k-50k, 0.8% for AGIs $50k-75k)
Percentage of individuals using paid preparers for their 2020 taxes: 93.3%
Here:
93%
State:
92%
(% for various income ranges: 91.3% for AGIs below $25k, 92.7% for AGIs $25k-50k, 93.3% for AGIs $50k-75k, 92.7% for AGIs $75k-100k, 94.9% for AGIs $100k-200k, 95.8% for AGIs over 200k)
Averages for the 2012 tax year for zip code 92078, filed in 2013:
Average Adjusted Gross Income (AGI) in 2012: $75,781 (Individual Income Tax Returns)
Here:
$75,781
State:
$72,726
Salary/wage: $70,936 (reported on 78.1% of returns)
Here:
$70,936
State:
$59,079
(% of AGI for various income ranges: 67.3% for AGIs below $25k, 69.9% for AGIs $25k-50k, 70.0% for AGIs $50k-75k, 74.0% for AGIs $75k-100k, 80.2% for AGIs $100k-200k, 67.5% for AGIs over 200k)
Taxable interest for individuals: $1,243 (reported on 45.6% of returns)
This zip code:
$1,243
California:
$2,146
(% of AGI for various income ranges: 1.8% for AGIs below $25k, 1.1% for AGIs $25k-50k, 1.0% for AGIs $50k-75k, 0.7% for AGIs $75k-100k, 0.5% for AGIs $100k-200k, 0.6% for AGIs over 200k)
Ordinary dividends: $4,734 (reported on 25.4% of returns)
Here:
$4,734
State:
$9,308
(% of AGI for various income ranges: 2.8% for AGIs below $25k, 1.7% for AGIs $25k-50k, 2.0% for AGIs $50k-75k, 1.5% for AGIs $75k-100k, 1.2% for AGIs $100k-200k, 1.6% for AGIs over 200k)
Net capital gain/loss in AGI: +$9,668 (reported on 23.3% of returns)
Here:
+$9,668
State:
+$30,460
(% of AGI for various income ranges: 0.2% for AGIs $25k-50k, 0.5% for AGIs $50k-75k, 0.8% for AGIs $75k-100k, 1.1% for AGIs $100k-200k, 8.5% for AGIs over 200k)
Profit/loss from business: +$16,012 (reported on 19.1% of returns)
Here:
+$16,012
State:
+$17,064
(% of AGI for various income ranges: 12.4% for AGIs below $25k, 6.4% for AGIs $25k-50k, 3.9% for AGIs $50k-75k, 3.5% for AGIs $75k-100k, 3.1% for AGIs $100k-200k, 3.1% for AGIs over 200k)
Taxable individual retirement arrangement distribution: $17,998 (reported on 12.4% of returns)
92078:
$17,998
California:
$19,557
(% of AGI for various income ranges: 4.6% for AGIs below $25k, 3.4% for AGIs $25k-50k, 3.8% for AGIs $50k-75k, 3.4% for AGIs $75k-100k, 2.5% for AGIs $100k-200k, 2.5% for AGIs over 200k)
Self-employment retirement plans: $18,369 (reported on 0.8% of returns)
92078:
$18,369
California:
$24,530
(% of AGI for various income ranges: 0.2% for AGIs $50k-75k, 0.2% for AGIs $100k-200k, 0.4% for AGIs over 200k)
Total itemized deductions: $31,897 (25% of AGI, reported on 45.7% of returns)
Here:
$31,897
State:
$34,004
Here:
25.1% of AGI
State:
22.7% of AGI
(% of AGI for various income ranges: 17.5% for AGIs below $25k, 14.8% for AGIs $25k-50k, 17.6% for AGIs $50k-75k, 20.7% for AGIs $75k-100k, 21.4% for AGIs $100k-200k, 18.5% for AGIs over 200k)
Charity contributions: $3,151 (reported on 38.5% of returns)
Here:
$3,151
State:
$4,659
(% of AGI for various income ranges: 0.9% for AGIs below $25k, 1.1% for AGIs $25k-50k, 1.5% for AGIs $50k-75k, 1.8% for AGIs $75k-100k, 1.7% for AGIs $100k-200k, 1.7% for AGIs over 200k)
Taxes paid: $12,946 (reported on 45.6% of returns)
92078:
$12,946
State:
$14,448
(% of AGI for various income ranges: 3.7% for AGIs below $25k, 3.4% for AGIs $25k-50k, 5.1% for AGIs $50k-75k, 6.6% for AGIs $75k-100k, 8.6% for AGIs $100k-200k, 10.4% for AGIs over 200k)
Earned income credit: $2,043 (reported on 11.5% of returns)
Here:
$2,043
State:
$2,286
(% of AGI for various income ranges: 4.3% for AGIs below $25k, 0.9% for AGIs $25k-50k)
Percentage of individuals using paid preparers for their 2012 taxes: 58.8%
Here:
59%
State:
64%
(% for various income ranges: 54.4% for AGIs below $25k, 59.1% for AGIs $25k-50k, 59.4% for AGIs $50k-75k, 60.2% for AGIs $75k-100k, 61.5% for AGIs $100k-200k, 68.3% for AGIs over 200k)
Averages for the 2004 tax year for zip code 92078, filed in 2005:
Average Adjusted Gross Income (AGI) in 2004: $61,892 (Individual Income Tax Returns)
Here:
$61,892
State:
$58,600
Salary/wage: $58,432 (reported on 77.8% of returns)
Here:
$58,432
State:
$49,455
(% of AGI for various income ranges: 66.2% for AGIs $10k-25k, 71.3% for AGIs $25k-50k, 74.4% for AGIs $50k-75k, 78.3% for AGIs $75k-100k, 70.1% for AGIs over 100k)
Taxable interest for individuals: $1,888 (reported on 58.7% of returns)
This zip code:
$1,888
California:
$2,365
(% of AGI for various income ranges: 3.3% for AGIs $10k-25k, 2.2% for AGIs $25k-50k, 1.9% for AGIs $50k-75k, 1.2% for AGIs $75k-100k, 1.4% for AGIs over 100k)
Taxable dividends: $3,501 (reported on 31.2% of returns)
Here:
$3,501
State:
$4,746
(% of AGI for various income ranges: 3.3% for AGIs $10k-25k, 2.1% for AGIs $25k-50k, 1.8% for AGIs $50k-75k, 1.5% for AGIs $75k-100k, 1.4% for AGIs over 100k)
Net capital gain/loss: +$8,368 (reported on 29.6% of returns)
Here:
+$8,368
State:
+$23,418
(% of AGI for various income ranges: -0.4% for AGIs $10k-25k, 0.5% for AGIs $25k-50k, 1.2% for AGIs $50k-75k, 1.6% for AGIs $75k-100k, 6.8% for AGIs over 100k)
Profit/loss from business: +$15,694 (reported on 18.4% of returns)
Here:
+$15,694
State:
+$16,826
(% of AGI for various income ranges: 7.7% for AGIs $10k-25k, 6.0% for AGIs $25k-50k, 4.0% for AGIs $50k-75k, 4.0% for AGIs $75k-100k, 4.2% for AGIs over 100k)
IRA payment deduction: $3,071 (reported on 3.1% of returns)
92078:
$3,071
California:
$3,192
(% of AGI for various income ranges: 0.3% for AGIs $10k-25k, 0.2% for AGIs $25k-50k, 0.2% for AGIs $50k-75k, 0.1% for AGIs $75k-100k, 0.1% for AGIs over 100k)
Self-employed pension: $13,514 (reported on 1.3% of returns)
Here:
$13,514
California:
$17,688
(% of AGI for various income ranges: 0.2% for AGIs $25k-50k, 0.1% for AGIs $50k-75k, 0.3% for AGIs $75k-100k, 0.4% for AGIs over 100k)
Total itemized deductions: $28,189 (29% of AGI, reported on 50.7% of returns)
Here:
$28,189
State:
$28,113
Here:
28.6% of AGI
State:
25.3% of AGI
(% of AGI for various income ranges: 17.4% for AGIs $10k-25k, 22.9% for AGIs $25k-50k, 25.2% for AGIs $50k-75k, 26.0% for AGIs $75k-100k, 21.2% for AGIs over 100k)
Charity contributions deductions: $2,859 (3% of AGI, reported on 44.2% of returns)
Here:
$2,859
State:
$3,923
Here:
2.8% of AGI
State:
3.3% of AGI
(% of AGI for various income ranges: 1.4% for AGIs $10k-25k, 1.6% for AGIs $25k-50k, 2.2% for AGIs $50k-75k, 2.3% for AGIs $75k-100k, 2.0% for AGIs over 100k)
Total tax: $9,409 (reported on 81.2% of returns)
92078:
$9,409
State:
$10,761
(% of AGI for various income ranges: 4.6% for AGIs $10k-25k, 7.2% for AGIs $25k-50k, 8.6% for AGIs $50k-75k, 9.6% for AGIs $75k-100k, 15.9% for AGIs over 100k)
Earned income credit: $1,518 (reported on 8.6% of returns)
Here:
$1,518
State:
$1,763
Percentage of individuals using paid preparers for their 2004 taxes: 66.2%
Here:
66%
State:
66%
(% for various income ranges: 57.3% for AGIs below $10k, 67.2% for AGIs $10k-25k, 67.2% for AGIs $25k-50k, 68.0% for AGIs $50k-75k, 65.2% for AGIs $75k-100k, 69.8% for AGIs over 100k)
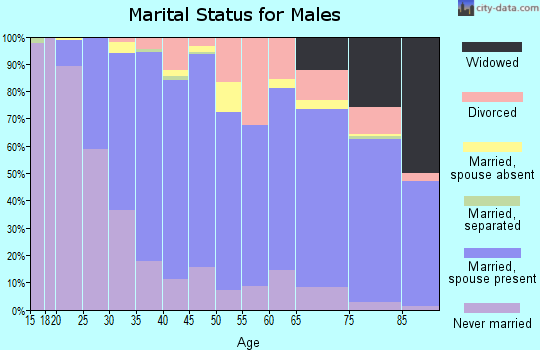
Likely homosexual households (counted as self-reported same-sex unmarried-partner households)
Lesbian couples: 0.0% of all households
Gay men: 0.3% of all households
Household received Food Stamps/SNAP in the past 12 months: 1,216 Household did not receive Food Stamps/SNAP in the past 12 months: 16,907
Women who had a birth in the past 12 months: 393 (272 now married, 121 unmarried) Women who did not have a birth in the past 12 months: 11,715 (6,489 now married, 5,148 unmarried)
Housing units in zip code 92078 with a mortgage: 9,197 (1,051 second mortgage, 21 home equity loan, 901 both second mortgage and home equity loan) Houses without a mortgage: 246
Median monthly owner costs for units with a mortgage: $3,201 Median monthly owner costs for units without a mortgage: $878
Residents with income below the poverty level in 2022:
This zip code:
8.0%
Whole state:
12.2%
Residents with income below 50% of the poverty level in 2022:
This zip code:
4.3%
Whole state:
6.2%
Median number of rooms in houses and condos:
Here:
6.1
State:
6.0
Median number of rooms in apartments:
Here:
4.2
State:
3.9
Notable locations in this zip code not listed on our city pages
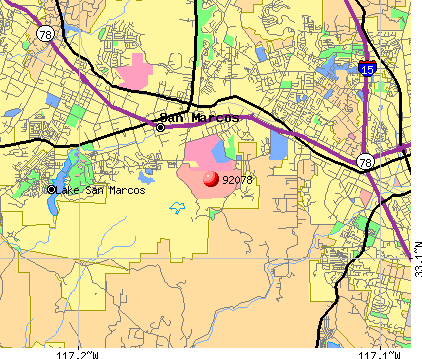
Notable locations in zip code 92078: Lake San Marcos Executive Golf Course (A), Lake San Marcos Country Club (B), San Marcos Fire Protection District Station 2 (C), San Marcos Fire Protection District Station 4 (D). Display/hide their locations on the map
Shopping Centers: Lake San Marcos Shopping Center (1), San Marcos Village Shopping Center (2), San Marcos Shopping Plaza Shopping Center (3), San Marcos Gateway Shopping Center (4), Rancho San Marcos Village Shopping Center (5), Park Plaza Shopping Center (6), Palomar Plaza Shopping Center (7). Display/hide their locations on the map
Parks in zip code 92078 include: Jacks Pond Park (1), Lake Moree Park (2), William R Bradley Park (3), Discovery Community Park (4). Display/hide their locations on the map
9,698 married couples with children.
1,845 single-parent households (343 men, 1,502 women).
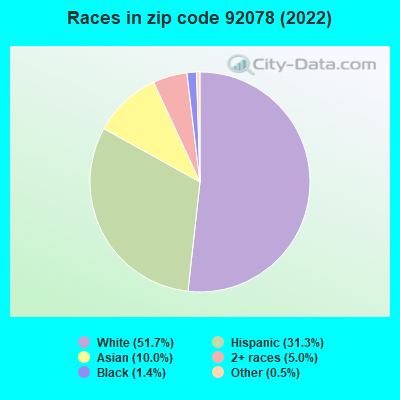
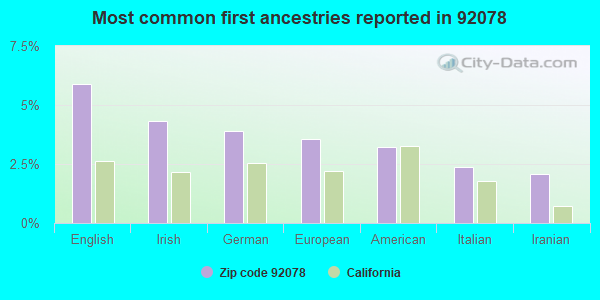
71.7% of residents of 92078 zip code speak English at home.
18.8% of residents speak Spanish at home (69% very well, 14% well, 12% not well, 5% not at all).
4.0% of residents speak other Indo-European language at home (79% very well, 14% well, 2% not well, 4% not at all).
4.4% of residents speak Asian or Pacific Island language at home (63% very well, 22% well, 11% not well, 4% not at all).
0.9% of residents speak other language at home (48% very well, 46% well, 6% not well).
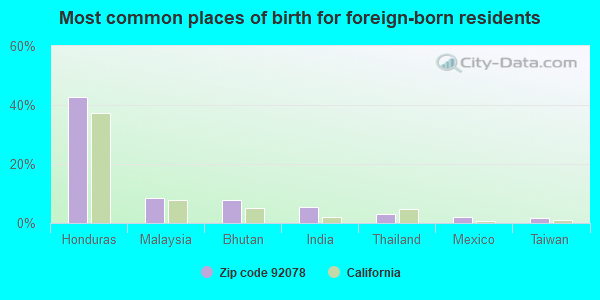
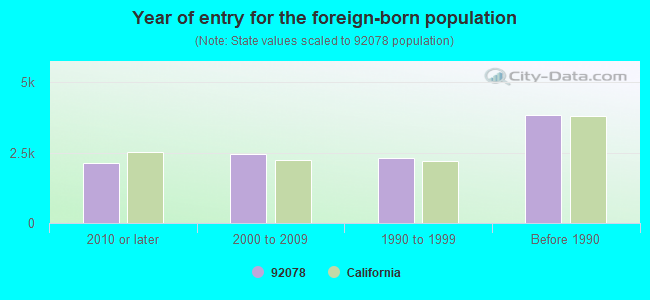
Foreign born population: 9,944 (18.9%) (57.6% of them are naturalized citizens)
Facilities with environmental interests located in this zip code:
HUBBARD ENTERPRISES (393 ENTERPRISE ST in SAN MARCOS, CA)
STATE MASTER (California - Hazardous Waste Tracking) - HAZARDOU WASTE PROGRAM HAZARDOUS WASTE BIENNIAL REPORTER (Resource Conservation and Recovery Act (tracking hazardous waste)) Large Quantity Generators, more that 1000 kg of hazardous waste/month (Resource Conservation and Recovery Act (tracking hazardous waste)) - notification Business NAICS classification: ELECTROPLATING, PLATING, POLISHING, ANODIZING, AND COLORING.; ALL OTHER MISCELLANEOUS FABRICATED METAL PRODUCT MANUFACTURING. Organizations: GEORGE HUBBARD (CONTACT/OPERATOR)
Alternative names: HOLDRITE CORP
Housing units lacking complete plumbing facilities: 0.4% Housing units lacking complete kitchen facilities: 0.6%
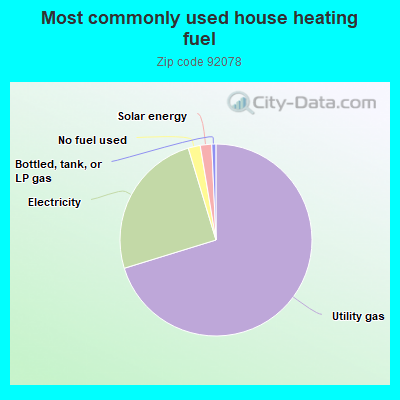
69.4%Utility gas
24.8%Electricity
2.0%No fuel used
1.9%Solar energy
0.7%Bottled, tank, or LP gas
Place of birth for U.S.-born residents:
This state: 29,172
Northeast: 3,741
Midwest: 3,670
South: 2,320
West: 2,683
38% of the 92078 zip code residents lived in the same house 5 years ago. Out of people who lived in different houses, 72% lived in this county. Out of people who lived in different counties, 50% lived in California.
89% of the 92078 zip code residents lived in the same house 1 year ago. Out of people who lived in different houses, 72% moved from this county. Out of people who lived in different houses, 6% moved from different county within same state. Out of people who lived in different houses, 16% moved from different state. Out of people who lived in different houses, 4% moved from abroad.
Private vs. public school enrollment:
Students in private schools in grades 1 to 8 (elementary and middle school): 287
Here:
4.6%
California:
10.5%
Students in private schools in grades 9 to 12 (high school): 235
Here:
9.3%
California:
8.5%
Students in private undergraduate colleges: 414
Here:
10.2%
California:
15.9%
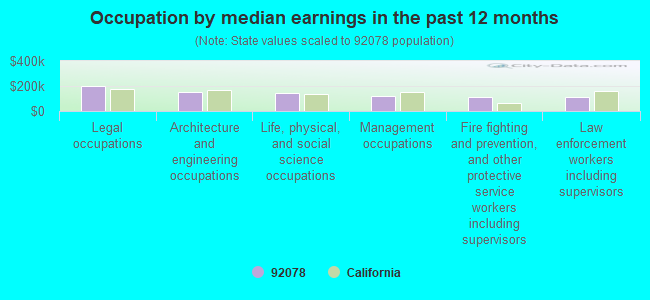
Occupation by median earnings in the past 12 months ($)
201,903Legal occupations
154,167Architecture and engineering occupations
142,066Life, physical, and social science occupations
123,726Management occupations
115,682Fire fighting and prevention, and other protective service workers including supervisors
112,258Law enforcement workers including supervisors
Companies with biggest federal contracts located in this zip code (SAN MARCOS, CA):
DUPLAN INDUSTRIES INC (1265 STONE DR; small business) : $8,426,853 in 387 contractsfrom 1999 to 2006
Contracts for Technical Representation Services -- Aircraft Components and Accessories, Airframe Structural Components, Bearings, Plain, Unmounted, Fastening Device, and moreby Navy, Defense Logistics Agency Signed by year:2000: $4,952,145; 2001: $529,879; 2002: $1,979,770; 2003: -$1,593,317; 2004: $986,278; 2005: $980,495; 2006: $369,621.
Biggest contracts:
$1,742,857 with Navy for Technical Representation Services -- Aircraft Components and Accessories. Signed on 2000-12-11. Completion date: 2001-12-31.
$1,673,192, same as above.Signed on 2000-01-01. Completion date: 2000-12-31.
$699,500 with Navy for Airframe Structural Components. Signed on 2003-11-20. Completion date: 2004-06-30.
$464,648 with Navy for Bearings, Plain, Unmounted. Signed on 2000-06-06. Completion date: 2001-06-07.
MATRIX ENGINEERS AND CONTRACTO (475 PRODUCTION STREET; small business) : $5,553,021 in 75 contractsfrom 2002 to 2006
Contracts for Maintenance, Repair or Alteration of Real Property -- Other Administrative Facilities and Service Buildings, ADP Systems Analysis Services, Maintenance, Repair and Rebuilding of Equipment -- Communication, Detection, and Coherent Radiation Equipment, Program Management/Support Services, and moreby NASA, Navy, Federal Highway Administration Signed by year:2000: $0; 2001: $0; 2002: $1,082,000; 2003: $922,472; 2004: $1,756,336; 2005: $1,210,569; 2006: $581,644.
Biggest contracts:
$1,040,000 with NASA for Maintenance, Repair or Alteration of Real Property -- Other Administrative Facilities and Service Buildings. Signed on 2002-09-15. Completion date: 2003-10-15.
$408,987 with Navy for ADP Systems Analysis Services. Taking place in IN. Signed on 2005-03-24. Completion date: 2006-03-23.
$350,000, same as above.Signed on 2006-02-22. Completion date: 2007-01-24.
$275,411 with Navy for Maintenance, Repair and Rebuilding of Equipment -- Communication, Detection, and Coherent Radiation Equipment. Taking place in FL. Signed on 2004-04-23. Completion date: 2004-09-30.
GCAS INC (1531 GRAND AVENUE; small business) : $3,742,168 in 21 contractsfrom 2000 to 2006
Contracts for Other Defense -- Applied Research and Exploratory Development (R&D), Other Medical -- Basic Research (R&D), Other Defense -- Management and Support (R&D), Defense Tank - Automotive -- Applied Research and Exploratory Development (R&D), and moreby Navy, Army, National Institutes of Health, Air Force, and others Signed by year:2000: $120,000; 2001: $365,000; 2002: $561,929; 2003: $729,537; 2004: $1,326,103; 2005: $569,600; 2006: $69,999.
Biggest contracts:
$750,000 with Navy for Other Defense -- Applied Research and Exploratory Development (R&D). Signed on 2004-09-20. Completion date: 2006-09-19.
$589,563 with Army for Other Medical -- Basic Research (R&D). Signed on 2003-08-27. Completion date: 2005-08-31.
$373,637 with Army for Other Defense -- Management and Support (R&D). Signed on 2005-11-29. Completion date: 2006-11-14.
$365,000 with Army for Defense Tank - Automotive -- Applied Research and Exploratory Development (R&D). Signed on 2001-02-12. Completion date: 2003-02-08.
R & F PRODUCTS, INC (1825 DIAMOND ST) : $2,192,846 in 36 contractsfrom 1999 to 2006
Contracts for Electronic Countermeasures, Counter-Countermeasures and Quick Reaction Capability Equipment, Miscellaneous Ship and Marine Equipment, Electrical and Electronic Properties Measuring and Testing Instruments, Miscellaneous Electrical and Electronic Components, and moreby Navy, Defense Logistics Agency, Air Force, Geological Survey, and others Signed by year:2000: $369,034; 2001: $147,650; 2002: $270,492; 2003: $393,450; 2004: $27,885; 2005: $651,336; 2006: $54,148.
Biggest contracts:
$475,320 with Navy for Electronic Countermeasures, Counter-Countermeasures and Quick Reaction Capability Equipment. Signed on 2005-09-29. Completion date: 2006-03-29.
$278,851 with Navy for Miscellaneous Ship and Marine Equipment. Signed on 1999-11-18. Completion date: 2000-07-30.
$186,629, same as above.Signed on 2003-04-11. Completion date: 2003-09-30.
$179,556 with Navy for Electrical and Electronic Properties Measuring and Testing Instruments. Signed on 2003-08-08. Completion date: 2003-10-22.
RANTEC MICROWAVE SYSTEMS CORP (520 E CARMEL ST; small business) : $540,490 in 17 contractsfrom 2000 to 2006
Contracts for Miscellaneous Communication Equipment, Antennas, Waveguides, and Related Equipment, Maintenance, Repair and Rebuilding of Equipment -- Electrical and Electronic Equipment Components, Maintenance, Repair and Rebuilding of Equipment -- Weapons by Navy, Defense Logistics Agency, Air Force Signed by year:2000: $137,760; 2001: $267,407; 2002: $29,956; 2003: $19,500; 2004: $28,117; 2005: $50,150; 2006: $7,600.
Biggest contracts:
$96,000 with Navy for Miscellaneous Communication Equipment. Signed on 2000-02-28. Completion date: 2000-05-08.
$82,100, same as above.Signed on 2001-08-17. Completion date: 2001-11-13.
$64,577 with Defense Logistics Agency for Antennas, Waveguides, and Related Equipment. Signed on 2001-03-26. Completion date: 2001-08-23.
$61,769, same as above.Signed on 2001-03-09. Completion date: 2001-07-07.
ALPHA TEN TECHNOLOGIES, INC (664 LARKSPUR COURT; small business)
$516,985 with Army for Program Management/Support Services. Taking place in KS. Signed on 2005-12-02. Completion date: 2006-09-30.
ULTRA COMMUNICATIONS (310 VIA VERA CRUZ, SUITE 1; small business) : $219,547 in 4 contractsfrom 2005 to 2006
$69,932 with Navy for Other Defense -- Operational Systems Development (R&D). Signed on 2005-07-12. Completion date: 2006-05-31.
$69,849 with Army for Other Research and Development -- Basic Research (R&D). Signed on 2005-11-14. Completion date: 2006-05-09.
$49,865, same as above.Signed on 2006-06-30. Completion date: 2006-09-07.
$29,901 with Navy for Other Defense -- Operational Systems Development (R&D). Signed on 2006-05-26. Completion date: 2006-08-31.
FLUID COMPONENTS, INC (1755 LA COSTA MEADOWS DR; small business) : $163,950 in 10 contractsfrom 2000 to 2006
Contracts for Pressure, Temperature, and Humidity Measuring and Controlling Instruments, Switches, Liquid and Gas Flow, Liquid Level, and Mechanical Motion Measuring Instruments, Maintenance, Repair and Rebuilding of Equipment -- Miscellaneous, and moreby Tennessee Valley Authority, Air Force, Army Signed by year:2000: $133,000; 2001: $0; 2002: -$6,465; 2003: $0; 2004: $0; 2005: $29,390; 2006: $8,025.
Biggest contracts:
$66,000 with Tennessee Valley Authority for Pressure, Temperature, and Humidity Measuring and Controlling Instruments. Taking place in TN. Signed on 2000-03-15. Completion date: 2000-06-15.
$39,000 with Tennessee Valley Authority for Switches. Taking place in TN. Signed on 2000-07-15. Completion date: 2000-10-15.
$29,390 with Air Force for Pressure, Temperature, and Humidity Measuring and Controlling Instruments. Signed on 2005-02-08. Completion date: 2005-06-10.
$28,000 with Tennessee Valley Authority for Liquid and Gas Flow, Liquid Level, and Mechanical Motion Measuring Instruments. Signed on 2000-05-15. Completion date: 2000-07-15.
STAR BUILDERS SUPPLY OF SAN MA (961 GRAND AVE; small business) : $151,715 in 7 contractsfrom 2003 to 2005
Contracts for Electrical Hardware and Supplies, Refrigeration Equipment, Lumber and Related Basic Wood Materials, Miscellaneous Items, and moreby Navy Signed by year:2000: $0; 2001: $0; 2002: $0; 2003: $39,900; 2004: $0; 2005: $111,815; 2006: $0.
Biggest contracts:
$46,672 with Navy for Electrical Hardware and Supplies. Signed on 2005-06-03. Completion date: 2005-07-01.
$39,900 with Navy for Refrigeration Equipment. Signed on 2003-09-19. Completion date: 2003-11-04.
$24,494 with Navy for Lumber and Related Basic Wood Materials. Signed on 2005-02-10. Completion date: 2005-02-18.
$24,000 with Navy for Electrical Hardware and Supplies. Signed on 2005-04-15. Completion date: 2005-09-30.
FALMAT INC (1873 DIAMOND ST; small business) : $151,628 in 13 contractsfrom 2003 to 2006
Contracts for Wire and Cable, Electrical, Operations Research and Quantitative Analysis Services, Fiber Optic Cables, Pressure, Temperature, and Humidity Measuring and Controlling Instruments, and moreby Navy, National Oceanic and Atmospheric Administration/Under Secretary for Oceans and Atmosphere, Defense Logistics Agency Signed by year:2000: $0; 2001: $0; 2002: $0; 2003: $50,400; 2004: $57,048; 2005: $41,522; 2006: $2,658.
Biggest contracts:
$50,400 with Navy for Wire and Cable, Electrical. Signed on 2003-07-31. Completion date: 2003-11-20.
$17,325 with National Oceanic and Atmospheric Administration/Under Secretary for Oceans and Atmosphere for Operations Research and Quantitative Analysis Services. Signed on 2004-10-06. Completion date: 2005-06-25.
$17,325 with National Oceanic and Atmospheric Administration/Under Secretary for Oceans and Atmosphere for Fiber Optic Cables. Signed on 2004-06-25. Completion date: 2004-08-30.
$16,020 with Navy for Pressure, Temperature, and Humidity Measuring and Controlling Instruments. Signed on 2004-11-01. Completion date: 2004-12-28.
Top industries in this zip code by the number of employees in 2005:
Other Services (except Public Administration): Grantmaking Foundations (250-499 employees: 1 establishment, 5-9 employees: 1 establishment)
Construction: Poured Concrete Foundation and Structure Contractors (100-249: 1, 1-4: 1)
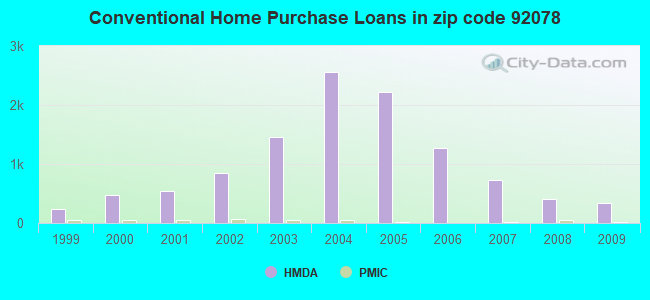
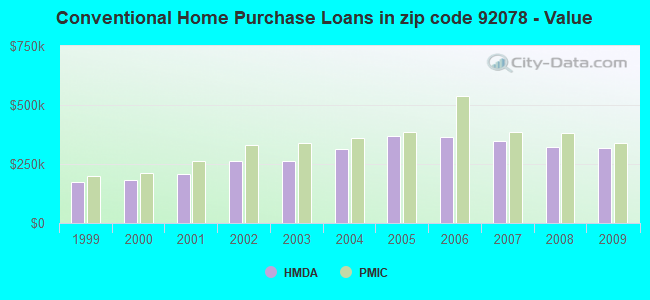
Detailed PMIC statistics for the following Tracts:0200.10
, 0203.06
2005 - 2018 National Fire Incident Reporting System (NFIRS) incidents
According to the data from the years 2005 - 2018 the average number of fires per year is 57. The highest number of fire incidents - 85 took place in 2018, and the least - 34 in 2012. The data has an increasing trend.
When looking into fire subcategories, the most incidents belonged to: Structure Fires (46.0%), and Outside Fires (30.5%).
Fire incident types reported to NFIRS in Zip Code 92078


 Nearest zip codes: 92069, 92029, 92009, 92081, 92067, 92024.


 According to the data from the years 2005 - 2018 the average number of fires per year is 57. The highest number of fire incidents - 85 took place in 2018, and the least - 34 in 2012. The data has an increasing trend.
 When looking into fire subcategories, the most incidents belonged to: Structure Fires (46.0%), and Outside Fires (30.5%).