Estimated zip code population in 2022: 33,279 Zip code population in 2010: 25,605 Zip code population in 2000: 2,730
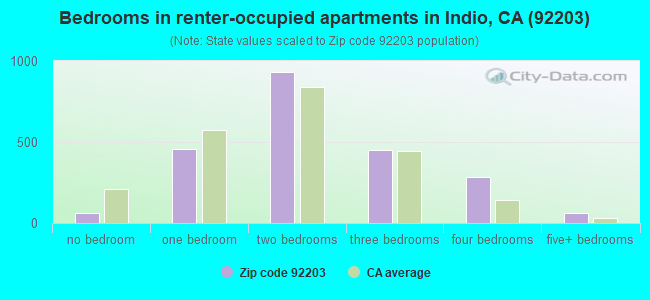
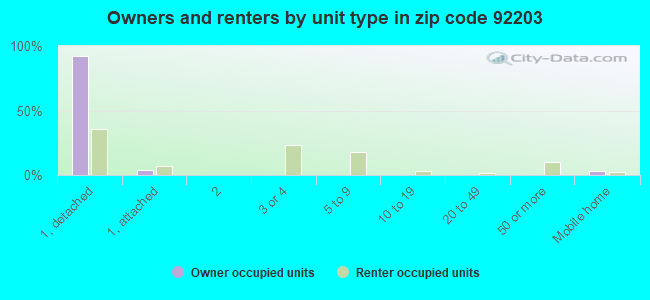
Houses and condos: 15,414 Renter-occupied apartments: 2,249
% of renters here:
18%
State:
44%
March 2022 cost of living index in zip code 92203: 81.9 (low, U.S. average is 100)
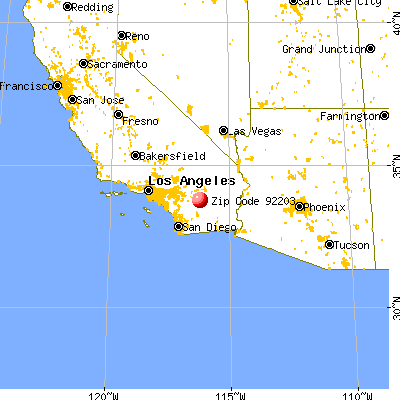
Land area: 17.5 sq. mi. Water area: 0.0 sq. mi.
Population density: 1,901 people per square mile
(low).
OSM Map
General Map
Google Map
MSN Map
OSM Map
General Map
Google Map
MSN Map
OSM Map
General Map
Google Map
MSN Map
OSM Map
General Map
Google Map
MSN Map
Please wait while loading the map...
Real estate property taxes paid for housing units in 2022:
This zip code:
1.2% ($5,696)
California:
0.7% ($4,831)
Median real estate property taxes paid for housing units with mortgages in 2022: $5,625 (1.2%) Median real estate property taxes paid for housing units with no mortgage in 2022: $6,101 (1.3%)
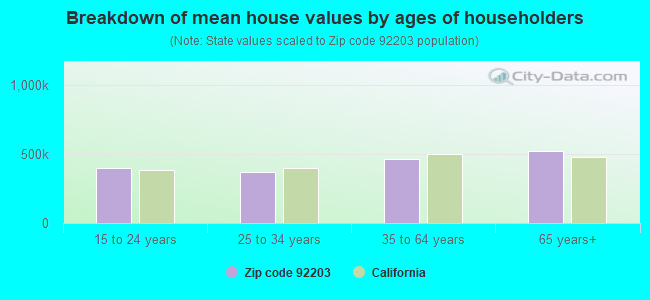
Estimated median house/condo value in 2022: $486,460
92203:
$486,460
California:
$715,900
According to our research of California and other state lists, there were 21 registered sex offenders living in 92203 zip code as of April 24, 2024. The ratio of all residents to sex offenders in zip code 92203 is 1,438 to 1. The ratio of registered sex offenders to all residents in this zip code is near the state average.
Median resident age:
This zip code:
42.7 years
California median age:
37.9 years
Average household size:
This zip code:
2.7 people
California:
2.8 people
Averages for the 2020 tax year for zip code 92203, filed in 2021:
Average Adjusted Gross Income (AGI) in 2020: $73,123 (Individual Income Tax Returns)
Here:
$73,123
State:
$95,910
Salary/wage: $61,727 (reported on 73.0% of returns)
Here:
$61,727
State:
$77,331
(% of AGI for various income ranges: 1090.9% for AGIs below $25k, 3458.6% for AGIs $25k-50k, 6316.8% for AGIs $50k-75k, 9460.9% for AGIs $75k-100k, 19298.1% for AGIs $100k-200k, 65387.9% for AGIs over 200k)
Taxable interest for individuals: $1,359 (reported on 43.7% of returns)
This zip code:
$1,359
California:
$2,294
(% of AGI for various income ranges: 31.8% for AGIs below $25k, 32.5% for AGIs $25k-50k, 68.4% for AGIs $50k-75k, 99.8% for AGIs $75k-100k, 211.1% for AGIs $100k-200k, 1288.9% for AGIs over 200k)
Ordinary dividends: $7,008 (reported on 18.4% of returns)
Here:
$7,008
State:
$10,949
(% of AGI for various income ranges: 45.1% for AGIs below $25k, 68.4% for AGIs $25k-50k, 154.0% for AGIs $50k-75k, 207.0% for AGIs $75k-100k, 443.9% for AGIs $100k-200k, 3251.6% for AGIs over 200k)
Net capital gain/loss in AGI: +$12,989 (reported on 19.5% of returns)
Here:
+$12,989
State:
+$49,306
(% of AGI for various income ranges: 46.4% for AGIs $25k-50k, 113.5% for AGIs $50k-75k, 232.1% for AGIs $75k-100k, 764.0% for AGIs $100k-200k, 11505.3% for AGIs over 200k)
Profit/loss from business: +$12,343 (reported on 19.6% of returns)
Here:
+$12,343
State:
+$15,671
(% of AGI for various income ranges: 198.9% for AGIs below $25k, 247.8% for AGIs $25k-50k, 317.8% for AGIs $50k-75k, 423.8% for AGIs $75k-100k, 780.8% for AGIs $100k-200k, 3211.6% for AGIs over 200k)
Taxable individual retirement arrangement distribution: $25,425 (reported on 12.2% of returns)
92203:
$25,425
California:
$23,505
(% of AGI for various income ranges: 86.9% for AGIs below $25k, 189.0% for AGIs $25k-50k, 387.3% for AGIs $50k-75k, 678.7% for AGIs $75k-100k, 1302.1% for AGIs $100k-200k, 5179.5% for AGIs over 200k)
Self-employed (Keogh) retirement plans: $16,257 (reported on 0.5% of returns)
92203:
$16,257
California:
$30,163
(% of AGI for various income ranges: 8.5% for AGIs $25k-50k, 72.4% for AGIs $100k-200k)
Total itemized deductions: $30,926 (reported on 19.6% of returns)
Here:
$30,926
State:
$39,517
(% of AGI for various income ranges: 182.0% for AGIs below $25k, 354.3% for AGIs $25k-50k, 893.8% for AGIs $50k-75k, 1528.3% for AGIs $75k-100k, 2509.5% for AGIs $100k-200k, 8770.0% for AGIs over 200k)
Charity contributions: $6,462 (reported on 16.3% of returns)
Here:
$6,462
State:
$12,598
(% of AGI for various income ranges: 10.2% for AGIs below $25k, 37.1% for AGIs $25k-50k, 111.8% for AGIs $50k-75k, 209.9% for AGIs $75k-100k, 464.1% for AGIs $100k-200k, 2428.9% for AGIs over 200k)
Taxes paid: $8,574 (reported on 19.6% of returns)
92203:
$8,574
State:
$8,807
(% of AGI for various income ranges: 36.8% for AGIs below $25k, 95.3% for AGIs $25k-50k, 258.5% for AGIs $50k-75k, 492.3% for AGIs $75k-100k, 765.6% for AGIs $100k-200k, 1770.5% for AGIs over 200k)
Earned income credit: $2,165 (reported on 13.1% of returns)
Here:
$2,165
State:
$2,074
(% of AGI for various income ranges: 92.9% for AGIs below $25k, 73.7% for AGIs $25k-50k, 1.4% for AGIs $50k-75k)
Percentage of individuals using paid preparers for their 2020 taxes: 93.2%
Here:
93%
State:
92%
(% for various income ranges: 91.2% for AGIs below $25k, 93.3% for AGIs $25k-50k, 93.8% for AGIs $50k-75k, 93.0% for AGIs $75k-100k, 94.7% for AGIs $100k-200k, 95.8% for AGIs over 200k)
Averages for the 2012 tax year for zip code 92203, filed in 2013:
Average Adjusted Gross Income (AGI) in 2012: $64,322 (Individual Income Tax Returns)
Here:
$64,322
State:
$72,726
Salary/wage: $54,347 (reported on 76.8% of returns)
Here:
$54,347
State:
$59,079
(% of AGI for various income ranges: 67.0% for AGIs below $25k, 72.1% for AGIs $25k-50k, 69.7% for AGIs $50k-75k, 68.3% for AGIs $75k-100k, 68.3% for AGIs $100k-200k, 46.6% for AGIs over 200k)
Taxable interest for individuals: $1,553 (reported on 43.5% of returns)
This zip code:
$1,553
California:
$2,146
(% of AGI for various income ranges: 1.7% for AGIs below $25k, 1.1% for AGIs $25k-50k, 1.2% for AGIs $50k-75k, 1.0% for AGIs $75k-100k, 0.8% for AGIs $100k-200k, 1.1% for AGIs over 200k)
Ordinary dividends: $6,105 (reported on 19.0% of returns)
Here:
$6,105
State:
$9,308
(% of AGI for various income ranges: 2.5% for AGIs below $25k, 1.6% for AGIs $25k-50k, 1.6% for AGIs $50k-75k, 1.4% for AGIs $75k-100k, 1.8% for AGIs $100k-200k, 2.1% for AGIs over 200k)
Net capital gain/loss in AGI: +$13,498 (reported on 17.1% of returns)
Here:
+$13,498
State:
+$30,460
(% of AGI for various income ranges: 0.5% for AGIs $50k-75k, 0.8% for AGIs $75k-100k, 2.1% for AGIs $100k-200k, 14.8% for AGIs over 200k)
Profit/loss from business: +$12,016 (reported on 20.3% of returns)
Here:
+$12,016
State:
+$17,064
(% of AGI for various income ranges: 12.0% for AGIs below $25k, 5.5% for AGIs $25k-50k, 3.7% for AGIs $50k-75k, 2.9% for AGIs $75k-100k, 2.5% for AGIs $100k-200k, 2.6% for AGIs over 200k)
Taxable individual retirement arrangement distribution: $21,048 (reported on 13.6% of returns)
92203:
$21,048
California:
$19,557
(% of AGI for various income ranges: 4.4% for AGIs below $25k, 3.5% for AGIs $25k-50k, 4.5% for AGIs $50k-75k, 5.0% for AGIs $75k-100k, 5.4% for AGIs $100k-200k, 3.0% for AGIs over 200k)
Self-employment retirement plans: $11,533 (reported on 0.6% of returns)
92203:
$11,533
California:
$24,530
Total itemized deductions: $27,181 (28% of AGI, reported on 49.2% of returns)
Here:
$27,181
State:
$34,004
Here:
27.7% of AGI
State:
22.7% of AGI
(% of AGI for various income ranges: 21.3% for AGIs below $25k, 18.8% for AGIs $25k-50k, 24.1% for AGIs $50k-75k, 21.5% for AGIs $75k-100k, 21.5% for AGIs $100k-200k, 17.5% for AGIs over 200k)
Charity contributions: $3,249 (reported on 40.6% of returns)
Here:
$3,249
State:
$4,659
(% of AGI for various income ranges: 1.1% for AGIs below $25k, 1.6% for AGIs $25k-50k, 2.0% for AGIs $50k-75k, 2.3% for AGIs $75k-100k, 2.2% for AGIs $100k-200k, 2.3% for AGIs over 200k)
Taxes paid: $9,302 (reported on 49.1% of returns)
92203:
$9,302
State:
$14,448
(% of AGI for various income ranges: 4.9% for AGIs below $25k, 4.9% for AGIs $25k-50k, 7.0% for AGIs $50k-75k, 6.8% for AGIs $75k-100k, 7.8% for AGIs $100k-200k, 8.4% for AGIs over 200k)
Earned income credit: $2,386 (reported on 16.6% of returns)
Here:
$2,386
State:
$2,286
(% of AGI for various income ranges: 7.0% for AGIs below $25k, 1.2% for AGIs $25k-50k)
Percentage of individuals using paid preparers for their 2012 taxes: 67.6%
Here:
68%
State:
64%
(% for various income ranges: 62.6% for AGIs below $25k, 65.7% for AGIs $25k-50k, 69.1% for AGIs $50k-75k, 71.3% for AGIs $75k-100k, 74.4% for AGIs $100k-200k, 80.6% for AGIs over 200k)
Averages for the 2004 tax year for zip code 92203, filed in 2005:
Average Adjusted Gross Income (AGI) in 2004: $61,046 (Individual Income Tax Returns)
Here:
$61,046
State:
$58,600
Salary/wage: $47,675 (reported on 79.7% of returns)
Here:
$47,675
State:
$49,455
(% of AGI for various income ranges: 921.4% for AGIs below $10k, 75.0% for AGIs $10k-25k, 78.7% for AGIs $25k-50k, 71.9% for AGIs $50k-75k, 72.7% for AGIs $75k-100k, 48.8% for AGIs over 100k)
Taxable interest for individuals: $2,619 (reported on 49.2% of returns)
This zip code:
$2,619
California:
$2,365
(% of AGI for various income ranges: 134.7% for AGIs below $10k, 2.7% for AGIs $10k-25k, 2.1% for AGIs $25k-50k, 1.8% for AGIs $50k-75k, 1.4% for AGIs $75k-100k, 2.0% for AGIs over 100k)
Taxable dividends: $3,837 (reported on 25.0% of returns)
Here:
$3,837
State:
$4,746
(% of AGI for various income ranges: 59.7% for AGIs below $10k, 1.9% for AGIs $10k-25k, 1.2% for AGIs $25k-50k, 1.7% for AGIs $50k-75k, 1.1% for AGIs $75k-100k, 1.6% for AGIs over 100k)
Net capital gain/loss: +$25,169 (reported on 24.4% of returns)
Here:
+$25,169
State:
+$23,418
(% of AGI for various income ranges: 45.1% for AGIs below $10k, -0.6% for AGIs $10k-25k, 0.5% for AGIs $25k-50k, 1.4% for AGIs $50k-75k, 1.0% for AGIs $75k-100k, 18.7% for AGIs over 100k)
Profit/loss from business: +$16,178 (reported on 21.7% of returns)
Here:
+$16,178
State:
+$16,826
(% of AGI for various income ranges: -10.1% for AGIs below $10k, 9.7% for AGIs $10k-25k, 5.5% for AGIs $25k-50k, 6.1% for AGIs $50k-75k, 6.2% for AGIs $75k-100k, 5.2% for AGIs over 100k)
Profit/loss from farming: +$2,538 (reported on 0.3% of returns)
Here:
+$2,538
State:
-$7,562
IRA payment deduction: $3,753 (reported on 4.0% of returns)
92203:
$3,753
California:
$3,192
(% of AGI for various income ranges: 22.1% for AGIs below $10k, 0.4% for AGIs $25k-50k, 0.3% for AGIs $50k-75k, 0.2% for AGIs $75k-100k, 0.2% for AGIs over 100k)
Self-employed pension: $13,767 (reported on 2.0% of returns)
Here:
$13,767
California:
$17,688
(% of AGI for various income ranges: 0.4% for AGIs $25k-50k, 0.3% for AGIs $50k-75k, 0.3% for AGIs $75k-100k, 0.6% for AGIs over 100k)
Total itemized deductions: $25,328 (25% of AGI, reported on 47.6% of returns)
Here:
$25,328
State:
$28,113
Here:
25.3% of AGI
State:
25.3% of AGI
(% of AGI for various income ranges: 353.6% for AGIs below $10k, 18.4% for AGIs $10k-25k, 18.5% for AGIs $25k-50k, 24.7% for AGIs $50k-75k, 25.9% for AGIs $75k-100k, 16.6% for AGIs over 100k)
Charity contributions deductions: $3,432 (3% of AGI, reported on 42.5% of returns)
Here:
$3,432
State:
$3,923
Here:
3.3% of AGI
State:
3.3% of AGI
(% of AGI for various income ranges: 17.5% for AGIs below $10k, 1.6% for AGIs $10k-25k, 1.9% for AGIs $25k-50k, 2.4% for AGIs $50k-75k, 3.1% for AGIs $75k-100k, 2.4% for AGIs over 100k)
Total tax: $10,560 (reported on 76.3% of returns)
92203:
$10,560
State:
$10,761
(% of AGI for various income ranges: 45.1% for AGIs below $10k, 4.5% for AGIs $10k-25k, 6.4% for AGIs $25k-50k, 8.7% for AGIs $50k-75k, 9.8% for AGIs $75k-100k, 18.2% for AGIs over 100k)
Earned income credit: $1,818 (reported on 14.0% of returns)
Here:
$1,818
State:
$1,763
Percentage of individuals using paid preparers for their 2004 taxes: 72.2%
Here:
72%
State:
66%
(% for various income ranges: 63.5% for AGIs below $10k, 71.1% for AGIs $10k-25k, 69.7% for AGIs $25k-50k, 74.2% for AGIs $50k-75k, 77.2% for AGIs $75k-100k, 82.2% for AGIs over 100k)
Likely homosexual households (counted as self-reported same-sex unmarried-partner households)
Lesbian couples: 0.0% of all households
Gay men: 0.1% of all households
Household received Food Stamps/SNAP in the past 12 months: 910 Household did not receive Food Stamps/SNAP in the past 12 months: 11,271
Women who had a birth in the past 12 months: 303 (207 now married, 96 unmarried) Women who did not have a birth in the past 12 months: 6,879 (3,498 now married, 3,348 unmarried)
Housing units in zip code 92203 with a mortgage: 6,893 (374 second mortgage, 22 home equity loan, 228 both second mortgage and home equity loan) Houses without a mortgage: 28
Median monthly owner costs for units with a mortgage: $2,341 Median monthly owner costs for units without a mortgage: $850
Residents with income below the poverty level in 2022:
This zip code:
7.9%
Whole state:
12.2%
Residents with income below 50% of the poverty level in 2022:
This zip code:
5.2%
Whole state:
6.2%
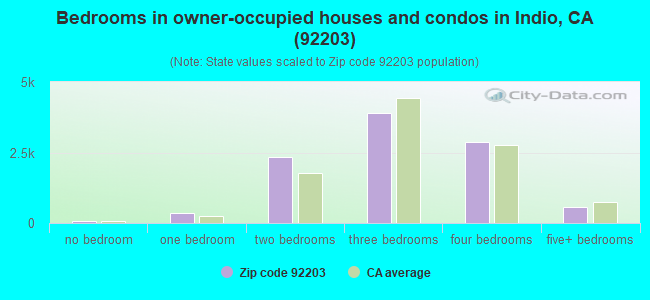
Median number of rooms in houses and condos:
Here:
5.9
State:
6.0
Median number of rooms in apartments:
Here:
4.2
State:
3.9
Notable locations in this zip code not listed on our city pages
Notable locations in zip code 92203: Rancho Casa Blanca Recreational Vehicle Park (A), Indio Municipal Golf Course (B), Bobs Roundup Recreational Vehicle Park (C), Bermuda Dunes Country Club (D), Riverside County Fire Department Station 80 Indio (E). Display/hide their locations on the map
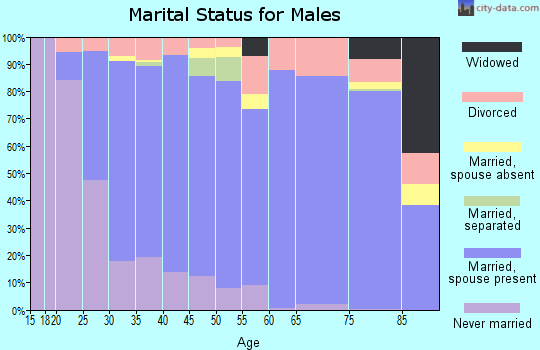
5,494 married couples with children.
1,123 single-parent households (571 men, 552 women).
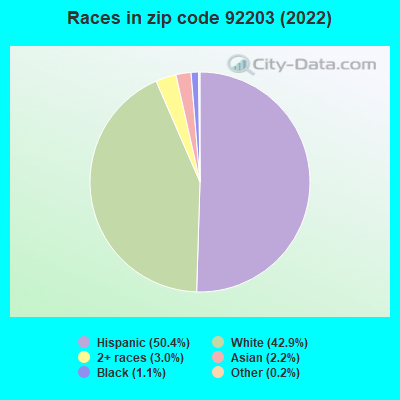
63.8% of residents of 92203 zip code speak English at home.
33.9% of residents speak Spanish at home (71% very well, 19% well, 7% not well, 3% not at all).
1.0% of residents speak other Indo-European language at home (95% very well, 5% well).
1.2% of residents speak Asian or Pacific Island language at home (69% very well, 22% well, 9% not well).
0.2% of residents speak other language at home (89% very well, 11% well).
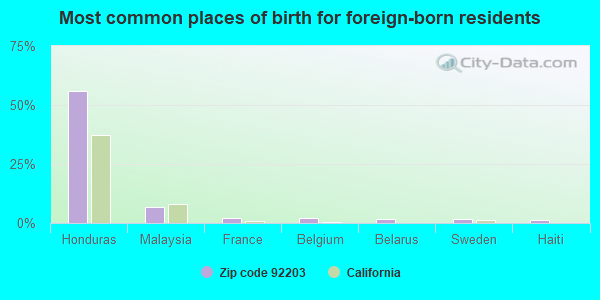
Foreign born population: 4,385 (13.2%) (62.4% of them are naturalized citizens)
Facilities with environmental interests located in this zip code:
FIESTA FORD LINCOLN MERCURY (78990 VARNER RD in INDIO, CA)
STATE MASTER (California - Hazardous Waste Tracking) - HAZARDOU WASTE PROGRAM Small Quantity Generators, between 100 kg and 1000 kg of hazardous waste/month (Resource Conservation and Recovery Act (tracking hazardous waste)) - notification Organizations: MICHAEL B BURNS (CONTACT/OWNER)
I 10 TOYOTA SCION (78 650 VARNER RD in INDIO, CA)
Small Quantity Generators, between 100 kg and 1000 kg of hazardous waste/month (Resource Conservation and Recovery Act (tracking hazardous waste)) Organizations: JULIAN SARKISSIAN (CONTACT/OPERATOR)
, C AND M MOTORS (CONTACT/OWNER)
CABAZON BAND OF MISSION INDIANS (84245 INDIO SPRINGS PKWY in INDIO, CA) . Tribal Land
Small Quantity Generators, between 100 kg and 1000 kg of hazardous waste/month (Resource Conservation and Recovery Act (tracking hazardous waste))
CABAZON INDIAN RESERVATION (84-425 INDIO SPRINGS DRIVE in INDIO, CA) . Tribal Land
ENFORCEMENT/COMPLIANCE ACTIVITY (Integrated Compliance Information System)
Housing units lacking complete plumbing facilities: 0.1% Housing units lacking complete kitchen facilities: 0.2%
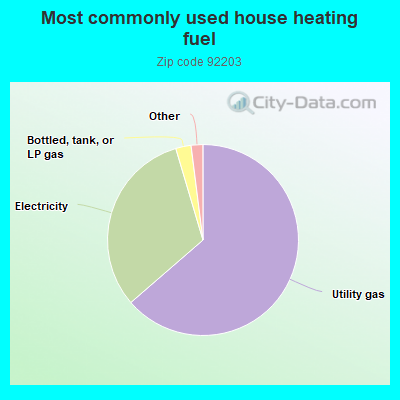
63.7%Utility gas
31.8%Electricity
2.6%Bottled, tank, or LP gas
0.9%No fuel used
0.8%Solar energy
Place of birth for U.S.-born residents:
This state: 21,646
Northeast: 1,483
Midwest: 2,739
South: 894
West: 1,861
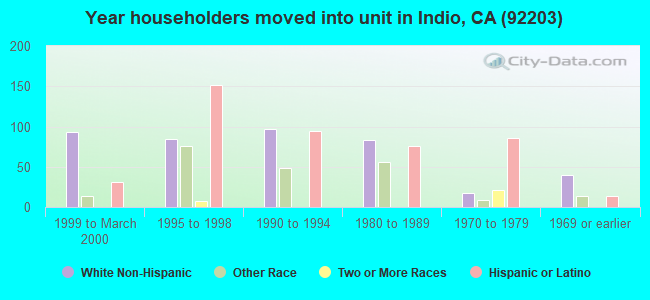
68% of the 92203 zip code residents lived in the same house 5 years ago. Out of people who lived in different houses, 66% lived in this county. Out of people who lived in different counties, 50% lived in California.
90% of the 92203 zip code residents lived in the same house 1 year ago. Out of people who lived in different houses, 58% moved from this county. Out of people who lived in different houses, 18% moved from different county within same state. Out of people who lived in different houses, 16% moved from different state. Out of people who lived in different houses, 9% moved from abroad.
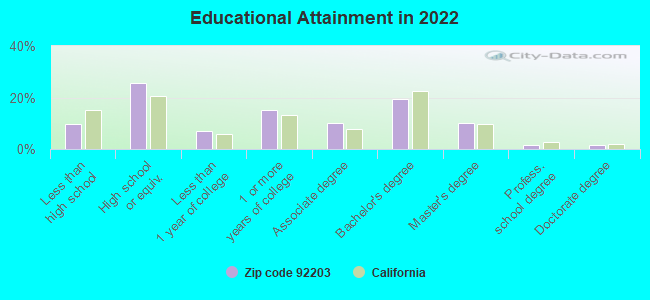
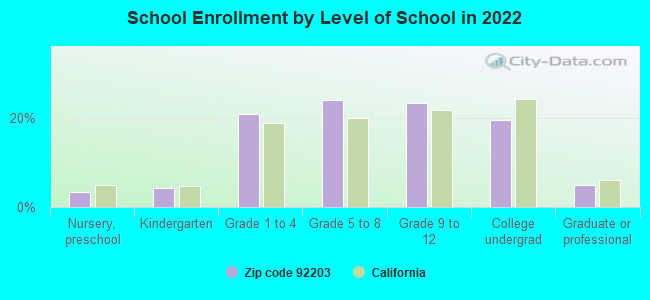
Private vs. public school enrollment:
Students in private schools in grades 1 to 8 (elementary and middle school): 461
Here:
13.8%
California:
10.5%
Students in private schools in grades 9 to 12 (high school): 210
Here:
12.1%
California:
8.5%
Students in private undergraduate colleges: 271
Here:
18.8%
California:
15.9%
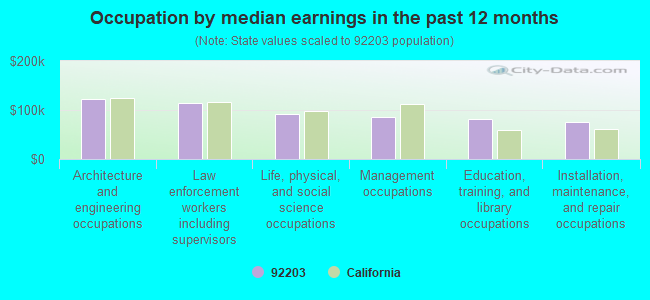
Occupation by median earnings in the past 12 months ($)
121,467Architecture and engineering occupations
114,770Law enforcement workers including supervisors
91,320Life, physical, and social science occupations
85,125Management occupations
82,478Education, training, and library occupations
74,976Installation, maintenance, and repair occupations
Companies with federal contracts located in this zip code:
B&B ENGINEERING (40391 CAMINO MONTECITO in INDIO, CA; small business) : $737,027 in 7 contractsfrom 2001 to 2004
Contracts for Defense Ships -- Basic Research (R&D) by Navy Signed by year:2000: $0; 2001: $70,000; 2002: $70,000; 2003: $352,087; 2004: $244,940; 2005: $0; 2006: $0.
Biggest contracts:
$150,000 with Navy for Defense Ships -- Basic Research (R&D). Signed on 2003-07-15. Completion date: 2005-07-15.
$142,131, same as above.Signed on 2004-07-22. Completion date: 2005-07-15.
$126,913, same as above.Signed on 2003-08-11. Completion date: 2005-07-15.
$102,809, same as above.Signed on 2004-03-26. Completion date: 2005-07-15.
TLC SYSTEMS (79461 BERMUDA DUNES DR in INDIO, CA; small business)
$4,218 with Army for ADP Support Equipment. Signed on 2006-05-05. Completion date: 2006-06-30.
Top industries in this zip code by the number of employees in 2005:
Other Services (except Public Administration): Other Similar Organizations (except Business, Professional, Labor, and Political Organizations) (20-49: 1, 5-9: 1)
Accommodation and Food Services: Hotels (except Casino Hotels) and Motels (20-49: 1, 5-9: 1)
Arts, Entertainment, and Recreation: Golf Courses and Country Clubs (20-49: 1, 1-4: 1)
Construction: All Other Specialty Trade Contractors (20-49: 1, 1-4: 1)
People in group quarters in 2010:
19 people in group homes intended for adults
2 people in other noninstitutional facilities
People in group quarters in 2000:
7 people in other noninstitutional group quarters
Fatal accident statistics in 2014:
Fatal accident count: 1
Vehicles involved in fatal accidents: 1
Fatal accidents caused by drunken drivers: 0
Fatalities: 1
Persons involved in fatal accidents: 1
Pedestrians involved in fatal accidents: 0
Fatal accident statistics in 2013:
Fatal accident count: 1
Vehicles involved in fatal accidents: 1
Fatal accidents caused by drunken drivers: 1
Fatalities: 1
Persons involved in fatal accidents: 4
Pedestrians involved in fatal accidents: 0
Home Mortgage Disclosure Act Aggregated Statistics For Year 2009 (Based on 6 partial tracts)
A) FHA, FSA/RHS & VA Home Purchase Loans
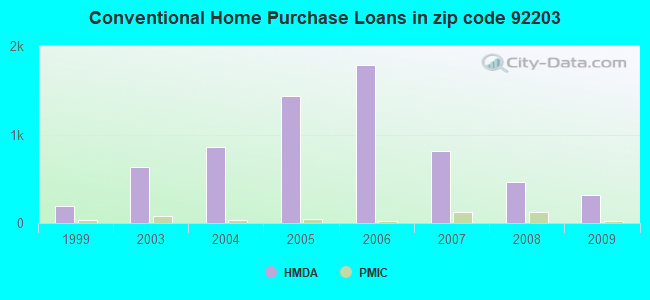
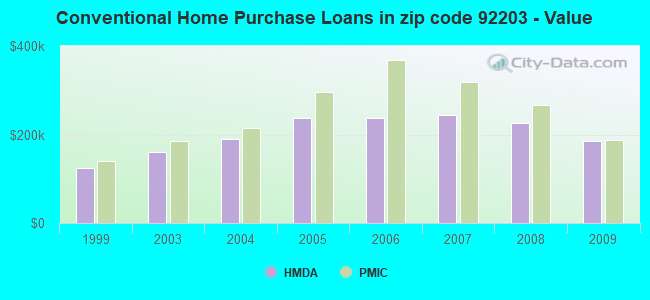
B) Conventional Home Purchase Loans
C) Refinancings
D) Home Improvement Loans
E) Loans on Dwellings For 5+ Families
F) Non-occupant Loans on < 5 Family Dwellings (A B C & D)
G) Loans On Manufactured Home Dwelling (A B C & D)
Number
Average Value
Number
Average Value
Number
Average Value
Number
Average Value
Number
Average Value
Number
Average Value
Number
Average Value
LOANS ORIGINATED
474
$196,843
316
$185,760
546
$244,402
11
$129,212
1
$1,171,580
227
$222,688
1
$76,660
APPLICATIONS APPROVED, NOT ACCEPTED
34
$203,700
40
$185,806
57
$239,201
6
$35,163
0
$0
31
$184,425
0
$0
APPLICATIONS DENIED
99
$209,393
71
$189,899
191
$255,451
18
$70,027
0
$0
62
$228,401
2
$98,590
APPLICATIONS WITHDRAWN
53
$212,451
57
$193,495
122
$244,767
3
$200,300
0
$0
34
$213,983
0
$0
FILES CLOSED FOR INCOMPLETENESS
13
$205,472
12
$172,174
24
$209,670
0
$0
0
$0
9
$186,959
0
$0
Aggregated Statistics For Year 2008 (Based on 6 partial tracts)
A) FHA, FSA/RHS & VA Home Purchase Loans
B) Conventional Home Purchase Loans
C) Refinancings
D) Home Improvement Loans
F) Non-occupant Loans on < 5 Family Dwellings (A B C & D)
G) Loans On Manufactured Home Dwelling (A B C & D)
Number
Average Value
Number
Average Value
Number
Average Value
Number
Average Value
Number
Average Value
Number
Average Value
LOANS ORIGINATED
329
$253,785
459
$224,985
237
$226,699
20
$125,639
214
$226,849
1
$141,120
APPLICATIONS APPROVED, NOT ACCEPTED
18
$271,882
116
$228,476
74
$244,576
10
$69,954
48
$236,945
1
$59,800
APPLICATIONS DENIED
93
$244,083
124
$235,848
273
$255,072
69
$104,285
56
$227,976
1
$163,240
APPLICATIONS WITHDRAWN
64
$245,741
121
$231,006
101
$246,831
14
$105,944
50
$222,003
0
$0
FILES CLOSED FOR INCOMPLETENESS
5
$224,564
19
$283,217
32
$276,920
1
$13,450
9
$252,833
0
$0
Aggregated Statistics For Year 2007 (Based on 6 partial tracts)
A) FHA, FSA/RHS & VA Home Purchase Loans
B) Conventional Home Purchase Loans
C) Refinancings
D) Home Improvement Loans
E) Loans on Dwellings For 5+ Families
F) Non-occupant Loans on < 5 Family Dwellings (A B C & D)
G) Loans On Manufactured Home Dwelling (A B C & D)
Number
Average Value
Number
Average Value
Number
Average Value
Number
Average Value
Number
Average Value
Number
Average Value
Number
Average Value
LOANS ORIGINATED
35
$318,258
810
$244,109
578
$248,757
68
$122,559
2
$4,818,330
213
$259,450
5
$102,474
APPLICATIONS APPROVED, NOT ACCEPTED
2
$164,835
190
$220,902
222
$252,656
28
$121,345
0
$0
59
$241,339
2
$61,825
APPLICATIONS DENIED
12
$289,968
247
$257,627
606
$279,970
131
$114,834
1
$1,143,080
99
$299,750
7
$161,539
APPLICATIONS WITHDRAWN
5
$243,464
143
$218,569
245
$281,721
32
$229,128
1
$1,143,080
50
$248,418
1
$98,780
FILES CLOSED FOR INCOMPLETENESS
0
$0
23
$242,404
93
$275,072
6
$160,850
0
$0
14
$214,291
0
$0
Aggregated Statistics For Year 2006 (Based on 6 partial tracts)
A) FHA, FSA/RHS & VA Home Purchase Loans
B) Conventional Home Purchase Loans
C) Refinancings
D) Home Improvement Loans
E) Loans on Dwellings For 5+ Families
F) Non-occupant Loans on < 5 Family Dwellings (A B C & D)
G) Loans On Manufactured Home Dwelling (A B C & D)
Number
Average Value
Number
Average Value
Number
Average Value
Number
Average Value
Number
Average Value
Number
Average Value
Number
Average Value
LOANS ORIGINATED
7
$291,217
1,790
$237,644
865
$242,582
135
$159,740
2
$1,308,200
392
$256,543
8
$160,766
APPLICATIONS APPROVED, NOT ACCEPTED
1
$375,880
349
$229,656
182
$255,103
36
$188,257
0
$0
79
$234,503
5
$56,360
APPLICATIONS DENIED
0
$0
497
$227,638
532
$261,381
104
$127,716
0
$0
101
$235,922
3
$212,950
APPLICATIONS WITHDRAWN
4
$238,245
463
$258,462
344
$258,981
27
$174,370
0
$0
95
$283,027
1
$88,870
FILES CLOSED FOR INCOMPLETENESS
0
$0
66
$236,101
94
$263,034
3
$160,813
0
$0
5
$283,134
0
$0
Aggregated Statistics For Year 2005 (Based on 6 partial tracts)
A) FHA, FSA/RHS & VA Home Purchase Loans
B) Conventional Home Purchase Loans
C) Refinancings
D) Home Improvement Loans
E) Loans on Dwellings For 5+ Families
F) Non-occupant Loans on < 5 Family Dwellings (A B C & D)
G) Loans On Manufactured Home Dwelling (A B C & D)
Number
Average Value
Number
Average Value
Number
Average Value
Number
Average Value
Number
Average Value
Number
Average Value
Number
Average Value
LOANS ORIGINATED
4
$250,205
1,434
$236,983
919
$225,942
150
$146,269
4
$1,376,068
412
$255,443
6
$132,195
APPLICATIONS APPROVED, NOT ACCEPTED
1
$292,900
197
$225,034
168
$194,420
24
$99,586
0
$0
62
$249,731
2
$27,995
APPLICATIONS DENIED
0
$0
409
$238,185
371
$218,564
91
$113,598
0
$0
127
$249,532
11
$97,025
APPLICATIONS WITHDRAWN
3
$228,293
202
$237,234
320
$215,148
33
$183,822
1
$2,017,200
52
$269,228
1
$47,070
FILES CLOSED FOR INCOMPLETENESS
0
$0
35
$219,657
97
$210,900
8
$173,719
0
$0
17
$190,526
1
$135,460
Aggregated Statistics For Year 2004 (Based on 6 partial tracts)
A) FHA, FSA/RHS & VA Home Purchase Loans
B) Conventional Home Purchase Loans
C) Refinancings
D) Home Improvement Loans
E) Loans on Dwellings For 5+ Families
F) Non-occupant Loans on < 5 Family Dwellings (A B C & D)
G) Loans On Manufactured Home Dwelling (A B C & D)
Number
Average Value
Number
Average Value
Number
Average Value
Number
Average Value
Number
Average Value
Number
Average Value
Number
Average Value
LOANS ORIGINATED
15
$197,143
855
$189,548
663
$172,004
79
$99,792
3
$379,233
293
$211,712
4
$76,545
APPLICATIONS APPROVED, NOT ACCEPTED
2
$294,115
154
$187,839
151
$164,531
17
$117,004
0
$0
51
$210,515
2
$146,840
APPLICATIONS DENIED
5
$167,672
153
$186,885
346
$154,016
79
$72,449
0
$0
59
$161,847
6
$136,513
APPLICATIONS WITHDRAWN
5
$157,798
117
$186,806
238
$164,225
18
$56,408
0
$0
40
$215,113
1
$128,150
FILES CLOSED FOR INCOMPLETENESS
1
$133,140
23
$163,276
82
$179,082
7
$73,873
0
$0
4
$110,890
1
$264,830
Aggregated Statistics For Year 2003 (Based on 6 partial tracts)
A) FHA, FSA/RHS & VA Home Purchase Loans
B) Conventional Home Purchase Loans
C) Refinancings
D) Home Improvement Loans
E) Loans on Dwellings For 5+ Families
F) Non-occupant Loans on < 5 Family Dwellings (A B C & D)
Number
Average Value
Number
Average Value
Number
Average Value
Number
Average Value
Number
Average Value
Number
Average Value
LOANS ORIGINATED
62
$155,162
631
$160,610
861
$148,135
20
$56,397
2
$3,622,245
200
$178,115
APPLICATIONS APPROVED, NOT ACCEPTED
6
$177,787
58
$155,773
145
$140,103
5
$37,498
0
$0
28
$153,325
APPLICATIONS DENIED
3
$175,713
85
$155,759
264
$130,468
28
$21,690
0
$0
23
$163,817
APPLICATIONS WITHDRAWN
6
$131,473
60
$181,299
224
$131,538
8
$40,346
0
$0
21
$201,282
FILES CLOSED FOR INCOMPLETENESS
2
$138,100
8
$133,860
38
$150,960
0
$0
0
$0
5
$146,700
Aggregated Statistics For Year 1999 (Based on 3 partial tracts)
A) FHA, FSA/RHS & VA Home Purchase Loans
B) Conventional Home Purchase Loans
C) Refinancings
D) Home Improvement Loans
E) Loans on Dwellings For 5+ Families
F) Non-occupant Loans on < 5 Family Dwellings (A B C & D)
2006 - 2018 National Fire Incident Reporting System (NFIRS) incidents
According to the data from the years 2006 - 2018 the average number of fires per year is 40. The highest number of fire incidents - 68 took place in 2018, and the least - 3 in 2006. The data has an increasing trend.
When looking into fire subcategories, the most incidents belonged to: Outside Fires (42.5%), and Mobile Property/Vehicle Fires (34.4%).
Fire incident types reported to NFIRS in Zip Code 92203


+$2,538
-$7,562
 Nearest zip codes: 92201, 92211, 92241, 92236, 92210, 92253.


 According to the data from the years 2006 - 2018 the average number of fires per year is 40. The highest number of fire incidents - 68 took place in 2018, and the least - 3 in 2006. The data has an increasing trend.
 When looking into fire subcategories, the most incidents belonged to: Outside Fires (42.5%), and Mobile Property/Vehicle Fires (34.4%).