Estimated zip code population in 2022: 26,825 Zip code population in 2010: 21,583 Zip code population in 2000: 14,538
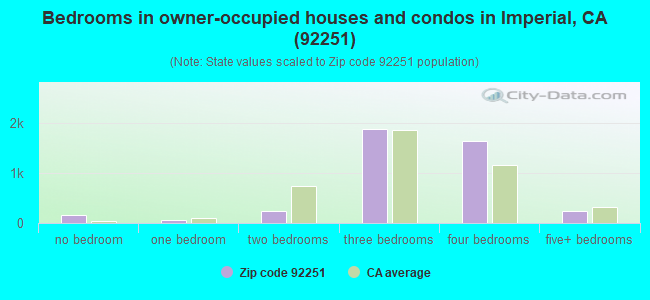
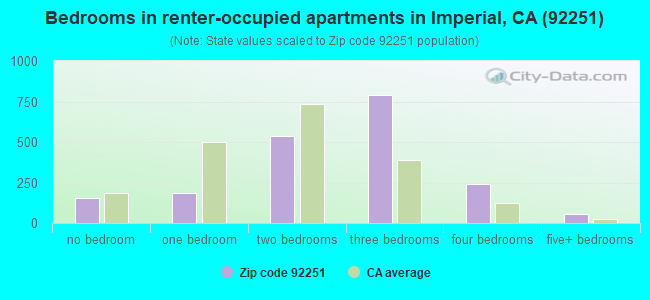
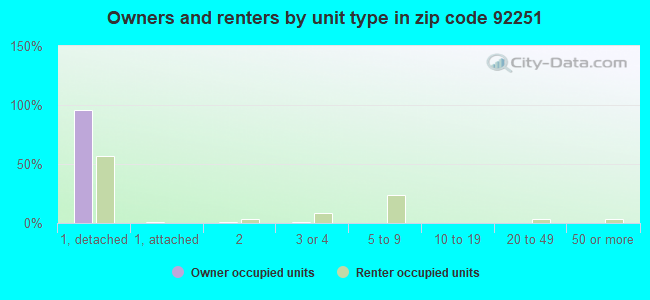
Houses and condos: 7,362 Renter-occupied apartments: 1,960
% of renters here:
32%
State:
44%
March 2022 cost of living index in zip code 92251: 93.3 (less than average, U.S. average is 100)
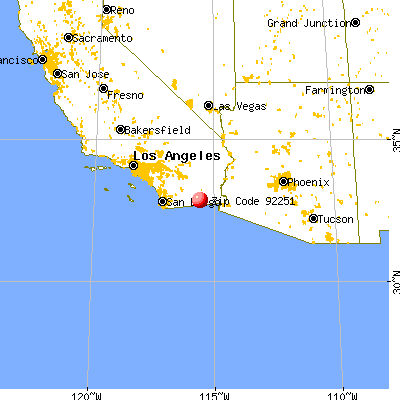
Land area: 199.5 sq. mi. Water area: 0.0 sq. mi.
Population density: 134 people per square mile
(very low).
OSM Map
General Map
Google Map
MSN Map
OSM Map
General Map
Google Map
MSN Map
OSM Map
General Map
Google Map
MSN Map
OSM Map
General Map
Google Map
MSN Map
Please wait while loading the map...
Real estate property taxes paid for housing units in 2022:
This zip code:
0.8% ($2,889)
California:
0.7% ($4,831)
Median real estate property taxes paid for housing units with mortgages in 2022: $3,043 (0.9%) Median real estate property taxes paid for housing units with no mortgage in 2022: $2,538 (0.7%)
Estimated median house/condo value in 2022: $340,522
92251:
$340,522
California:
$715,900
According to our research of California and other state lists, there were 22 registered sex offenders living in 92251 zip code as of April 17, 2024. The ratio of all residents to sex offenders in zip code 92251 is 1,037 to 1. The ratio of registered sex offenders to all residents in this zip code is lower than the state average.
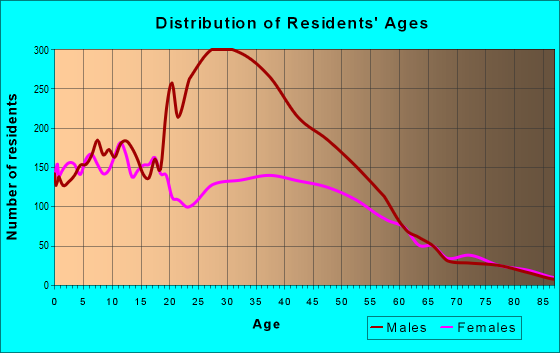
Median resident age:
This zip code:
33.7 years
California median age:
37.9 years
Average household size:
This zip code:
3.8 people
California:
2.8 people
Averages for the 2020 tax year for zip code 92251, filed in 2021:
Average Adjusted Gross Income (AGI) in 2020: $61,760 (Individual Income Tax Returns)
Here:
$61,760
State:
$95,910
Salary/wage: $59,229 (reported on 87.4% of returns)
Here:
$59,229
State:
$77,331
(% of AGI for various income ranges: 1221.9% for AGIs below $25k, 3666.1% for AGIs $25k-50k, 7515.0% for AGIs $50k-75k, 11196.0% for AGIs $75k-100k, 20406.8% for AGIs $100k-200k, 75233.3% for AGIs over 200k)
Taxable interest for individuals: $323 (reported on 33.1% of returns)
This zip code:
$323
California:
$2,294
(% of AGI for various income ranges: 7.1% for AGIs below $25k, 6.2% for AGIs $25k-50k, 13.4% for AGIs $50k-75k, 13.9% for AGIs $75k-100k, 30.1% for AGIs $100k-200k, 421.7% for AGIs over 200k)
Ordinary dividends: $1,216 (reported on 4.2% of returns)
Here:
$1,216
State:
$10,949
(% of AGI for various income ranges: 2.4% for AGIs below $25k, 3.4% for AGIs $25k-50k, 5.7% for AGIs $50k-75k, 16.4% for AGIs $75k-100k, 13.9% for AGIs $100k-200k, 111.7% for AGIs over 200k)
Net capital gain/loss in AGI: +$8,032 (reported on 5.1% of returns)
Here:
+$8,032
State:
+$49,306
(% of AGI for various income ranges: 2.1% for AGIs below $25k, 6.1% for AGIs $25k-50k, 8.7% for AGIs $50k-75k, 44.6% for AGIs $75k-100k, 119.8% for AGIs $100k-200k, 3923.3% for AGIs over 200k)
Profit/loss from business: +$8,282 (reported on 10.9% of returns)
Here:
+$8,282
State:
+$15,671
(% of AGI for various income ranges: 71.9% for AGIs below $25k, 104.9% for AGIs $25k-50k, 79.3% for AGIs $50k-75k, 152.4% for AGIs $75k-100k, 232.2% for AGIs $100k-200k, 2005.0% for AGIs over 200k)
Taxable individual retirement arrangement distribution: $20,726 (reported on 2.6% of returns)
92251:
$20,726
California:
$23,505
(% of AGI for various income ranges: 12.2% for AGIs below $25k, 33.4% for AGIs $25k-50k, 71.6% for AGIs $50k-75k, 77.0% for AGIs $75k-100k, 307.0% for AGIs $100k-200k)
Total itemized deductions: $25,477 (reported on 11.4% of returns)
Here:
$25,477
State:
$39,517
(% of AGI for various income ranges: 25.1% for AGIs below $25k, 94.2% for AGIs $25k-50k, 429.5% for AGIs $50k-75k, 882.6% for AGIs $75k-100k, 1209.4% for AGIs $100k-200k, 4111.7% for AGIs over 200k)
Charity contributions: $4,646 (reported on 9.3% of returns)
Here:
$4,646
State:
$12,598
(% of AGI for various income ranges: 12.3% for AGIs $25k-50k, 48.5% for AGIs $50k-75k, 102.3% for AGIs $75k-100k, 207.3% for AGIs $100k-200k, 1091.7% for AGIs over 200k)
Taxes paid: $9,415 (reported on 11.4% of returns)
92251:
$9,415
State:
$8,807
(% of AGI for various income ranges: 6.0% for AGIs below $25k, 31.5% for AGIs $25k-50k, 153.7% for AGIs $50k-75k, 336.2% for AGIs $75k-100k, 475.0% for AGIs $100k-200k, 1200.0% for AGIs over 200k)
Earned income credit: $2,254 (reported on 18.6% of returns)
Here:
$2,254
State:
$2,074
(% of AGI for various income ranges: 113.6% for AGIs below $25k, 102.5% for AGIs $25k-50k, 2.0% for AGIs $50k-75k)
Percentage of individuals using paid preparers for their 2020 taxes: 91.0%
Here:
91%
State:
92%
(% for various income ranges: 87.1% for AGIs below $25k, 92.4% for AGIs $25k-50k, 93.2% for AGIs $50k-75k, 93.8% for AGIs $75k-100k, 91.8% for AGIs $100k-200k, 91.3% for AGIs over 200k)
Averages for the 2012 tax year for zip code 92251, filed in 2013:
Average Adjusted Gross Income (AGI) in 2012: $55,587 (Individual Income Tax Returns)
Here:
$55,587
State:
$72,726
Salary/wage: $53,300 (reported on 91.3% of returns)
Here:
$53,300
State:
$59,079
(% of AGI for various income ranges: 75.9% for AGIs below $25k, 86.7% for AGIs $25k-50k, 90.3% for AGIs $50k-75k, 91.0% for AGIs $75k-100k, 90.2% for AGIs $100k-200k, 66.8% for AGIs over 200k)
Taxable interest for individuals: $403 (reported on 33.1% of returns)
This zip code:
$403
California:
$2,146
(% of AGI for various income ranges: 0.6% for AGIs below $25k, 0.2% for AGIs $25k-50k, 0.3% for AGIs $50k-75k, 0.1% for AGIs $75k-100k, 0.2% for AGIs $100k-200k, 0.8% for AGIs over 200k)
Ordinary dividends: $1,194 (reported on 4.9% of returns)
Here:
$1,194
State:
$9,308
(% of AGI for various income ranges: 0.3% for AGIs below $25k, 0.1% for AGIs $50k-75k, 0.2% for AGIs $100k-200k)
Net capital gain/loss in AGI: +$3,192 (reported on 3.6% of returns)
Here:
+$3,192
State:
+$30,460
(% of AGI for various income ranges: 0.4% for AGIs $100k-200k, 1.1% for AGIs over 200k)
Profit/loss from business: +$10,130 (reported on 11.5% of returns)
Here:
+$10,130
State:
+$17,064
(% of AGI for various income ranges: 8.3% for AGIs below $25k, 2.4% for AGIs $25k-50k, 1.1% for AGIs $50k-75k, 1.7% for AGIs $75k-100k, 1.7% for AGIs $100k-200k)
Taxable individual retirement arrangement distribution: $12,518 (reported on 3.1% of returns)
92251:
$12,518
California:
$19,557
(% of AGI for various income ranges: 1.2% for AGIs below $25k, 0.7% for AGIs $25k-50k, 0.7% for AGIs $50k-75k, 0.5% for AGIs $75k-100k, 0.8% for AGIs $100k-200k)
Total itemized deductions: $22,680 (25% of AGI, reported on 38.6% of returns)
Here:
$22,680
State:
$34,004
Here:
24.8% of AGI
State:
22.7% of AGI
(% of AGI for various income ranges: 5.4% for AGIs below $25k, 10.2% for AGIs $25k-50k, 14.6% for AGIs $50k-75k, 21.9% for AGIs $75k-100k, 17.1% for AGIs $100k-200k, 16.0% for AGIs over 200k)
Charity contributions: $2,329 (reported on 31.0% of returns)
Here:
$2,329
State:
$4,659
(% of AGI for various income ranges: 0.4% for AGIs below $25k, 0.8% for AGIs $25k-50k, 1.1% for AGIs $50k-75k, 1.5% for AGIs $75k-100k, 1.7% for AGIs $100k-200k, 1.3% for AGIs over 200k)
Taxes paid: $7,083 (reported on 38.6% of returns)
92251:
$7,083
State:
$14,448
(% of AGI for various income ranges: 1.0% for AGIs below $25k, 2.5% for AGIs $25k-50k, 4.3% for AGIs $50k-75k, 5.5% for AGIs $75k-100k, 6.4% for AGIs $100k-200k, 7.8% for AGIs over 200k)
Earned income credit: $2,274 (reported on 23.6% of returns)
Here:
$2,274
State:
$2,286
(% of AGI for various income ranges: 9.1% for AGIs below $25k, 1.9% for AGIs $25k-50k)
Percentage of individuals using paid preparers for their 2012 taxes: 64.5%
Here:
65%
State:
64%
(% for various income ranges: 63.0% for AGIs below $25k, 64.5% for AGIs $25k-50k, 65.3% for AGIs $50k-75k, 66.3% for AGIs $75k-100k, 64.0% for AGIs $100k-200k, 85.7% for AGIs over 200k)
Averages for the 2004 tax year for zip code 92251, filed in 2005:
Average Adjusted Gross Income (AGI) in 2004: $47,011 (Individual Income Tax Returns)
Here:
$47,011
State:
$58,600
Salary/wage: $45,210 (reported on 91.7% of returns)
Here:
$45,210
State:
$49,455
(% of AGI for various income ranges: 112.0% for AGIs below $10k, 80.8% for AGIs $10k-25k, 88.1% for AGIs $25k-50k, 92.4% for AGIs $50k-75k, 93.5% for AGIs $75k-100k, 81.0% for AGIs over 100k)
Taxable interest for individuals: $532 (reported on 45.6% of returns)
This zip code:
$532
California:
$2,365
(% of AGI for various income ranges: 2.0% for AGIs below $10k, 0.6% for AGIs $10k-25k, 0.5% for AGIs $25k-50k, 0.3% for AGIs $50k-75k, 0.2% for AGIs $75k-100k, 0.9% for AGIs over 100k)
Taxable dividends: $765 (reported on 7.9% of returns)
Here:
$765
State:
$4,746
(% of AGI for various income ranges: 1.4% for AGIs below $10k, 0.1% for AGIs $10k-25k, 0.1% for AGIs $25k-50k, 0.1% for AGIs $50k-75k, 0.1% for AGIs $75k-100k, 0.2% for AGIs over 100k)
Net capital gain/loss: +$8,291 (reported on 6.8% of returns)
Here:
+$8,291
State:
+$23,418
(% of AGI for various income ranges: 2.0% for AGIs below $10k, 0.0% for AGIs $10k-25k, 0.2% for AGIs $25k-50k, 0.1% for AGIs $50k-75k, 0.5% for AGIs $75k-100k, 3.8% for AGIs over 100k)
Profit/loss from business: +$10,095 (reported on 12.5% of returns)
Here:
+$10,095
State:
+$16,826
(% of AGI for various income ranges: 5.3% for AGIs below $10k, 5.5% for AGIs $10k-25k, 3.1% for AGIs $25k-50k, 1.3% for AGIs $50k-75k, 0.9% for AGIs $75k-100k, 4.2% for AGIs over 100k)
Profit/loss from farming: +$7,143 (reported on 0.3% of returns)
Here:
+$7,143
State:
-$7,562
IRA payment deduction: $2,984 (reported on 1.3% of returns)
92251:
$2,984
California:
$3,192
(% of AGI for various income ranges: 0.1% for AGIs $25k-50k, 0.1% for AGIs $50k-75k, 0.1% for AGIs $75k-100k, 0.1% for AGIs over 100k)
Total itemized deductions: $18,755 (24% of AGI, reported on 42.2% of returns)
Here:
$18,755
State:
$28,113
Here:
24.2% of AGI
State:
25.3% of AGI
(% of AGI for various income ranges: 7.2% for AGIs below $10k, 6.1% for AGIs $10k-25k, 13.4% for AGIs $25k-50k, 19.4% for AGIs $50k-75k, 19.8% for AGIs $75k-100k, 17.9% for AGIs over 100k)
Charity contributions deductions: $2,264 (3% of AGI, reported on 37.0% of returns)
Here:
$2,264
State:
$3,923
Here:
2.8% of AGI
State:
3.3% of AGI
(% of AGI for various income ranges: 0.5% for AGIs $10k-25k, 1.3% for AGIs $25k-50k, 1.8% for AGIs $50k-75k, 2.2% for AGIs $75k-100k, 2.2% for AGIs over 100k)
Total tax: $5,563 (reported on 72.5% of returns)
92251:
$5,563
State:
$10,761
(% of AGI for various income ranges: 2.6% for AGIs below $10k, 3.2% for AGIs $10k-25k, 5.1% for AGIs $25k-50k, 6.9% for AGIs $50k-75k, 8.5% for AGIs $75k-100k, 14.4% for AGIs over 100k)
Earned income credit: $1,826 (reported on 20.3% of returns)
Here:
$1,826
State:
$1,763
Percentage of individuals using paid preparers for their 2004 taxes: 68.7%
Here:
69%
State:
66%
(% for various income ranges: 61.9% for AGIs below $10k, 69.7% for AGIs $10k-25k, 69.7% for AGIs $25k-50k, 71.0% for AGIs $50k-75k, 66.8% for AGIs $75k-100k, 72.9% for AGIs over 100k)
Household received Food Stamps/SNAP in the past 12 months: 1,103 Household did not receive Food Stamps/SNAP in the past 12 months: 5,120
Women who had a birth in the past 12 months: 650 (56 now married, 602 unmarried) Women who did not have a birth in the past 12 months: 5,379 (1,964 now married, 3,421 unmarried)
Housing units in zip code 92251 with a mortgage: 2,999 (80 second mortgage, 74 both second mortgage and home equity loan) Houses without a mortgage: 115
Median monthly owner costs for units with a mortgage: $1,776 Median monthly owner costs for units without a mortgage: $671
Residents with income below the poverty level in 2022:
This zip code:
12.9%
Whole state:
12.2%
Residents with income below 50% of the poverty level in 2022:
This zip code:
5.0%
Whole state:
6.2%
Median number of rooms in houses and condos:
Here:
6.1
State:
6.0
Median number of rooms in apartments:
Here:
4.7
State:
3.9
Notable locations in this zip code not listed on our city pages
Notable locations in zip code 92251: Motor Vu Twin Drive-In (A), Valley Fish Farms (B), Tamarack Ranch (C), Imperial Valley Pioneer Museum (D), Imperial Public Library (E), Imperial City Hall (F), Desert Air Ambulance (G), Centinela State Prison Fire Department (H), Imperial County Fire Department Station 1 - Imperial City Fire Station 4 (I). Display/hide their locations on the map
Parks in zip code 92251 include: City Park (1), Emerson Park (2), Evans Park (3), Irving Park (4), California Mid-Winter Fairgrounds (5). Display/hide their locations on the map
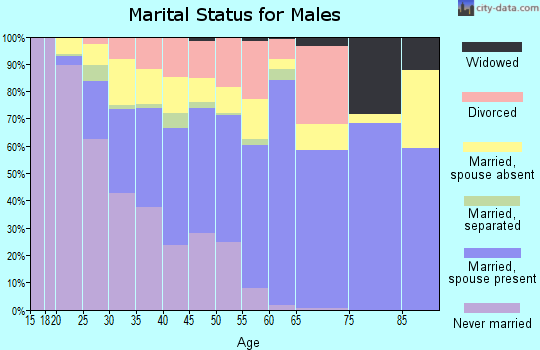
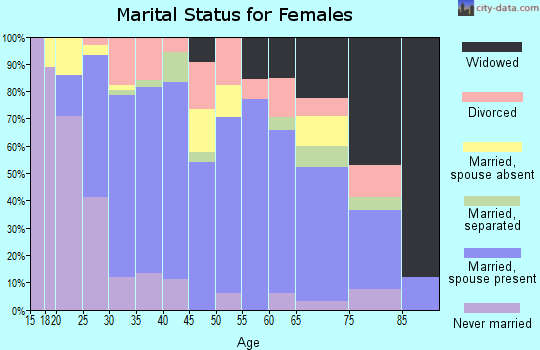
3,463 married couples with children.
2,000 single-parent households (331 men, 1,669 women).
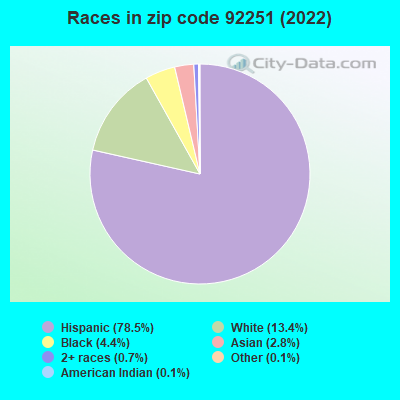
35.5% of residents of 92251 zip code speak English at home.
61.4% of residents speak Spanish at home (67% very well, 17% well, 8% not well, 8% not at all).
0.2% of residents speak other Indo-European language at home (100% very well).
2.0% of residents speak Asian or Pacific Island language at home (34% very well, 25% well, 40% not well).
1.1% of residents speak other language at home (100% very well).
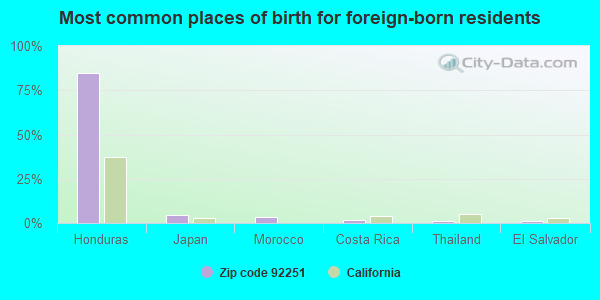
Foreign born population: 6,367 (23.7%) (62.5% of them are naturalized citizens)
This zip code:
23.7%
Whole state:
26.7%
85%Honduras
4%Japan
4%Morocco
1%Costa Rica
1%Thailand
1%El Salvador
1%Guatemala
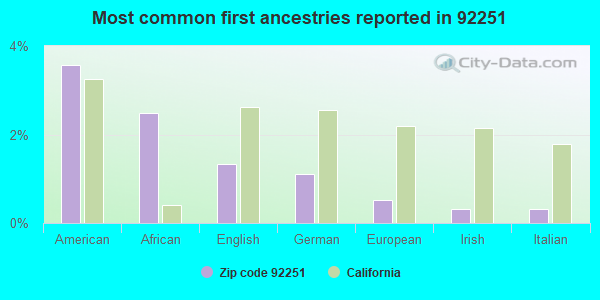
4%American
2%African
1%English
1%German
1%European
0%Irish
0%Italian
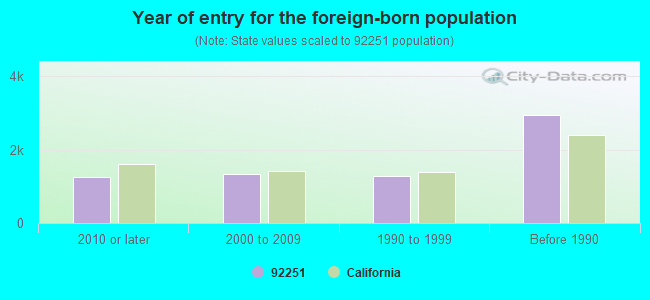
Year of entry for the foreign-born population
1,2562010 or later
1,3452000 to 2009
1,2771990 to 1999
2,947Before 1990
Major facilities with environmental interests located in this zip code:
IMPERIAL IRRIGATION DISTRICT (333 EAST BARIONI BLVD in IMPERIAL, CA)
SUPERFUND (Superfund database) STATE MASTER (California - Hazardous Waste Tracking) - HAZARDOU WASTE PROGRAM COMPLIANCE ACTIVITY (Tracking inspections of insecticide, fungicide, and rodenticide, and toxic substances) HAZARDOUS WASTE BIENNIAL REPORTER (Resource Conservation and Recovery Act (tracking hazardous waste)) Large Quantity Generators, more that 1000 kg of hazardous waste/month (Resource Conservation and Recovery Act (tracking hazardous waste))
CALIFORNIA DEPARTMENT OF CORRECTIONS CENTINELA STATE PRISON (2302 BROWN ROAD in IMPERIAL, CA)
STATE MASTER (California - Hazardous Waste Tracking) - HAZARDOU WASTE PROGRAM National Pollutant Discharge Elimination System NON-MAJOR (Tracking pollutant discharge elimination systems) - permit Small Quantity Generators, between 100 kg and 1000 kg of hazardous waste/month (Resource Conservation and Recovery Act (tracking hazardous waste)) - notification COMMUNITY WATER SYSTEM (SDWIS) Business SIC classification: CORRECTIONAL INSTITUTIONS Organizations: CA DEPT OF CORRECTIONS (CONTACT/OWNER)
, DEPT OF CORRECTIONS (CONTACT/OWNER)
Alternative names: CA DEPT OF CORRECTIONS, CDC CENTINELA STATE PRISON, CENTINELA STATE PRISON 98-014
EMPIRE SOUTHWEST LLC (3393 HIGHWAY 86 in IMPERIAL, CA) . Federal Facility
STATE MASTER (California - Hazardous Waste Tracking) - HAZARDOU WASTE PROGRAM Large Quantity Generators, more that 1000 kg of hazardous waste/month (Resource Conservation and Recovery Act (tracking hazardous waste)) Alternative names: EMPIRE MACHINERY CO
IMPERIAL HIGH SCHOOL (517 W BARIONI BLVD in IMPERIAL, CA)
(National Center for Education Statistics) - STATE ID-1335900 Small Quantity Generators, between 100 kg and 1000 kg of hazardous waste/month (Resource Conservation and Recovery Act (tracking hazardous waste)) Organizations: IMPERIAL UNIFIED SCHOOLS (CONTACT/OWNER)
, IMPERIAL UNIFIED (SCHOOL DISTRICT)
ALLIED IMPERIAL LANDFILL (104 EAST ROBINSON ROAD in IMPERIAL, CA)
IMPERIAL SOLID WASTE SITE (WORTHINGTON & NEW RIVER in IMPERIAL, CA)
STATE MASTER (California Solid Waste disposal sites tracking) - REFUSE DISPOSAL REFUSE DISPOSAL (Solid waste facilities tracking) Organizations: COUNTY OF IMPERIAL PUBLIC WORKS (CONTACT/OPERATOR)
FOOTE PHOTO CO (200 E SECOND ST in IMPERIAL, CA)
STATE MASTER (California - Hazardous Waste Tracking) - HAZARDOU WASTE PROGRAM Small Quantity Generators, between 100 kg and 1000 kg of hazardous waste/month (Resource Conservation and Recovery Act (tracking hazardous waste)) - notification Organizations: ROBIN GRAY (CONTACT/OWNER)
HULSE (BEN) ELEMENTARY (303 S. D ST. in IMPERIAL, CA)
(National Center for Education Statistics) - STATE ID-6008551 Organizations: IMPERIAL UNIFIED (SCHOOL DISTRICT)
IMPERIAL AVE. HOLBROOK HIGH (CONT.) (322 N IMPERIAL AVE. in IMPERIAL, CA)
(National Center for Education Statistics) - STATE ID-1331115 Organizations: IMPERIAL UNIFIED (SCHOOL DISTRICT)
NEW CHARLESTON POWER 1 LP (3559 HIGHWAY 111 in IMPERIAL, CA)
CRITERIA AND HAZARDOUS AIR POLLUTANT INVENTORY (Inventory of air pollution sources) National Pollutant Discharge Elimination System NON-MAJOR (Tracking pollutant discharge elimination systems) - permit Small Quantity Generators, between 100 kg and 1000 kg of hazardous waste/month (Resource Conservation and Recovery Act (tracking hazardous waste)) - notification Business SIC classification: ELECTRIC SERVICES Organizations: NEW CHARLESTON POWER I LP (CONTACT/OWNER)
Alternative names: CHATEAU ENERGY INC., NEW CHARLESTON POWER 1 93-010, NEW CHARLESTON POWER I L P, NEW CHARLESTON POWER I LP, NEW CHARLESTON POWER L.P.
CALTRANS - IMPERIAL WAREHOUSE (301 EAST ROBINSON ROAD in IMPERIAL, CA)
IMPERIAL CCD WWTP (380 EAST ATEN ROAD in IMPERIAL, CA)
National Pollutant Discharge Elimination System NON-MAJOR (Tracking pollutant discharge elimination systems) - permit Business SIC classification: JUNIOR COLLEGES AND TECHNICAL INSTITUTES Organizations: IMPERIAL COMMUN COLLEGE DIST (CONTACT/OWNER)
Alternative names: IMP COMM COLLEGE WTP 94-015, IMPERIAL COMMUN COLLEGE DIST
Housing units lacking complete plumbing facilities: 0.7% Housing units lacking complete kitchen facilities: 2.1%
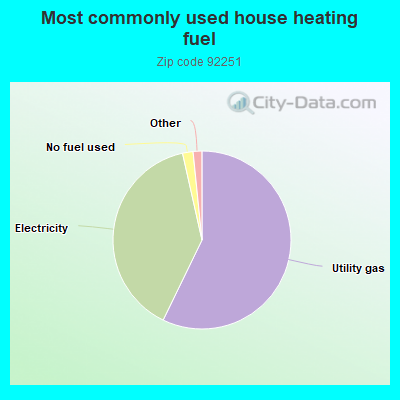
57.2%Utility gas
39.3%Electricity
1.9%No fuel used
0.7%Bottled, tank, or LP gas
0.6%Wood
Population in 1990: 6,092. Population change in the 1990s: +8,446 (+138.6%).
Place of birth for U.S.-born residents:
This state: 17,523
Northeast: 163
Midwest: 882
South: 458
West: 935
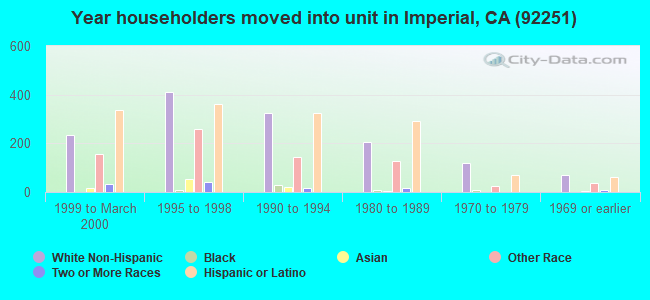
39% of the 92251 zip code residents lived in the same house 5 years ago. Out of people who lived in different houses, 35% lived in this county. Out of people who lived in different counties, 50% lived in California.
97% of the 92251 zip code residents lived in the same house 1 year ago. Out of people who lived in different houses, 51% moved from this county. Out of people who lived in different houses, 47% moved from different county within same state. Out of people who lived in different houses, 15% moved from different state.
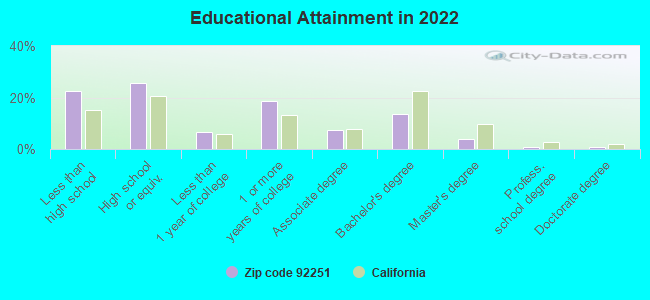
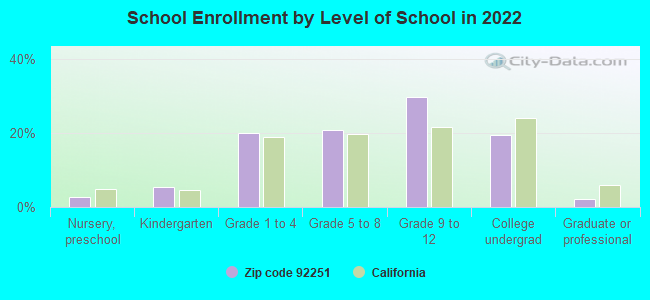
Private vs. public school enrollment:
Students in private schools in grades 1 to 8 (elementary and middle school): 112
Here:
3.3%
California:
10.5%
Students in private schools in grades 9 to 12 (high school): 56
Here:
2.2%
California:
8.5%
Students in private undergraduate colleges: 44
Here:
2.7%
California:
15.9%
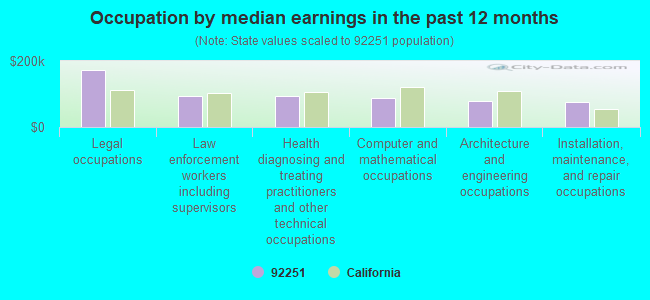
Occupation by median earnings in the past 12 months ($)
173,266Legal occupations
93,211Law enforcement workers including supervisors
92,470Health diagnosing and treating practitioners and other technical occupations
88,022Computer and mathematical occupations
79,107Architecture and engineering occupations
75,506Installation, maintenance, and repair occupations
Companies with federal contracts located in this zip code (IMPERIAL, CA):
SUBURBAN SANITATION OF CALIFOR (3354 DOGWOOD ROAD) : $951,373 in 20 contractsfrom 2001 to 2006
Contracts for Trash/Garbage Collection Services - Including Portable Sanitation Services by Bureau of Land Management, Navy Signed by year:2000: $0; 2001: $283,653; 2002: $150,003; 2003: $235,636; 2004: $0; 2005: $284,247; 2006: -$2,166.
Biggest contracts:
$160,000 with Bureau of Land Management for Trash/Garbage Collection Services - Including Portable Sanitation Services. Signed on 2001-09-15. Completion date: 2001-09-15.
$156,939 with Navy for Trash/Garbage Collection Services - Including Portable Sanitation Services. Signed on 2005-11-30. Completion date: 2009-09-30.
$124,578, same as above.Signed on 2005-01-28. Completion date: 2009-09-30.
$105,000 with Bureau of Land Management for Trash/Garbage Collection Services - Including Portable Sanitation Services. Signed on 2001-04-15. Completion date: 2001-09-15.
IMPERIAL FLYING SERVICE INC (1095 AIRPORT RD; small business)
$923,300 with Defense Logistics Agency for Liquid Propellants and Fuels, Petroleum Base. Signed on 2000-02-01. Completion date: 2003-03-31.
ALL VALLEY FENCE & SUPPLY (415 W ATEN RD; small business) : $196,641 in 16 contractsfrom 2002 to 2006
Contracts for Fencing, Fences, Gates and Components, Maintenance, Repair or Alteration of Real Property -- Other Non-Building Facilities, Quality Control Services -- Construction, Mining, Excavating, and Highway Maintenance Equipment, Miscellaneous Items by Army, Navy, Public Buildings Service, Department of Defense, and others Signed by year:2000: $0; 2001: $0; 2002: $9,800; 2003: $103,219; 2004: $51,120; 2005: $29,592; 2006: $2,910.
Biggest contracts:
$49,800 with Army for Fencing, Fences, Gates and Components. Taking place in AZ. Signed on 2003-07-24. Completion date: 2003-10-16.
$29,996, same as above.Signed on 2004-05-17. Completion date: 2003-10-16.
$21,120, same as above.Signed on 2003-08-16. Completion date: 2003-10-16.
$17,747, same as above.Signed on 2003-05-29. Completion date: 2003-06-11.
EMPIRE SOUTHWEST, LLC (3393 HWY 86) : $180,000 in 4 contractsfrom 2000 to 2001
$63,000 with U.S. Fish and Wildlife Service for Soil Preparation Equipment. Signed on 2000-11-15. Completion date: 2000-12-15.
$50,000 with Bureau of Reclamation for Maintenance, Repair and Rebuilding of Equipment -- Construction, Mining, Excavating, and Highway Maintenance Equipment. Signed on 2000-08-15. Completion date: 2000-10-15.
$38,000, same as above.Signed on 2001-02-15. Completion date: 2001-04-15.
$29,000, same as above.Signed on 2001-02-15. Completion date: 2001-04-15.
REPUBLIC IMPERIAL ACQUISITION, (104 E ROBINSON RD) : $163,308 in 12 contractsfrom 1999 to 2004
Contracts for Trash/Garbage Collection Services - Including Portable Sanitation Services by Navy Signed by year:2000: $94,546; 2001: $2,335; 2002: $0; 2003: $0; 2004: $14,535; 2005: $0; 2006: $0.
Biggest contracts:
$82,793 with Navy for Trash/Garbage Collection Services - Including Portable Sanitation Services. Signed on 2000-10-01. Completion date: 2001-09-30.
$51,892, same as above.Signed on 1999-11-08. Completion date: 2000-09-30.
$14,535, same as above.Signed on 2004-11-30. Completion date: 2005-01-31.
$11,753, same as above.Signed on 2000-06-09. Completion date: 2000-09-30.
Top industries in this zip code by the number of employees in 2005:
Finance and Insurance: Commercial Banking (100-249 employees: 1 establishment)
Construction: Commercial and Institutional Building Construction (20-49: 2, 1-4: 2)
Wholesale Trade: Farm and Garden Machinery and Equipment Merchant Wholesalers (20-49: 1, 10-19: 1)
Health Care and Social Assistance: Residential Mental Retardation Facilities (10-19: 3)
Other Services (except Public Administration): Religious Organizations (20-49: 1, 1-4: 4)
People in group quarters in 2010:
4,504 people in state prisons
31 people in nursing facilities/skilled-nursing facilities
People in group quarters in 2000:
4,472 people in state prisons
29 people in nursing homes
24 people in homes or halfway houses for drug/alcohol abuse
Fatal accident statistics in 2014:
Fatal accident count: 4
Vehicles involved in fatal accidents: 6
Fatal accidents caused by drunken drivers: 1
Fatalities: 4
Persons involved in fatal accidents: 13
Pedestrians involved in fatal accidents: 1
Fatal accident statistics in 2013:
Fatal accident count: 4
Vehicles involved in fatal accidents: 6
Fatal accidents caused by drunken drivers: 0
Fatalities: 4
Persons involved in fatal accidents: 10
Pedestrians involved in fatal accidents: 1
Home Mortgage Disclosure Act Aggregated Statistics For Year 2009 (Based on 2 full and 4 partial tracts)
A) FHA, FSA/RHS & VA Home Purchase Loans
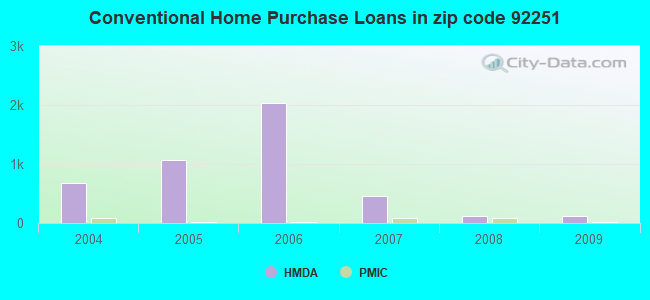
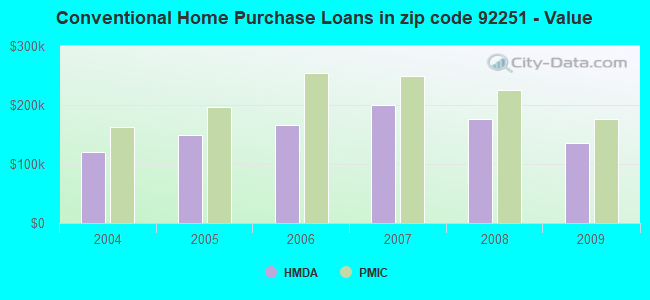
B) Conventional Home Purchase Loans
C) Refinancings
D) Home Improvement Loans
F) Non-occupant Loans on < 5 Family Dwellings (A B C & D)
G) Loans On Manufactured Home Dwelling (A B C & D)
Number
Average Value
Number
Average Value
Number
Average Value
Number
Average Value
Number
Average Value
Number
Average Value
LOANS ORIGINATED
432
$160,057
113
$135,854
162
$184,389
13
$104,744
30
$87,578
4
$83,532
APPLICATIONS APPROVED, NOT ACCEPTED
22
$161,232
11
$118,809
15
$248,535
2
$72,725
6
$92,462
1
$102,340
APPLICATIONS DENIED
63
$166,271
22
$117,578
100
$176,687
11
$120,343
8
$106,478
3
$184,690
APPLICATIONS WITHDRAWN
86
$168,178
18
$129,104
78
$196,479
1
$152,020
8
$167,609
4
$127,685
FILES CLOSED FOR INCOMPLETENESS
8
$214,211
6
$155,018
16
$175,891
1
$57,300
2
$178,130
0
$0
Aggregated Statistics For Year 2008 (Based on 2 full and 4 partial tracts)
A) FHA, FSA/RHS & VA Home Purchase Loans
B) Conventional Home Purchase Loans
C) Refinancings
D) Home Improvement Loans
F) Non-occupant Loans on < 5 Family Dwellings (A B C & D)
G) Loans On Manufactured Home Dwelling (A B C & D)
Number
Average Value
Number
Average Value
Number
Average Value
Number
Average Value
Number
Average Value
Number
Average Value
LOANS ORIGINATED
321
$196,278
124
$176,054
149
$169,064
25
$98,430
43
$140,004
2
$205,655
APPLICATIONS APPROVED, NOT ACCEPTED
24
$215,821
39
$175,753
59
$205,918
16
$43,551
10
$167,675
0
$0
APPLICATIONS DENIED
83
$225,411
73
$201,659
417
$192,175
83
$120,001
35
$188,498
26
$116,313
APPLICATIONS WITHDRAWN
83
$182,943
26
$169,537
103
$192,655
11
$168,871
3
$170,987
3
$139,510
FILES CLOSED FOR INCOMPLETENESS
4
$166,280
14
$162,070
32
$197,038
0
$0
4
$99,040
3
$130,163
Aggregated Statistics For Year 2007 (Based on 2 full and 4 partial tracts)
A) FHA, FSA/RHS & VA Home Purchase Loans
B) Conventional Home Purchase Loans
C) Refinancings
D) Home Improvement Loans
F) Non-occupant Loans on < 5 Family Dwellings (A B C & D)
G) Loans On Manufactured Home Dwelling (A B C & D)
Number
Average Value
Number
Average Value
Number
Average Value
Number
Average Value
Number
Average Value
Number
Average Value
LOANS ORIGINATED
54
$231,076
453
$200,120
428
$174,681
109
$87,871
57
$159,192
12
$139,962
APPLICATIONS APPROVED, NOT ACCEPTED
6
$142,897
157
$193,018
132
$174,353
25
$115,485
19
$148,857
8
$130,800
APPLICATIONS DENIED
6
$211,793
204
$206,491
668
$203,532
128
$90,765
63
$198,511
31
$120,894
APPLICATIONS WITHDRAWN
12
$241,393
124
$216,513
332
$204,093
26
$108,103
23
$191,073
7
$123,961
FILES CLOSED FOR INCOMPLETENESS
2
$342,570
30
$206,458
87
$241,899
4
$189,668
10
$145,185
1
$117,430
Aggregated Statistics For Year 2006 (Based on 2 full and 4 partial tracts)
A) FHA, FSA/RHS & VA Home Purchase Loans
B) Conventional Home Purchase Loans
C) Refinancings
D) Home Improvement Loans
F) Non-occupant Loans on < 5 Family Dwellings (A B C & D)
G) Loans On Manufactured Home Dwelling (A B C & D)
Number
Average Value
Number
Average Value
Number
Average Value
Number
Average Value
Number
Average Value
Number
Average Value
LOANS ORIGINATED
32
$254,050
2,032
$166,939
901
$175,684
158
$87,329
262
$180,412
26
$152,433
APPLICATIONS APPROVED, NOT ACCEPTED
0
$0
611
$176,422
170
$189,261
29
$127,813
50
$199,370
8
$103,841
APPLICATIONS DENIED
4
$236,832
471
$161,354
520
$189,286
130
$88,784
72
$180,206
19
$159,731
APPLICATIONS WITHDRAWN
18
$242,749
467
$169,424
483
$187,846
68
$151,371
57
$186,970
6
$127,050
FILES CLOSED FOR INCOMPLETENESS
2
$194,250
62
$171,672
122
$204,511
5
$188,538
15
$185,301
5
$174,664
Aggregated Statistics For Year 2005 (Based on 2 full and 4 partial tracts)
A) FHA, FSA/RHS & VA Home Purchase Loans
B) Conventional Home Purchase Loans
C) Refinancings
D) Home Improvement Loans
E) Loans on Dwellings For 5+ Families
F) Non-occupant Loans on < 5 Family Dwellings (A B C & D)
G) Loans On Manufactured Home Dwelling (A B C & D)
Number
Average Value
Number
Average Value
Number
Average Value
Number
Average Value
Number
Average Value
Number
Average Value
Number
Average Value
LOANS ORIGINATED
24
$197,076
1,063
$149,875
1,032
$173,003
237
$105,957
4
$339,700
226
$148,943
30
$109,217
APPLICATIONS APPROVED, NOT ACCEPTED
3
$167,853
228
$148,857
192
$166,658
33
$107,344
0
$0
33
$168,752
21
$78,149
APPLICATIONS DENIED
5
$129,338
250
$170,069
510
$156,518
106
$96,647
0
$0
64
$158,271
21
$102,849
APPLICATIONS WITHDRAWN
0
$0
249
$173,570
396
$159,579
49
$146,306
0
$0
41
$164,147
9
$121,793
FILES CLOSED FOR INCOMPLETENESS
6
$173,837
72
$126,192
202
$156,340
16
$86,166
0
$0
10
$183,284
6
$123,698
Aggregated Statistics For Year 2004 (Based on 2 full and 4 partial tracts)
A) FHA, FSA/RHS & VA Home Purchase Loans
B) Conventional Home Purchase Loans
C) Refinancings
D) Home Improvement Loans
F) Non-occupant Loans on < 5 Family Dwellings (A B C & D)
G) Loans On Manufactured Home Dwelling (A B C & D)
2005 - 2018 National Fire Incident Reporting System (NFIRS) incidents
Based on the data from the years 2005 - 2018 the average number of fires per year is 59. The highest number of fire incidents - 113 took place in 2005, and the least - 28 in 2018. The data has a dropping trend.
When looking into fire subcategories, the most reports belonged to: Outside Fires (56.4%), and Structure Fires (21.1%).
Fire incident types reported to NFIRS in Zip Code 92251


+$7,143
-$7,562
 Nearest zip codes: 92273, 92243, 92281, 92231, 92249, 92259.


 Based on the data from the years 2005 - 2018 the average number of fires per year is 59. The highest number of fire incidents - 113 took place in 2005, and the least - 28 in 2018. The data has a dropping trend.
 When looking into fire subcategories, the most reports belonged to: Outside Fires (56.4%), and Structure Fires (21.1%).