Estimated zip code population in 2022: 1,176 Zip code population in 2010: 2,326 Zip code population in 2000: 2,734
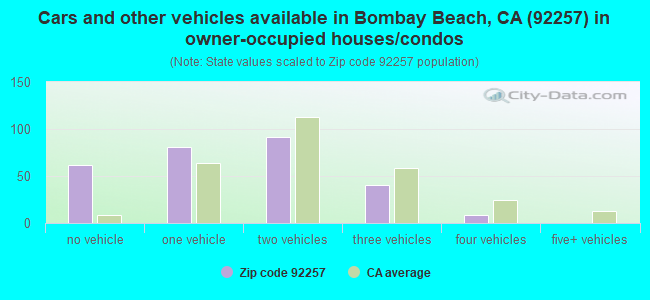
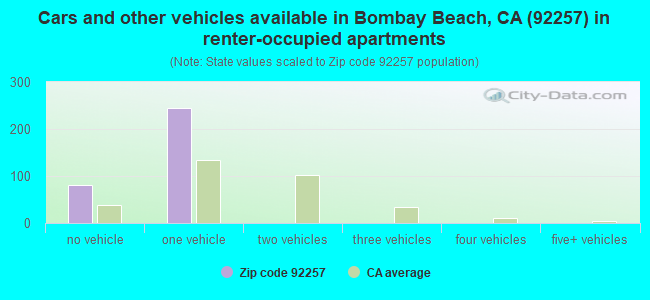
Houses and condos: 1,161 Renter-occupied apartments: 320
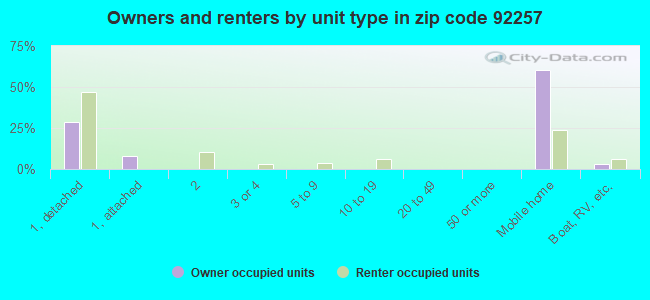
% of renters here:
54%
State:
44%
March 2022 cost of living index in zip code 92257: 94.9 (less than average, U.S. average is 100)
Land area: 743.9 sq. mi. Water area: 76.3 sq. mi.
Population density: 2 people per square mile
(very low).
OSM Map
General Map
Google Map
MSN Map
OSM Map
General Map
Google Map
MSN Map
OSM Map
General Map
Google Map
MSN Map
OSM Map
General Map
Google Map
MSN Map
Please wait while loading the map...
Real estate property taxes paid for housing units in 2022:
This zip code:
2.2% ($1,334)
California:
0.7% ($4,831)
Median real estate property taxes paid for housing units with mortgages in 2022: $1,711 (0.5%) Median real estate property taxes paid for housing units with no mortgage in 2022: $931 (0.4%)
Business Search- 14 Million verified businesses
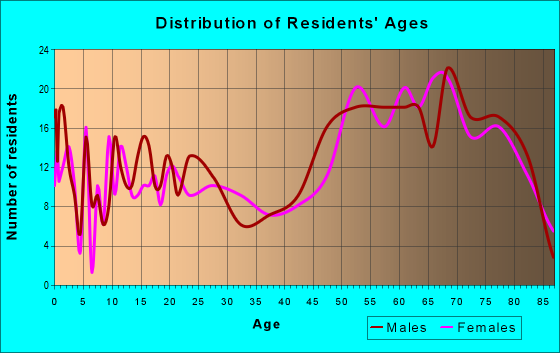
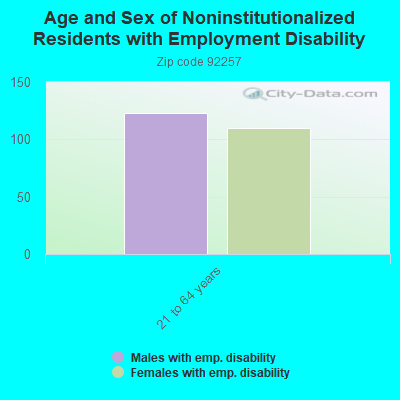
Males: 644
(54.8%)
Females: 531
(45.2%)
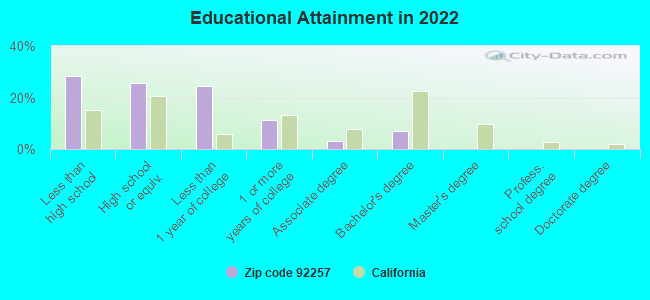
For population 25 years and over in 92257:
High school or higher: 69.5%
Bachelor's degree or higher: 6.8%
Graduate or professional degree: 0.0%
Unemployed: 2.7%
Mean travel time to work (commute): 18.9 minutes
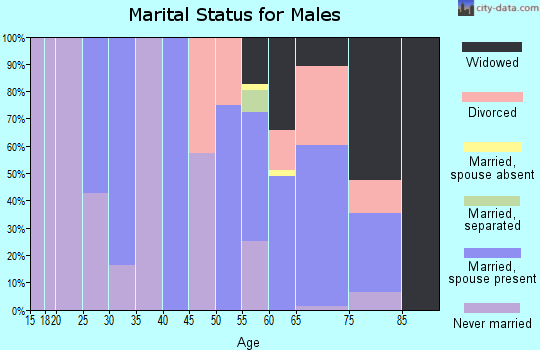
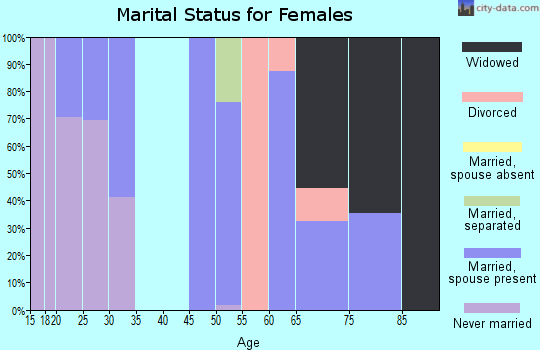
For population 15 years and over in 92257:
Never married: 27.2%
Now married: 26.6%
Separated: 2.6%
Widowed: 12.8%
Divorced: 30.7%
Zip code 92257 compared to state average:
Median household income significantly below state average.
Median house value significantly below state average.
Unemployed percentage below state average.
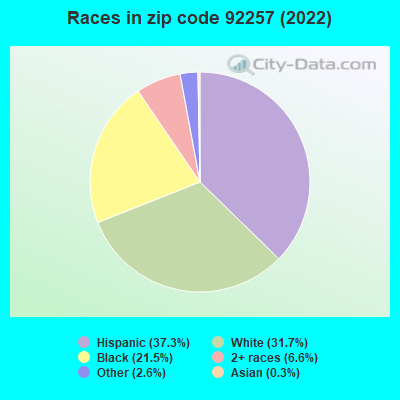
Black race population percentage significantly above state average.
Foreign-born population percentage significantly below state average.
Length of stay since moving in significantly above state average.
Number of rooms per house below state average.
Percentage of population with a bachelor's degree or higher significantly below state average.
Averages for the 2020 tax year for zip code 92257, filed in 2021:
Average Adjusted Gross Income (AGI) in 2020: $34,845 (Individual Income Tax Returns)
Here:
$34,845
State:
$95,910
Salary/wage: $30,730 (reported on 67.3% of returns)
Here:
$30,730
State:
$77,331
(% of AGI for various income ranges: 1019.4% for AGIs below $25k, 3473.0% for AGIs $25k-50k, 7405.0% for AGIs $50k-75k, 10673.3% for AGIs $75k-100k)
Taxable interest for individuals: $425 (reported on 21.8% of returns)
This zip code:
$425
California:
$2,294
(% of AGI for various income ranges: 5.3% for AGIs below $25k, 15.0% for AGIs $25k-50k, 90.0% for AGIs $75k-100k)
Ordinary dividends: $1,775 (reported on 7.3% of returns)
Here:
$1,775
State:
$10,949
(% of AGI for various income ranges: 177.5% for AGIs $50k-75k)
Net capital gain/loss in AGI: +$5,000 (reported on 5.5% of returns)
Here:
+$5,000
State:
+$49,306
(% of AGI for various income ranges: 150.0% for AGIs $25k-50k)
Profit/loss from business: +$2,267 (reported on 10.9% of returns)
Here:
+$2,267
State:
+$15,671
(% of AGI for various income ranges: 72.4% for AGIs below $25k, 13.0% for AGIs $25k-50k)
Taxable individual retirement arrangement distribution: $7,333 (reported on 5.5% of returns)
92257:
$7,333
California:
$23,505
(% of AGI for various income ranges: 129.4% for AGIs below $25k)
Earned income credit: $2,125 (reported on 29.1% of returns)
Here:
$2,125
State:
$2,074
(% of AGI for various income ranges: 129.4% for AGIs below $25k, 120.0% for AGIs $25k-50k)
Percentage of individuals using paid preparers for their 2020 taxes: 89.1%
Here:
89%
State:
92%
(% for various income ranges: 89.3% for AGIs below $25k, 92.9% for AGIs $25k-50k, 85.7% for AGIs $50k-75k, 100.0% for AGIs $75k-100k, 66.7% for AGIs $100k-200k)
Averages for the 2012 tax year for zip code 92257, filed in 2013:
Average Adjusted Gross Income (AGI) in 2012: $30,147 (Individual Income Tax Returns)
Here:
$30,147
State:
$72,726
Salary/wage: $25,527 (reported on 77.4% of returns)
Here:
$25,527
State:
$59,079
(% of AGI for various income ranges: 67.0% for AGIs below $25k, 72.2% for AGIs $25k-50k, 66.8% for AGIs $50k-75k, 55.7% for AGIs $75k-100k)
Taxable interest for individuals: $345 (reported on 20.8% of returns)
This zip code:
$345
California:
$2,146
(% of AGI for various income ranges: 0.6% for AGIs below $25k, 0.3% for AGIs $25k-50k)
Ordinary dividends: $2,433 (reported on 5.7% of returns)
Here:
$2,433
State:
$9,308
Profit/loss from business: +$3,920 (reported on 9.4% of returns)
Here:
+$3,920
State:
+$17,064
Taxable individual retirement arrangement distribution: $4,967 (reported on 5.7% of returns)
92257:
$4,967
California:
$19,557
Total itemized deductions: $16,040 (23% of AGI, reported on 9.4% of returns)
Here:
$16,040
State:
$34,004
Here:
22.7% of AGI
State:
22.7% of AGI
Charity contributions: $1,567 (reported on 5.7% of returns)
Here:
$1,567
State:
$4,659
Taxes paid: $4,700 (reported on 9.4% of returns)
92257:
$4,700
State:
$14,448
Earned income credit: $2,221 (reported on 35.8% of returns)
Here:
$2,221
State:
$2,286
(% of AGI for various income ranges: 9.0% for AGIs below $25k, 2.2% for AGIs $25k-50k)
Percentage of individuals using paid preparers for their 2012 taxes: 60.4%
Here:
60%
State:
64%
(% for various income ranges: 58.6% for AGIs below $25k, 60.0% for AGIs $25k-50k, 60.0% for AGIs $50k-75k, 75.0% for AGIs $75k-100k)
Averages for the 2004 tax year for zip code 92257, filed in 2005:
Average Adjusted Gross Income (AGI) in 2004: $26,766 (Individual Income Tax Returns)
Here:
$26,766
State:
$58,600
Salary/wage: $23,624 (reported on 76.3% of returns)
Here:
$23,624
State:
$49,455
(% of AGI for various income ranges: 79.2% for AGIs below $10k, 68.8% for AGIs $10k-25k, 76.2% for AGIs $25k-50k, 78.2% for AGIs $50k-75k, 127.5% for AGIs $75k-100k)
Taxable interest for individuals: $930 (reported on 30.8% of returns)
This zip code:
$930
California:
$2,365
(% of AGI for various income ranges: 4.4% for AGIs below $10k, 2.1% for AGIs $10k-25k, 0.6% for AGIs $25k-50k, 0.6% for AGIs $50k-75k, 0.2% for AGIs $75k-100k, 0.4% for AGIs over 100k)
Taxable dividends: $1,406 (reported on 10.5% of returns)
Here:
$1,406
State:
$4,746
(% of AGI for various income ranges: 3.5% for AGIs below $10k, 0.4% for AGIs $10k-25k, 0.1% for AGIs $25k-50k, 1.3% for AGIs $50k-75k)
Net capital gain/loss: +$1,203 (reported on 9.7% of returns)
Here:
+$1,203
State:
+$23,418
(% of AGI for various income ranges: -0.8% for AGIs below $10k, -0.7% for AGIs $10k-25k, 0.3% for AGIs $25k-50k, 2.9% for AGIs $50k-75k)
Profit/loss from business: +$3,958 (reported on 7.9% of returns)
Here:
+$3,958
State:
+$16,826
Total itemized deductions: $17,329 (24% of AGI, reported on 12.0% of returns)
Here:
$17,329
State:
$28,113
Here:
24.4% of AGI
State:
25.3% of AGI
(% of AGI for various income ranges: 22.3% for AGIs below $10k, 6.5% for AGIs $25k-50k, 8.4% for AGIs $50k-75k, 15.6% for AGIs $75k-100k, 12.0% for AGIs over 100k)
Charity contributions deductions: $1,847 (3% of AGI, reported on 9.7% of returns)
Here:
$1,847
State:
$3,923
Here:
2.5% of AGI
State:
3.3% of AGI
(% of AGI for various income ranges: 1.9% for AGIs below $10k, 0.6% for AGIs $25k-50k, 1.5% for AGIs $50k-75k, 1.5% for AGIs $75k-100k)
Total tax: $3,965 (reported on 57.2% of returns)
92257:
$3,965
State:
$10,761
(% of AGI for various income ranges: 1.8% for AGIs below $10k, 3.2% for AGIs $10k-25k, 5.5% for AGIs $25k-50k, 9.1% for AGIs $50k-75k, 11.5% for AGIs $75k-100k, 22.4% for AGIs over 100k)
Earned income credit: $1,844 (reported on 32.8% of returns)
Here:
$1,844
State:
$1,763
Percentage of individuals using paid preparers for their 2004 taxes: 72.2%
Here:
72%
State:
66%
(% for various income ranges: 65.9% for AGIs below $10k, 74.4% for AGIs $10k-25k, 73.0% for AGIs $25k-50k, 98.0% for AGIs $50k-75k, 91.7% for AGIs over 100k)
Household received Food Stamps/SNAP in the past 12 months: 337 Household did not receive Food Stamps/SNAP in the past 12 months: 315
Women who did not have a birth in the past 12 months: 120 (69 now married, 50 unmarried)
Housing units in zip code 92257 with a mortgage: 78 Median monthly owner costs for units with a mortgage: $1,795 Median monthly owner costs for units without a mortgage: $327
Residents with income below the poverty level in 2022:
This zip code:
52.7%
Whole state:
12.2%
Residents with income below 50% of the poverty level in 2022:
This zip code:
14.5%
Whole state:
6.2%
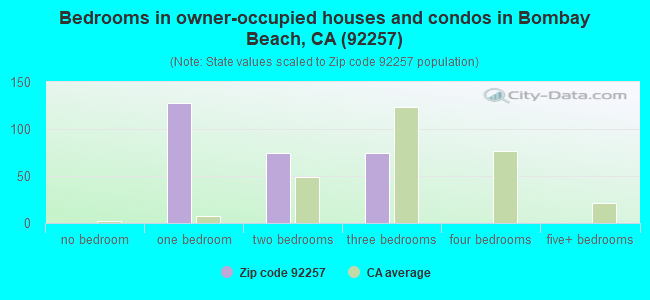
Median number of rooms in houses and condos:
Here:
4.2
State:
6.0
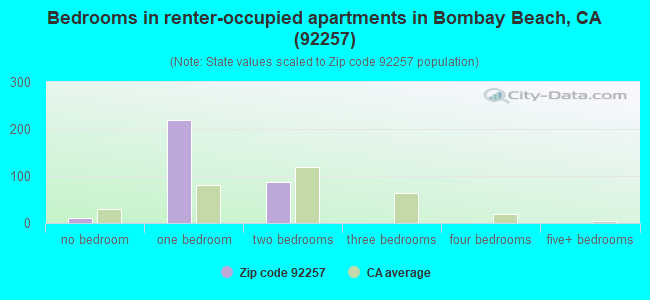
Median number of rooms in apartments:
Here:
3.2
State:
3.9
Notable locations in this zip code not listed on our city pages
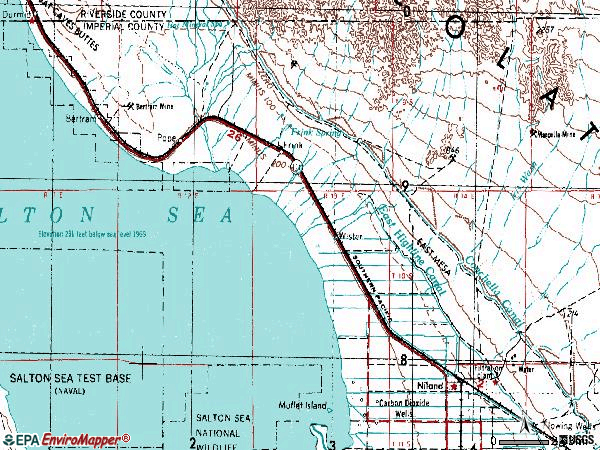
Notable locations in zip code 92257: Pacific Aquafarms (A), Niland Marina (B), Bombay Beach Campground (C), Tropical Fish Farm (D), Camp Dunlap (E), Vista Mine (F), Niland Fire District Station 1 Headquarters (G), Niland Branch Imperial County Free Library (H), Niland Fire District Station 2 (I). Display/hide their locations on the map
In group quarters: 27 (-1 institutionalized population)
Size of family households: 104 2-persons, 41 3-persons, 32 4-persons, 18 6-persons
Size of nonfamily households: 398 1-person, 8 2-persons
134 married couples with children.
145 single-parent households (145 women).
77.1% of residents of 92257 zip code speak English at home.
22.5% of residents speak Spanish at home (28% very well, 27% well, 33% not well, 12% not at all).
0.9% of residents speak other Indo-European language at home (100% well).
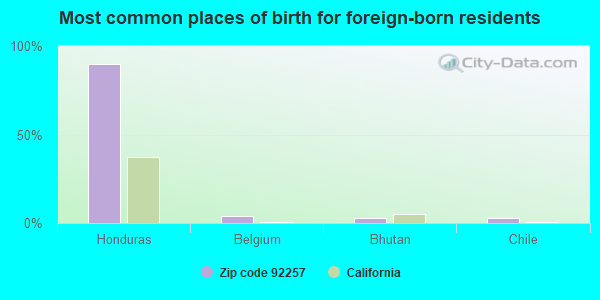
Foreign born population: 135 (11.5%) (70.0% of them are naturalized citizens)
This zip code:
11.5%
Whole state:
26.7%
90%Honduras
4%Belgium
3%Bhutan
3%Chile
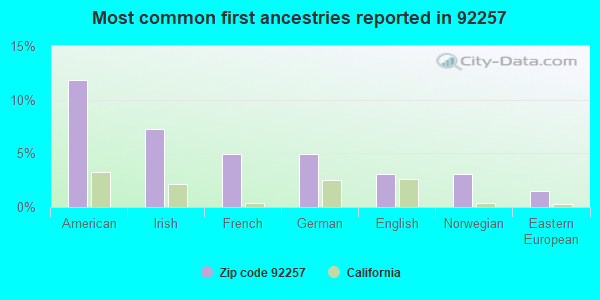
12%American
7%Irish
5%French
5%German
3%English
3%Norwegian
2%Eastern European
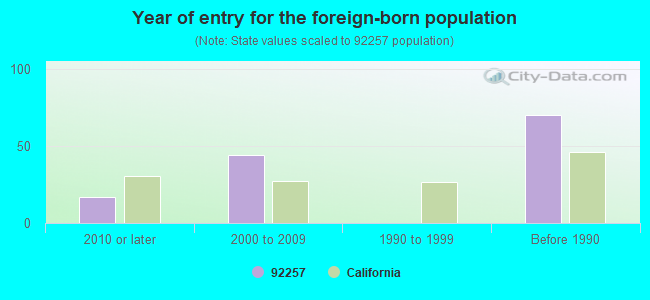
Year of entry for the foreign-born population
172010 or later
442000 to 2009
01990 to 1999
70Before 1990
Facilities with environmental interests located in this zip code:
HOT SPA SOLID WASTE SITE (EAST OF HOT SPA ROAD in BOMBAY BEACH, CA)
STATE MASTER (California Solid Waste disposal sites tracking) - REFUSE DISPOSAL REFUSE DISPOSAL (Solid waste facilities tracking) Organizations: COUNTY OF IMPERIAL PUBLIC WORKS (CONTACT/OPERATOR)
IMPERIAL WILDLIFE AREA (8700 DAVIS RD in NILAND, CA)
STATE MASTER (California - Hazardous Waste Tracking) - HAZARDOU WASTE PROGRAM Small Quantity Generators, between 100 kg and 1000 kg of hazardous waste/month (Resource Conservation and Recovery Act (tracking hazardous waste)) - notification Organizations: STATE FISH AND GAME (CONTACT/OWNER)
NILAND SOLID WASTE SITE (CUFF ROAD; 4 MILES NORTHEAST OF NILAND in NILAND, CA)
STATE MASTER (California Solid Waste disposal sites tracking) - REFUSE DISPOSAL REFUSE DISPOSAL (Solid waste facilities tracking) Organizations: COUNTY OF IMPERIAL PUBLIC WORKS (CONTACT/OPERATOR)
NILAND SD WWTP (125 WEST ALCOTT ROAD in NILAND, CA)
National Pollutant Discharge Elimination System NON-MAJOR (Tracking pollutant discharge elimination systems) - permit Business SIC classification: SEWERAGE SYSTEMS Organizations: NILAND SANITARY DISTRICT (CONTACT/OWNER)
Alternative names: NILAND S D, NILAND SANITARY DISTRICT, NILAND SANITATION DISTRICT
GRANITE CONSTRUCTION COMPANY (EAST FRINK ROAD in NILAND, CA)
CRITERIA AND HAZARDOUS AIR POLLUTANT INVENTORY (Inventory of air pollution sources) Business SIC classification: CONSTRUCTION SAND AND GRAVEL
HOT SPA CUT AND FILL SITE LANDFILL (EAST OF HOT SPA ROAD in NILAND, CA)
CRITERIA AND HAZARDOUS AIR POLLUTANT INVENTORY (Inventory of air pollution sources) Business SIC classification: REFUSE SYSTEMS Business NAICS classification: SOLID WASTE LANDFILL.
NILAND CUT AND FILL SITE (COFF RD.; 4 MI NE NILAND in NILAND, CA)
CRITERIA AND HAZARDOUS AIR POLLUTANT INVENTORY (Inventory of air pollution sources) Business SIC classification: REFUSE SYSTEMS Business NAICS classification: SOLID WASTE LANDFILL.
NILAND MARINA SITE (1.9 MI FROM STATE HWY 11 in NILAND, CA)
CRITERIA AND HAZARDOUS AIR POLLUTANT INVENTORY (Inventory of air pollution sources) Business SIC classification: REFUSE SYSTEMS Business NAICS classification: SOLID WASTE LANDFILL.
Housing units lacking complete plumbing facilities: 5.5% Housing units lacking complete kitchen facilities: 5.2%
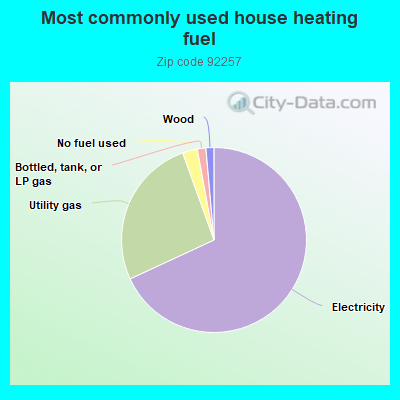
68.3%Electricity
26.5%Utility gas
2.6%No fuel used
1.5%Bottled, tank, or LP gas
1.4%Wood
Population in 1990: 875. Population change in the 1990s: +1,859 (+212.5%).
Place of birth for U.S.-born residents:
This state: 798
Midwest: 67
South: 53
West: 115
58% of the 92257 zip code residents lived in the same house 5 years ago. Out of people who lived in different houses, 33% lived in this county. Out of people who lived in different counties, 50% lived in California.
93% of the 92257 zip code residents lived in the same house 1 year ago. Out of people who lived in different houses, 82% moved from this county. Out of people who lived in different houses, 9% moved from different county within same state. Out of people who lived in different houses, 5% moved from different state.
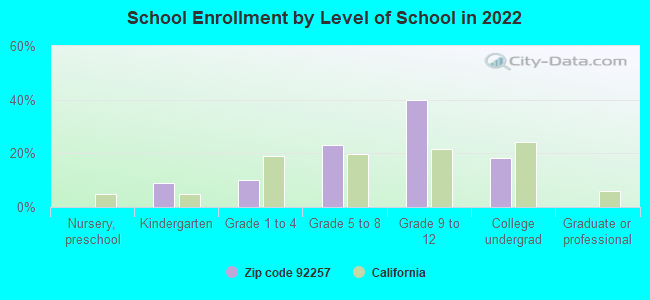
Private vs. public school enrollment:
Students in private schools in grades 1 to 8 (elementary and middle school): 35
Here:
41.3%
California:
10.5%
Students in private schools in grades 9 to 12 (high school):
Here:
0.0%
California:
8.5%
Students in private undergraduate colleges: 42
Here:
88.5%
California:
15.9%
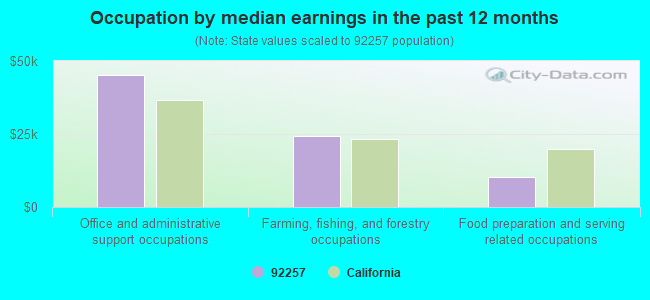
Occupation by median earnings in the past 12 months ($)
45,355Office and administrative support occupations
24,211Farming, fishing, and forestry occupations
10,369Food preparation and serving related occupations
Top industries in this zip code by the number of employees in 2005:
Accommodation and Food Services: Full-Service Restaurants (5-9: 2, 1-4: 2)
Accommodation and Food Services: RV (Recreational Vehicle) Parks and Campgrounds (5-9: 1, 1-4: 1)
Health Care and Social Assistance: All Other Outpatient Care Centers (5-9: 1)
Wholesale Trade: Other Miscellaneous Nondurable Goods Merchant Wholesalers (5-9: 1)
Other Services (except Public Administration): Other Similar Organizations (except Business, Professional, Labor, and Political Organizations) (1-4: 1)
Real Estate and Rental and Leasing: Lessors of Miniwarehouses and Self-Storage Units (1-4: 1)
Construction: Other Heavy and Civil Engineering Construction (1-4: 1)
People in group quarters in 2000:
22 people in other workers' dormitories
Fatal accident statistics in 2014:
Fatal accident count: 1
Vehicles involved in fatal accidents: 1
Fatal accidents caused by drunken drivers: 0
Fatalities: 2
Persons involved in fatal accidents: 4
Pedestrians involved in fatal accidents: 0
Fatal accident statistics in 2013:
Fatal accident count: 1
Vehicles involved in fatal accidents: 1
Fatal accidents caused by drunken drivers: 0
Fatalities: 1
Persons involved in fatal accidents: 1
Pedestrians involved in fatal accidents: 1
Home Mortgage Disclosure Act Aggregated Statistics For Year 2009 (Based on 2 partial tracts)
A) FHA, FSA/RHS & VA Home Purchase Loans
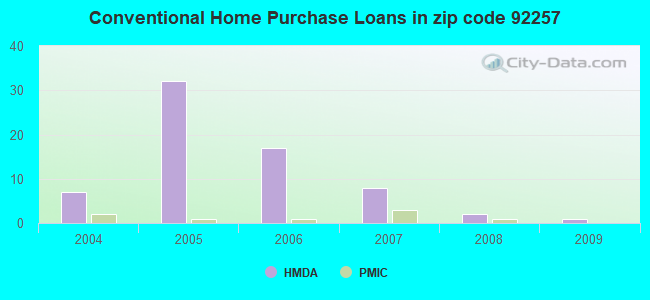
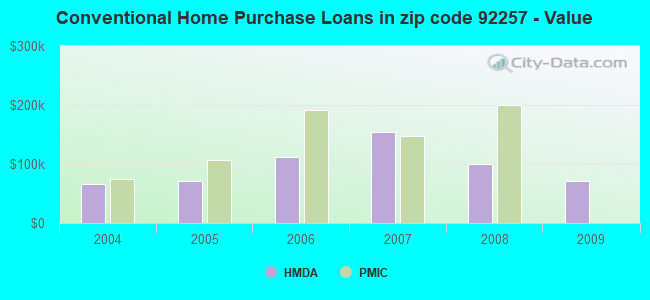
B) Conventional Home Purchase Loans
C) Refinancings
D) Home Improvement Loans
F) Non-occupant Loans on < 5 Family Dwellings (A B C & D)
G) Loans On Manufactured Home Dwelling (A B C & D)
Number
Average Value
Number
Average Value
Number
Average Value
Number
Average Value
Number
Average Value
Number
Average Value
LOANS ORIGINATED
2
$113,890
1
$71,260
3
$139,757
1
$71,260
1
$84,380
0
$0
APPLICATIONS APPROVED, NOT ACCEPTED
0
$0
0
$0
1
$76,510
0
$0
0
$0
0
$0
APPLICATIONS DENIED
1
$70,390
1
$118,920
5
$135,706
2
$52,900
0
$0
1
$41,100
APPLICATIONS WITHDRAWN
1
$128,100
0
$0
4
$144,712
0
$0
0
$0
0
$0
FILES CLOSED FOR INCOMPLETENESS
0
$0
0
$0
0
$0
0
$0
0
$0
0
$0
Aggregated Statistics For Year 2008 (Based on 2 partial tracts)
A) FHA, FSA/RHS & VA Home Purchase Loans
B) Conventional Home Purchase Loans
C) Refinancings
D) Home Improvement Loans
F) Non-occupant Loans on < 5 Family Dwellings (A B C & D)
G) Loans On Manufactured Home Dwelling (A B C & D)
Number
Average Value
Number
Average Value
Number
Average Value
Number
Average Value
Number
Average Value
Number
Average Value
LOANS ORIGINATED
2
$121,980
2
$100,555
5
$129,936
1
$80,010
0
$0
0
$0
APPLICATIONS APPROVED, NOT ACCEPTED
1
$116,730
1
$115,420
3
$95,457
0
$0
0
$0
1
$79,570
APPLICATIONS DENIED
2
$141,215
0
$0
23
$133,631
5
$69,864
1
$131,160
0
$0
APPLICATIONS WITHDRAWN
0
$0
0
$0
6
$121,032
3
$81,903
1
$158,270
0
$0
FILES CLOSED FOR INCOMPLETENESS
0
$0
0
$0
1
$80,880
0
$0
0
$0
0
$0
Aggregated Statistics For Year 2007 (Based on 2 partial tracts)
A) FHA, FSA/RHS & VA Home Purchase Loans
B) Conventional Home Purchase Loans
C) Refinancings
D) Home Improvement Loans
E) Loans on Dwellings For 5+ Families
F) Non-occupant Loans on < 5 Family Dwellings (A B C & D)
G) Loans On Manufactured Home Dwelling (A B C & D)
Number
Average Value
Number
Average Value
Number
Average Value
Number
Average Value
Number
Average Value
Number
Average Value
Number
Average Value
LOANS ORIGINATED
1
$173,130
8
$154,495
23
$135,076
3
$115,857
0
$0
3
$131,597
1
$170,950
APPLICATIONS APPROVED, NOT ACCEPTED
0
$0
4
$119,792
7
$151,334
0
$0
0
$0
1
$118,920
0
$0
APPLICATIONS DENIED
0
$0
7
$173,631
25
$138,855
4
$70,608
0
$0
2
$105,145
0
$0
APPLICATIONS WITHDRAWN
0
$0
3
$149,523
15
$150,951
2
$117,825
1
$417,960
1
$143,840
0
$0
FILES CLOSED FOR INCOMPLETENESS
0
$0
0
$0
2
$184,500
0
$0
0
$0
0
$0
0
$0
Aggregated Statistics For Year 2006 (Based on 2 partial tracts)
A) FHA, FSA/RHS & VA Home Purchase Loans
B) Conventional Home Purchase Loans
C) Refinancings
D) Home Improvement Loans
F) Non-occupant Loans on < 5 Family Dwellings (A B C & D)
G) Loans On Manufactured Home Dwelling (A B C & D)
Number
Average Value
Number
Average Value
Number
Average Value
Number
Average Value
Number
Average Value
Number
Average Value
LOANS ORIGINATED
0
$0
17
$111,563
38
$122,842
8
$90,555
8
$120,230
0
$0
APPLICATIONS APPROVED, NOT ACCEPTED
0
$0
7
$115,859
6
$153,530
1
$39,790
1
$229,530
0
$0
APPLICATIONS DENIED
0
$0
14
$121,448
24
$144,768
7
$62,644
2
$207,015
0
$0
APPLICATIONS WITHDRAWN
1
$124,600
16
$119,792
15
$138,359
2
$98,370
4
$108,208
3
$50,717
FILES CLOSED FOR INCOMPLETENESS
0
$0
0
$0
5
$128,974
0
$0
0
$0
0
$0
Aggregated Statistics For Year 2005 (Based on 2 partial tracts)
A) FHA, FSA/RHS & VA Home Purchase Loans
B) Conventional Home Purchase Loans
C) Refinancings
D) Home Improvement Loans
F) Non-occupant Loans on < 5 Family Dwellings (A B C & D)
G) Loans On Manufactured Home Dwelling (A B C & D)
Number
Average Value
Number
Average Value
Number
Average Value
Number
Average Value
Number
Average Value
Number
Average Value
LOANS ORIGINATED
3
$177,213
32
$70,594
36
$112,348
7
$59,521
10
$115,596
2
$72,140
APPLICATIONS APPROVED, NOT ACCEPTED
0
$0
3
$99,680
7
$89,439
1
$21,860
0
$0
1
$141,650
APPLICATIONS DENIED
0
$0
11
$98,449
28
$115,718
7
$62,394
1
$243,520
0
$0
APPLICATIONS WITHDRAWN
0
$0
3
$94,290
20
$123,246
1
$212,040
2
$88,095
0
$0
FILES CLOSED FOR INCOMPLETENESS
0
$0
2
$62,740
7
$114,796
0
$0
1
$122,420
0
$0
Aggregated Statistics For Year 2004 (Based on 2 partial tracts)
A) FHA, FSA/RHS & VA Home Purchase Loans
B) Conventional Home Purchase Loans
C) Refinancings
D) Home Improvement Loans
F) Non-occupant Loans on < 5 Family Dwellings (A B C & D)
G) Loans On Manufactured Home Dwelling (A B C & D)
Detailed PMIC statistics for the following Tracts:0101.00
2005 - 2018 National Fire Incident Reporting System (NFIRS) incidents
Based on the data from the years 2005 - 2018 the average number of fires per year is 36. The highest number of fire incidents - 86 took place in 2015, and the least - 2 in 2008. The data has a growing trend.
When looking into fire subcategories, the most reports belonged to: Outside Fires (55.0%), and Structure Fires (29.4%).
Fire incident types reported to NFIRS in Zip Code 92257


 Nearest zip codes: 92233, 92227, 92266, 92281, 92239, 92250.
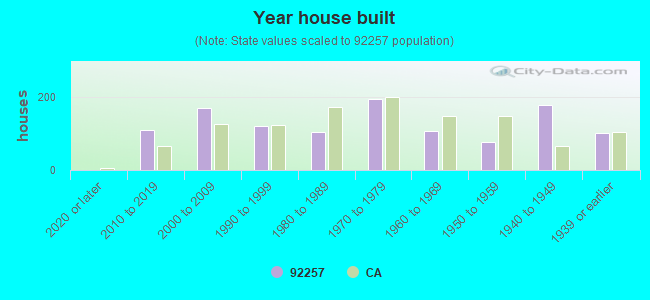


 Based on the data from the years 2005 - 2018 the average number of fires per year is 36. The highest number of fire incidents - 86 took place in 2015, and the least - 2 in 2008. The data has a growing trend.
 When looking into fire subcategories, the most reports belonged to: Outside Fires (55.0%), and Structure Fires (29.4%).