Estimated zip code population in 2022: 51,138 Zip code population in 2010: 44,734 Zip code population in 2000: 39,254
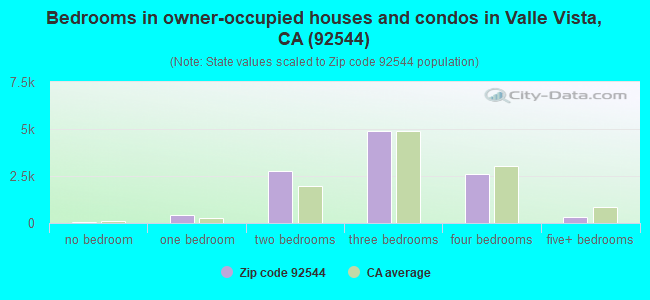
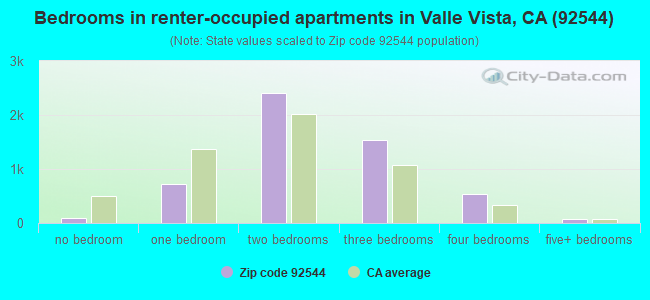
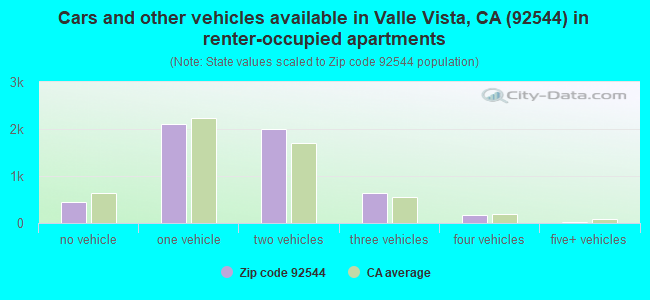
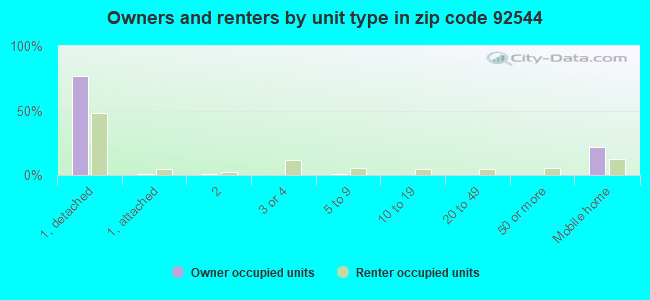
Houses and condos: 17,842 Renter-occupied apartments: 5,391
% of renters here:
33%
State:
44%
March 2022 cost of living index in zip code 92544: 81.6 (low, U.S. average is 100)
Land area: 135.7 sq. mi. Water area: 0.2 sq. mi.
Population density: 377 people per square mile
(very low).
OSM Map
General Map
Google Map
MSN Map
OSM Map
General Map
Google Map
MSN Map
OSM Map
General Map
Google Map
MSN Map
OSM Map
General Map
Google Map
MSN Map
Please wait while loading the map...
Real estate property taxes paid for housing units in 2022:
This zip code:
0.7% ($2,254)
California:
0.7% ($4,831)
Median real estate property taxes paid for housing units with mortgages in 2022: $2,539 (0.7%) Median real estate property taxes paid for housing units with no mortgage in 2022: $1,729 (0.6%)
Averages for the 2020 tax year for zip code 92544, filed in 2021:
Average Adjusted Gross Income (AGI) in 2020: $50,446 (Individual Income Tax Returns)
Here:
$50,446
State:
$95,910
Salary/wage: $43,984 (reported on 80.8% of returns)
Here:
$43,984
State:
$77,331
(% of AGI for various income ranges: 1116.0% for AGIs below $25k, 3672.0% for AGIs $25k-50k, 6909.2% for AGIs $50k-75k, 10182.5% for AGIs $75k-100k, 18660.9% for AGIs $100k-200k, 82890.0% for AGIs over 200k)
Taxable interest for individuals: $812 (reported on 25.7% of returns)
This zip code:
$812
California:
$2,294
(% of AGI for various income ranges: 8.6% for AGIs below $25k, 7.2% for AGIs $25k-50k, 21.4% for AGIs $50k-75k, 35.8% for AGIs $75k-100k, 75.6% for AGIs $100k-200k, 2468.8% for AGIs over 200k)
Ordinary dividends: $4,268 (reported on 6.9% of returns)
Here:
$4,268
State:
$10,949
(% of AGI for various income ranges: 8.3% for AGIs below $25k, 11.0% for AGIs $25k-50k, 25.7% for AGIs $50k-75k, 44.8% for AGIs $75k-100k, 130.5% for AGIs $100k-200k, 3575.0% for AGIs over 200k)
Net capital gain/loss in AGI: +$14,971 (reported on 7.6% of returns)
Here:
+$14,971
State:
+$49,306
(% of AGI for various income ranges: 2.6% for AGIs below $25k, 12.1% for AGIs $25k-50k, 32.9% for AGIs $50k-75k, 82.3% for AGIs $75k-100k, 482.7% for AGIs $100k-200k, 21326.2% for AGIs over 200k)
Profit/loss from business: +$9,667 (reported on 16.1% of returns)
Here:
+$9,667
State:
+$15,671
(% of AGI for various income ranges: 153.6% for AGIs below $25k, 131.8% for AGIs $25k-50k, 211.4% for AGIs $50k-75k, 206.6% for AGIs $75k-100k, 383.7% for AGIs $100k-200k, 8848.8% for AGIs over 200k)
Taxable individual retirement arrangement distribution: $15,076 (reported on 4.6% of returns)
92544:
$15,076
California:
$23,505
(% of AGI for various income ranges: 30.4% for AGIs below $25k, 42.8% for AGIs $25k-50k, 98.6% for AGIs $50k-75k, 169.9% for AGIs $75k-100k, 465.4% for AGIs $100k-200k, 3011.2% for AGIs over 200k)
Self-employed (Keogh) retirement plans: $15,800 (reported on 0.1% of returns)
92544:
$15,800
California:
$30,163
(% of AGI for various income ranges: 6.5% for AGIs $25k-50k)
Total itemized deductions: $33,312 (reported on 8.6% of returns)
Here:
$33,312
State:
$39,517
(% of AGI for various income ranges: 36.4% for AGIs below $25k, 142.1% for AGIs $25k-50k, 508.6% for AGIs $50k-75k, 809.8% for AGIs $75k-100k, 1670.4% for AGIs $100k-200k, 19381.2% for AGIs over 200k)
Charity contributions: $7,589 (reported on 6.9% of returns)
Here:
$7,589
State:
$12,598
(% of AGI for various income ranges: 3.5% for AGIs below $25k, 18.9% for AGIs $25k-50k, 76.2% for AGIs $50k-75k, 129.6% for AGIs $75k-100k, 338.5% for AGIs $100k-200k, 4502.5% for AGIs over 200k)
Taxes paid: $7,227 (reported on 8.6% of returns)
92544:
$7,227
State:
$8,807
(% of AGI for various income ranges: 5.7% for AGIs below $25k, 29.6% for AGIs $25k-50k, 118.8% for AGIs $50k-75k, 224.1% for AGIs $75k-100k, 476.1% for AGIs $100k-200k, 2156.2% for AGIs over 200k)
Earned income credit: $2,344 (reported on 24.5% of returns)
Here:
$2,344
State:
$2,074
(% of AGI for various income ranges: 126.9% for AGIs below $25k, 97.4% for AGIs $25k-50k, 2.0% for AGIs $50k-75k)
Percentage of individuals using paid preparers for their 2020 taxes: 94.0%
Here:
94%
State:
92%
(% for various income ranges: 93.0% for AGIs below $25k, 94.6% for AGIs $25k-50k, 94.7% for AGIs $50k-75k, 94.1% for AGIs $75k-100k, 95.2% for AGIs $100k-200k, 94.6% for AGIs over 200k)
Averages for the 2012 tax year for zip code 92544, filed in 2013:
Average Adjusted Gross Income (AGI) in 2012: $44,427 (Individual Income Tax Returns)
Here:
$44,427
State:
$72,726
Salary/wage: $38,450 (reported on 79.3% of returns)
Here:
$38,450
State:
$59,079
(% of AGI for various income ranges: 69.6% for AGIs below $25k, 75.7% for AGIs $25k-50k, 74.8% for AGIs $50k-75k, 74.1% for AGIs $75k-100k, 70.1% for AGIs $100k-200k, 39.5% for AGIs over 200k)
Taxable interest for individuals: $1,276 (reported on 30.7% of returns)
This zip code:
$1,276
California:
$2,146
(% of AGI for various income ranges: 1.0% for AGIs below $25k, 0.6% for AGIs $25k-50k, 0.7% for AGIs $50k-75k, 0.7% for AGIs $75k-100k, 0.9% for AGIs $100k-200k, 1.7% for AGIs over 200k)
Ordinary dividends: $3,847 (reported on 11.0% of returns)
Here:
$3,847
State:
$9,308
(% of AGI for various income ranges: 1.0% for AGIs below $25k, 0.6% for AGIs $25k-50k, 0.8% for AGIs $50k-75k, 0.7% for AGIs $75k-100k, 1.1% for AGIs $100k-200k, 1.8% for AGIs over 200k)
Net capital gain/loss in AGI: +$5,229 (reported on 9.9% of returns)
Here:
+$5,229
State:
+$30,460
(% of AGI for various income ranges: 0.2% for AGIs $25k-50k, 0.3% for AGIs $50k-75k, 0.7% for AGIs $75k-100k, 0.8% for AGIs $100k-200k, 6.4% for AGIs over 200k)
Profit/loss from business: +$11,119 (reported on 16.5% of returns)
Here:
+$11,119
State:
+$17,064
(% of AGI for various income ranges: 10.5% for AGIs below $25k, 4.2% for AGIs $25k-50k, 2.3% for AGIs $50k-75k, 2.1% for AGIs $75k-100k, 2.7% for AGIs $100k-200k, 4.5% for AGIs over 200k)
Taxable individual retirement arrangement distribution: $14,810 (reported on 8.0% of returns)
92544:
$14,810
California:
$19,557
(% of AGI for various income ranges: 2.6% for AGIs below $25k, 2.3% for AGIs $25k-50k, 2.3% for AGIs $50k-75k, 2.9% for AGIs $75k-100k, 2.7% for AGIs $100k-200k, 3.5% for AGIs over 200k)
Self-employment retirement plans: $27,240 (reported on 0.3% of returns)
92544:
$27,240
California:
$24,530
Total itemized deductions: $22,910 (27% of AGI, reported on 30.3% of returns)
Here:
$22,910
State:
$34,004
Here:
26.8% of AGI
State:
22.7% of AGI
(% of AGI for various income ranges: 9.2% for AGIs below $25k, 13.2% for AGIs $25k-50k, 16.7% for AGIs $50k-75k, 17.8% for AGIs $75k-100k, 18.8% for AGIs $100k-200k, 16.8% for AGIs over 200k)
Charity contributions: $3,458 (reported on 24.3% of returns)
Here:
$3,458
State:
$4,659
(% of AGI for various income ranges: 0.6% for AGIs below $25k, 1.3% for AGIs $25k-50k, 2.2% for AGIs $50k-75k, 2.0% for AGIs $75k-100k, 2.6% for AGIs $100k-200k, 2.4% for AGIs over 200k)
Taxes paid: $6,691 (reported on 30.2% of returns)
92544:
$6,691
State:
$14,448
(% of AGI for various income ranges: 1.6% for AGIs below $25k, 2.4% for AGIs $25k-50k, 3.8% for AGIs $50k-75k, 4.7% for AGIs $75k-100k, 6.2% for AGIs $100k-200k, 9.1% for AGIs over 200k)
Earned income credit: $2,534 (reported on 28.5% of returns)
Here:
$2,534
State:
$2,286
(% of AGI for various income ranges: 9.4% for AGIs below $25k, 1.8% for AGIs $25k-50k)
Percentage of individuals using paid preparers for their 2012 taxes: 63.4%
Here:
63%
State:
64%
(% for various income ranges: 59.4% for AGIs below $25k, 63.6% for AGIs $25k-50k, 67.8% for AGIs $50k-75k, 68.9% for AGIs $75k-100k, 69.9% for AGIs $100k-200k, 84.0% for AGIs over 200k)
Averages for the 2004 tax year for zip code 92544, filed in 2005:
Average Adjusted Gross Income (AGI) in 2004: $44,327 (Individual Income Tax Returns)
Here:
$44,327
State:
$58,600
Salary/wage: $38,654 (reported on 79.9% of returns)
Here:
$38,654
State:
$49,455
(% of AGI for various income ranges: 117.6% for AGIs below $10k, 70.6% for AGIs $10k-25k, 77.9% for AGIs $25k-50k, 79.3% for AGIs $50k-75k, 81.1% for AGIs $75k-100k, 51.9% for AGIs over 100k)
Taxable interest for individuals: $1,729 (reported on 42.7% of returns)
This zip code:
$1,729
California:
$2,365
(% of AGI for various income ranges: 7.8% for AGIs below $10k, 2.7% for AGIs $10k-25k, 1.4% for AGIs $25k-50k, 1.2% for AGIs $50k-75k, 0.8% for AGIs $75k-100k, 1.9% for AGIs over 100k)
Taxable dividends: $2,679 (reported on 17.0% of returns)
Here:
$2,679
State:
$4,746
(% of AGI for various income ranges: 5.4% for AGIs below $10k, 1.2% for AGIs $10k-25k, 0.8% for AGIs $25k-50k, 0.9% for AGIs $50k-75k, 0.6% for AGIs $75k-100k, 1.2% for AGIs over 100k)
Net capital gain/loss: +$17,606 (reported on 15.0% of returns)
Here:
+$17,606
State:
+$23,418
(% of AGI for various income ranges: -0.9% for AGIs below $10k, 0.0% for AGIs $10k-25k, 0.8% for AGIs $25k-50k, 1.3% for AGIs $50k-75k, 1.8% for AGIs $75k-100k, 15.7% for AGIs over 100k)
Profit/loss from business: +$15,832 (reported on 16.3% of returns)
Here:
+$15,832
State:
+$16,826
(% of AGI for various income ranges: 4.8% for AGIs below $10k, 6.5% for AGIs $10k-25k, 4.2% for AGIs $25k-50k, 3.2% for AGIs $50k-75k, 3.9% for AGIs $75k-100k, 9.0% for AGIs over 100k)
IRA payment deduction: $3,218 (reported on 2.3% of returns)
92544:
$3,218
California:
$3,192
(% of AGI for various income ranges: 0.4% for AGIs below $10k, 0.2% for AGIs $10k-25k, 0.2% for AGIs $25k-50k, 0.2% for AGIs $50k-75k, 0.2% for AGIs $75k-100k, 0.1% for AGIs over 100k)
Self-employed pension: $21,000 (reported on 0.8% of returns)
Here:
$21,000
California:
$17,688
(% of AGI for various income ranges: 0.3% for AGIs below $10k, 0.1% for AGIs $25k-50k, 0.1% for AGIs $50k-75k, 0.2% for AGIs $75k-100k, 0.9% for AGIs over 100k)
Total itemized deductions: $21,516 (27% of AGI, reported on 38.9% of returns)
Here:
$21,516
State:
$28,113
Here:
27.5% of AGI
State:
25.3% of AGI
(% of AGI for various income ranges: 22.9% for AGIs below $10k, 11.9% for AGIs $10k-25k, 19.5% for AGIs $25k-50k, 22.5% for AGIs $50k-75k, 23.0% for AGIs $75k-100k, 16.6% for AGIs over 100k)
Charity contributions deductions: $3,199 (4% of AGI, reported on 33.4% of returns)
Here:
$3,199
State:
$3,923
Here:
3.9% of AGI
State:
3.3% of AGI
(% of AGI for various income ranges: 0.9% for AGIs below $10k, 1.2% for AGIs $10k-25k, 1.9% for AGIs $25k-50k, 2.5% for AGIs $50k-75k, 2.8% for AGIs $75k-100k, 2.9% for AGIs over 100k)
Total tax: $6,469 (reported on 71.0% of returns)
92544:
$6,469
State:
$10,761
(% of AGI for various income ranges: 4.6% for AGIs below $10k, 3.8% for AGIs $10k-25k, 5.6% for AGIs $25k-50k, 7.3% for AGIs $50k-75k, 8.9% for AGIs $75k-100k, 17.9% for AGIs over 100k)
Earned income credit: $1,852 (reported on 18.4% of returns)
Here:
$1,852
State:
$1,763
Percentage of individuals using paid preparers for their 2004 taxes: 67.7%
Here:
68%
State:
66%
(% for various income ranges: 59.2% for AGIs below $10k, 66.0% for AGIs $10k-25k, 69.0% for AGIs $25k-50k, 71.2% for AGIs $50k-75k, 72.0% for AGIs $75k-100k, 79.7% for AGIs over 100k)
Likely homosexual households (counted as self-reported same-sex unmarried-partner households)
Lesbian couples: 0.0% of all households
Gay men: 0.1% of all households
Household received Food Stamps/SNAP in the past 12 months: 3,354 Household did not receive Food Stamps/SNAP in the past 12 months: 13,391
Women who had a birth in the past 12 months: 810 (575 now married, 234 unmarried) Women who did not have a birth in the past 12 months: 10,953 (4,525 now married, 6,420 unmarried)
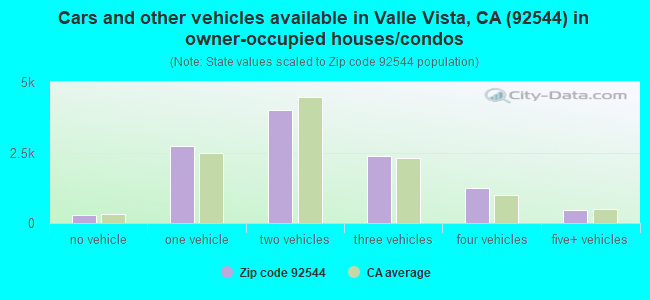
Housing units in zip code 92544 with a mortgage: 6,916 (439 second mortgage, 8 home equity loan, 230 both second mortgage and home equity loan) Houses without a mortgage: 113
Median monthly owner costs for units with a mortgage: $1,852 Median monthly owner costs for units without a mortgage: $577
Residents with income below the poverty level in 2022:
This zip code:
17.3%
Whole state:
12.2%
Residents with income below 50% of the poverty level in 2022:
This zip code:
9.6%
Whole state:
6.2%
Median number of rooms in houses and condos:
Here:
5.9
State:
6.0
Median number of rooms in apartments:
Here:
4.7
State:
3.9
Notable locations in this zip code not listed on our city pages
Notable locations in zip code 92544: Bautista Guard Station (A), Little Lake Campground (B), Hemet Polo Club (C), Mission Ranch (D), Cranston Forest Service Station (E), Red Mountain Lookout (F), American Medical Response - Little Lake (G), Valle Vista Branch Riverside City and County Public Library (H), Ramona Bowl Museum (I), Hemet Fire Department Station 5 (J), Riverside County Fire Department Station 28 Sage (K), Riverside County Fire Department Station 26 - Little Lake (L), Riverside County Fire Department Station 72 Valle Vista (M). Display/hide their locations on the map
Shopping Centers: Ramona Plaza Shopping Center (1), Hemet East Shopping Center (2), Hemet Plaza Shopping Center (3). Display/hide their locations on the map
Churches in zip code 92544 include: The Church of Jesus Christ of Latter Day Saints (A), Community Christian Church (B), Dwelling Place Family Church (C), First Baptist Church (D), First Church of Religious Science (E), Fountain of Life Church of God (F), Maranatha Fellowship Church (G), Seventh Day Adventist Church (H), Saint Johns Lutheran Church (I). Display/hide their locations on the map
Rivers and creeks: North Fork San Jacinto River (A), Horse Creek (B), South Fork San Jacinto River (C), Baisley Creek (D). Display/hide their locations on the map
7,380 married couples with children.
4,000 single-parent households (675 men, 3,325 women).
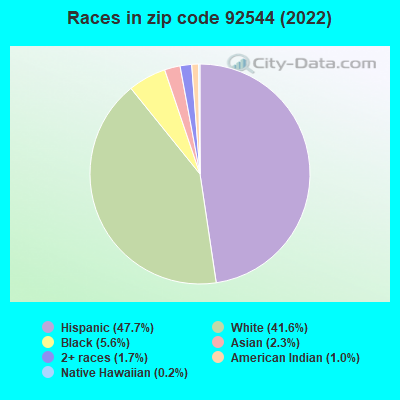
70.2% of residents of 92544 zip code speak English at home.
26.3% of residents speak Spanish at home (62% very well, 22% well, 13% not well, 3% not at all).
1.2% of residents speak other Indo-European language at home (57% very well, 27% well, 13% not well, 3% not at all).
1.6% of residents speak Asian or Pacific Island language at home (59% very well, 29% well, 7% not well, 5% not at all).
0.3% of residents speak other language at home (45% very well, 55% well).
Foreign born population: 7,237 (14.2%) (55.8% of them are naturalized citizens)
This zip code:
14.2%
Whole state:
26.7%
65%Honduras
4%Malaysia
3%Mexico
2%Costa Rica
2%El Salvador
2%Cabo Verde
2%Bhutan
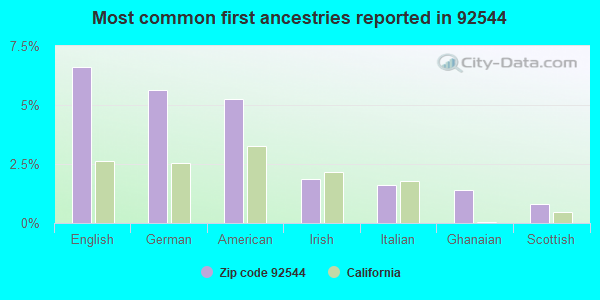
7%English
6%German
5%American
2%Irish
2%Italian
1%Ghanaian
1%Scottish
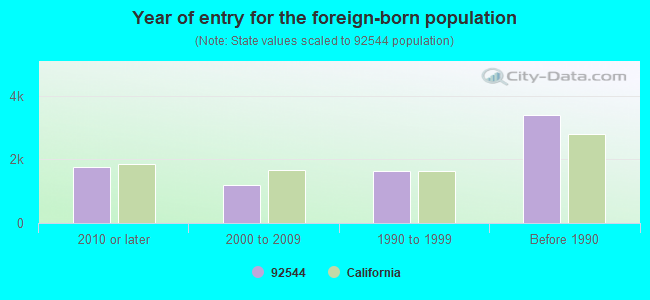
Year of entry for the foreign-born population
1,7602010 or later
1,1792000 to 2009
1,6221990 to 1999
3,389Before 1990
Major facilities with environmental interests located in this zip code:
CHEVRON STATION NO 93712 (2099 E FLORIDA AVE in HEMET, CA)
STATE MASTER (California - Hazardous Waste Tracking) - HAZARDOU WASTE PROGRAM Large Quantity Generators, more that 1000 kg of hazardous waste/month (Resource Conservation and Recovery Act (tracking hazardous waste)) Organizations: CHEVRON PRODUCTS CO. (CONTACT/OPERATOR)
JACK GOSCH INCORPORATED (41491 EAST FOLORIDA AVENUE in HEMET, CA)
STATE MASTER (California - Hazardous Waste Tracking) - HAZARDOU WASTE PROGRAM Small Quantity Generators, between 100 kg and 1000 kg of hazardous waste/month (Resource Conservation and Recovery Act (tracking hazardous waste)) Alternative names: JACK GOSCH FORD INC
HEMET ED. LEARNING CTR. (COMMUNITY DAY) (136 N. RAMONA ST. in HEMET, CA)
(National Center for Education Statistics) - STATE ID-3330768 Organizations: HEMET UNIFIED (SCHOOL DISTRICT)
HEMET SENIOR HIGH (41701 STETSON AVE. in HEMET, CA)
(National Center for Education Statistics) - STATE ID-3332673 Organizations: HEMET UNIFIED (SCHOOL DISTRICT)
JACOB WIENS ELEMENTARY (26400 DARTMOUTH in HEMET, CA)
(National Center for Education Statistics) - STATE ID-6118731 Organizations: HEMET UNIFIED (SCHOOL DISTRICT)
LITTLE LAKE ELEMENTARY (26091 S. MERIDIAN ST. in HEMET, CA)
(National Center for Education Statistics) - STATE ID-6032122 Organizations: HEMET UNIFIED (SCHOOL DISTRICT)
EASTERN MWD/HEMET-SAN JACINTO (HEMET & SAN JACINTO AREAS in HEMET, CA)
National Pollutant Discharge Elimination System NON-MAJOR (Tracking pollutant discharge elimination systems) - permit Business SIC classification: SEWERAGE SYSTEMS
HEMET IS HEAVEN RV CENTER (25050 SAN JACINTO AVE in HEMET, CA)
Small Quantity Generators, between 100 kg and 1000 kg of hazardous waste/month (Resource Conservation and Recovery Act (tracking hazardous waste)) - notification Organizations: BILL WILLIAMS (CONTACT/OWNER)
FAITH CHRISTIAN SCHOOL (26448 OLIVE DR in HEMET, CA)
COMPLIANCE ACTIVITY (Tracking inspections of insecticide, fungicide, and rodenticide, and toxic substances)
HOT SHOTS 1 HOUR PHOTO (41825 E FLORIDA AVE in HEMET, CA)
Small Quantity Generators, between 100 kg and 1000 kg of hazardous waste/month (Resource Conservation and Recovery Act (tracking hazardous waste)) - notification Business NAICS classification: PHOTOGRAPHY STUDIOS, PORTRAIT. Organizations: IVAN A ROSARIO (CONTACT/OWNER)
HYDROPROBE SVC CO (26473 CYNTHIA ST in HEMET, CA)
TRANSPORTER (Resource Conservation and Recovery Act (tracking hazardous waste)) Organizations: ALADDIN M MASRY (CONTACT/OWNER)
EASTERN MUNICIPAL WATER DISTRI (43280 WASHINGTON in HEMET, CA)
CRITERIA AND HAZARDOUS AIR POLLUTANT INVENTORY (Inventory of air pollution sources) Business SIC classification: WATER SUPPLY
EASTERN MUNICIPAL WATER DISTRI (42505 WASHINGTON AVE in HEMET, CA)
CRITERIA AND HAZARDOUS AIR POLLUTANT INVENTORY (Inventory of air pollution sources) Business SIC classification: WATER SUPPLY
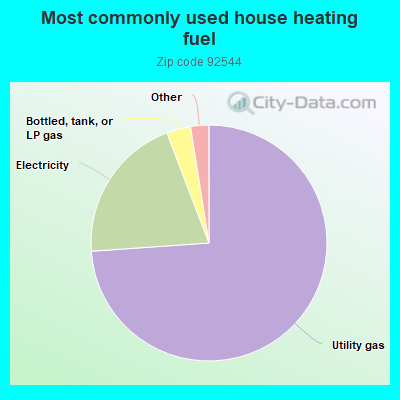
Housing units lacking complete plumbing facilities: 2.0% Housing units lacking complete kitchen facilities: 3.0%
73.9%Utility gas
20.3%Electricity
3.3%Bottled, tank, or LP gas
0.8%Wood
0.8%No fuel used
0.7%Solar energy
Population in 1990: 34,483. Population change in the 1990s: +4,771 (+13.8%).
Place of birth for U.S.-born residents:
This state: 35,356
Northeast: 1,467
Midwest: 2,463
South: 2,342
West: 1,476
50% of the 92544 zip code residents lived in the same house 5 years ago. Out of people who lived in different houses, 72% lived in this county. Out of people who lived in different counties, 50% lived in California.
90% of the 92544 zip code residents lived in the same house 1 year ago. Out of people who lived in different houses, 59% moved from this county. Out of people who lived in different houses, 29% moved from different county within same state. Out of people who lived in different houses, 7% moved from different state. Out of people who lived in different houses, 4% moved from abroad.
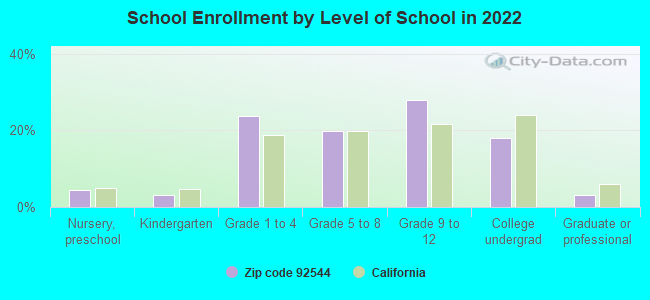
Private vs. public school enrollment:
Students in private schools in grades 1 to 8 (elementary and middle school): 584
Here:
9.6%
California:
10.5%
Students in private schools in grades 9 to 12 (high school): 164
Here:
4.2%
California:
8.5%
Students in private undergraduate colleges: 615
Here:
24.2%
California:
15.9%
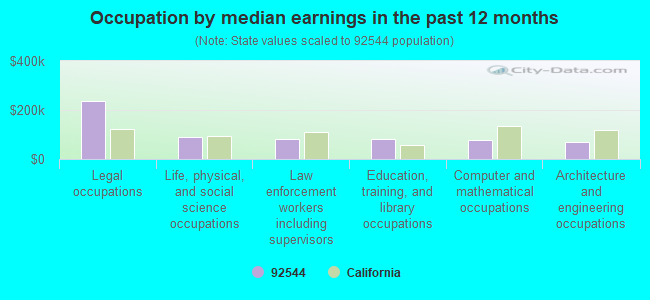
Occupation by median earnings in the past 12 months ($)
237,352Legal occupations
88,092Life, physical, and social science occupations
82,259Law enforcement workers including supervisors
81,802Education, training, and library occupations
78,659Computer and mathematical occupations
67,946Architecture and engineering occupations
Companies with federal contracts located in this zip code:
LORAN C. SMITH (669 NORTYH LK DR APT 1 in HEMET, CA; small business) : $231,272 in 20 contractsfrom 2003 to 2005
Contracts for Lease or Rental of Facilities -- Office Buildings by Public Buildings Service Signed by year:2000: $0; 2001: $0; 2002: $0; 2003: $138,456; 2004: $34,806; 2005: $58,010; 2006: $0.
Biggest contracts:
$11,602 with Public Buildings Service for Lease or Rental of Facilities -- Office Buildings. Signed on 2005-01-01. Completion date: 2005-04-30.
$11,602, same as above.Signed on 2004-10-01. Completion date: 2005-04-30.
$11,602, same as above.Signed on 2005-04-01. Completion date: 2005-04-30.
$11,602, same as above.Signed on 2004-10-01. Completion date: 2005-04-30.
JUAIRE, GEORGE R (43480 CEDAR AVE in HEMET, CA; small business) : $70,886 in 7 contractsfrom 2003 to 2006
Contracts for Other Housekeeping Services, Other Management Support Services, Recreation Site Maintenance Services (non-construction) by Army, U.S. Army Corps of Engineers - civil program financing only Signed by year:2000: $0; 2001: $0; 2002: $0; 2003: $10,200; 2004: $22,560; 2005: $25,098; 2006: $13,028.
Biggest contracts:
$13,113 with Army for Other Housekeeping Services. Taking place in GA. Signed on 2006-02-13. Completion date: 2006-12-30.
$12,549 with Army for Other Management Support Services. Taking place in GA. Signed on 2005-01-27. Completion date: 2005-12-31.
$12,549 with U.S. Army Corps of Engineers - civil program financing only for Other Management Support Services. Taking place in GA. Signed on 2005-01-27. Completion date: 2005-12-31.
$11,280 with Army for Other Management Support Services. Taking place in GA. Signed on 2004-02-06. Completion date: 2004-12-31.
Top industries in this zip code by the number of employees in 2005:
2005 - 2018 National Fire Incident Reporting System (NFIRS) incidents
Based on the data from the years 2005 - 2018 the average number of fires per year is 95. The highest number of fires - 156 took place in 2017, and the least - 11 in 2006. The data has a growing trend.
When looking into fire subcategories, the most incidents belonged to: Outside Fires (46.7%), and Structure Fires (29.0%).
Fire incident types reported to NFIRS in Zip Code 92544


 Nearest zip codes: 92543, 92583, 92596, 92545, 92536, 92549.
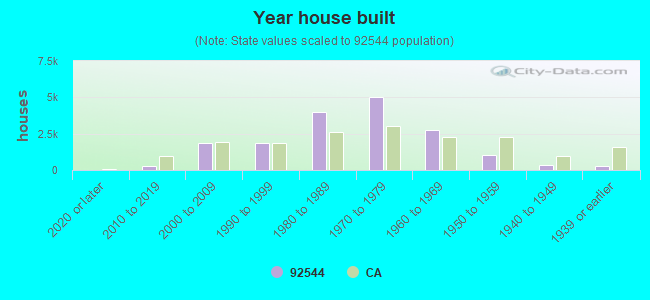


 Based on the data from the years 2005 - 2018 the average number of fires per year is 95. The highest number of fires - 156 took place in 2017, and the least - 11 in 2006. The data has a growing trend.
 When looking into fire subcategories, the most incidents belonged to: Outside Fires (46.7%), and Structure Fires (29.0%).