Estimated zip code population in 2022: 27,053 Zip code population in 2010: 25,404 Zip code population in 2000: 23,152
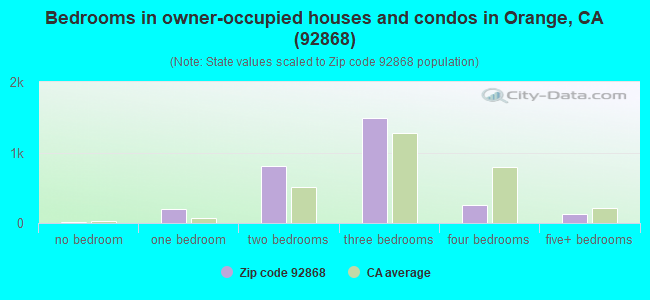
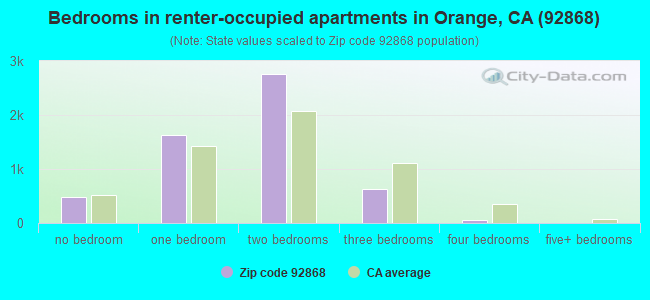
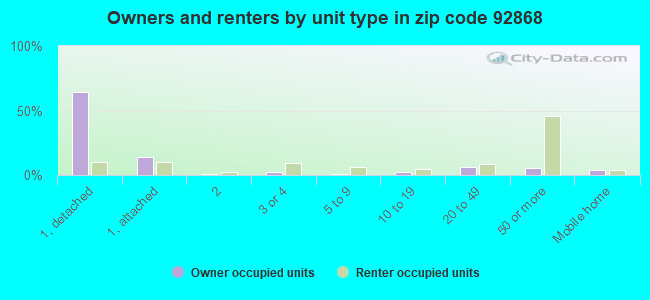
Houses and condos: 9,105 Renter-occupied apartments: 5,576
% of renters here:
66%
State:
44%
March 2022 cost of living index in zip code 92868: 87.3 (less than average, U.S. average is 100)
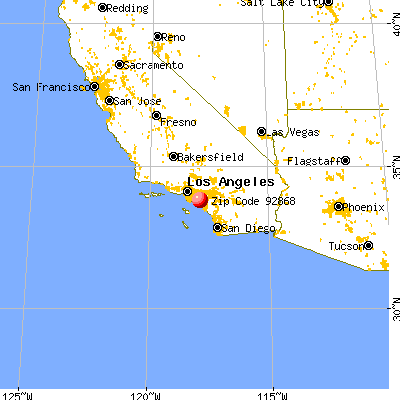
Land area: 3.2 sq. mi. Water area: 0.1 sq. mi.
Population density: 8,367 people per square mile
(high).
OSM Map
General Map
Google Map
MSN Map
OSM Map
General Map
Google Map
MSN Map
OSM Map
General Map
Google Map
MSN Map
OSM Map
General Map
Google Map
MSN Map
Please wait while loading the map...
Real estate property taxes paid for housing units in 2022:
This zip code:
0.6% ($4,103)
California:
0.7% ($4,831)
Median real estate property taxes paid for housing units with mortgages in 2022: $4,426 (0.6%) Median real estate property taxes paid for housing units with no mortgage in 2022: $2,527 (0.4%)
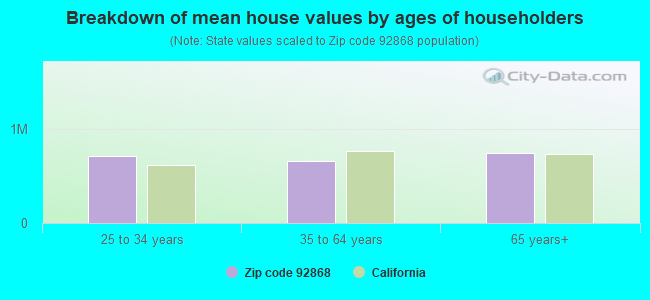
Estimated median house/condo value in 2022: $698,744
92868:
$698,744
California:
$715,900
According to our research of California and other state lists, there were 21 registered sex offenders living in 92868 zip code as of April 23, 2024. The ratio of all residents to sex offenders in zip code 92868 is 1,315 to 1. The ratio of registered sex offenders to all residents in this zip code is lower than the state average.
Median resident age:
This zip code:
33.4 years
California median age:
37.9 years
Average household size:
This zip code:
2.8 people
California:
2.8 people
Averages for the 2020 tax year for zip code 92868, filed in 2021:
Average Adjusted Gross Income (AGI) in 2020: $61,124 (Individual Income Tax Returns)
Here:
$61,124
State:
$95,910
Salary/wage: $53,343 (reported on 86.6% of returns)
Here:
$53,343
State:
$77,331
(% of AGI for various income ranges: 1280.4% for AGIs below $25k, 4259.1% for AGIs $25k-50k, 7758.1% for AGIs $50k-75k, 11647.4% for AGIs $75k-100k, 20496.1% for AGIs $100k-200k, 83144.3% for AGIs over 200k)
Taxable interest for individuals: $1,085 (reported on 24.8% of returns)
This zip code:
$1,085
California:
$2,294
(% of AGI for various income ranges: 7.9% for AGIs below $25k, 10.0% for AGIs $25k-50k, 21.8% for AGIs $50k-75k, 32.0% for AGIs $75k-100k, 78.3% for AGIs $100k-200k, 2261.4% for AGIs over 200k)
Ordinary dividends: $3,317 (reported on 11.2% of returns)
Here:
$3,317
State:
$10,949
(% of AGI for various income ranges: 14.2% for AGIs below $25k, 9.8% for AGIs $25k-50k, 37.5% for AGIs $50k-75k, 36.9% for AGIs $75k-100k, 102.9% for AGIs $100k-200k, 3165.7% for AGIs over 200k)
Net capital gain/loss in AGI: +$10,076 (reported on 12.5% of returns)
Here:
+$10,076
State:
+$49,306
(% of AGI for various income ranges: 7.4% for AGIs below $25k, 9.4% for AGIs $25k-50k, 28.6% for AGIs $50k-75k, 92.0% for AGIs $75k-100k, 253.4% for AGIs $100k-200k, 16167.1% for AGIs over 200k)
Profit/loss from business: +$8,957 (reported on 16.9% of returns)
Here:
+$8,957
State:
+$15,671
(% of AGI for various income ranges: 200.8% for AGIs below $25k, 125.1% for AGIs $25k-50k, 129.8% for AGIs $50k-75k, 294.5% for AGIs $75k-100k, 414.3% for AGIs $100k-200k, 4068.6% for AGIs over 200k)
Taxable individual retirement arrangement distribution: $13,857 (reported on 3.6% of returns)
92868:
$13,857
California:
$23,505
(% of AGI for various income ranges: 25.9% for AGIs below $25k, 40.0% for AGIs $25k-50k, 54.4% for AGIs $50k-75k, 123.6% for AGIs $75k-100k, 266.3% for AGIs $100k-200k, 818.6% for AGIs over 200k)
Total itemized deductions: $29,497 (reported on 9.3% of returns)
Here:
$29,497
State:
$39,517
(% of AGI for various income ranges: 51.8% for AGIs below $25k, 115.3% for AGIs $25k-50k, 345.0% for AGIs $50k-75k, 725.1% for AGIs $75k-100k, 1600.7% for AGIs $100k-200k, 8084.3% for AGIs over 200k)
Charity contributions: $5,499 (reported on 7.6% of returns)
Here:
$5,499
State:
$12,598
(% of AGI for various income ranges: 3.2% for AGIs below $25k, 14.9% for AGIs $25k-50k, 37.7% for AGIs $50k-75k, 81.8% for AGIs $75k-100k, 243.3% for AGIs $100k-200k, 2137.1% for AGIs over 200k)
Taxes paid: $8,164 (reported on 9.2% of returns)
92868:
$8,164
State:
$8,807
(% of AGI for various income ranges: 10.7% for AGIs below $25k, 25.4% for AGIs $25k-50k, 96.0% for AGIs $50k-75k, 221.5% for AGIs $75k-100k, 504.7% for AGIs $100k-200k, 1568.6% for AGIs over 200k)
Earned income credit: $1,917 (reported on 13.8% of returns)
Here:
$1,917
State:
$2,074
(% of AGI for various income ranges: 78.0% for AGIs below $25k, 51.6% for AGIs $25k-50k, 1.2% for AGIs $50k-75k)
Percentage of individuals using paid preparers for their 2020 taxes: 93.0%
Here:
93%
State:
92%
(% for various income ranges: 91.4% for AGIs below $25k, 93.5% for AGIs $25k-50k, 93.5% for AGIs $50k-75k, 94.9% for AGIs $75k-100k, 94.2% for AGIs $100k-200k, 92.0% for AGIs over 200k)
Averages for the 2012 tax year for zip code 92868, filed in 2013:
Average Adjusted Gross Income (AGI) in 2012: $45,965 (Individual Income Tax Returns)
Here:
$45,965
State:
$72,726
Salary/wage: $43,713 (reported on 88.4% of returns)
Here:
$43,713
State:
$59,079
(% of AGI for various income ranges: 80.4% for AGIs below $25k, 89.4% for AGIs $25k-50k, 88.5% for AGIs $50k-75k, 88.6% for AGIs $75k-100k, 86.5% for AGIs $100k-200k, 54.4% for AGIs over 200k)
Taxable interest for individuals: $1,044 (reported on 24.5% of returns)
This zip code:
$1,044
California:
$2,146
(% of AGI for various income ranges: 0.3% for AGIs below $25k, 0.3% for AGIs $25k-50k, 0.2% for AGIs $50k-75k, 0.4% for AGIs $75k-100k, 0.6% for AGIs $100k-200k, 2.5% for AGIs over 200k)
Ordinary dividends: $3,190 (reported on 9.1% of returns)
Here:
$3,190
State:
$9,308
(% of AGI for various income ranges: 0.4% for AGIs below $25k, 0.4% for AGIs $25k-50k, 0.4% for AGIs $50k-75k, 0.3% for AGIs $75k-100k, 0.4% for AGIs $100k-200k, 2.9% for AGIs over 200k)
Net capital gain/loss in AGI: +$2,386 (reported on 8.2% of returns)
Here:
+$2,386
State:
+$30,460
(% of AGI for various income ranges: 0.6% for AGIs $100k-200k, 3.7% for AGIs over 200k)
Profit/loss from business: +$9,640 (reported on 15.6% of returns)
Here:
+$9,640
State:
+$17,064
(% of AGI for various income ranges: 10.6% for AGIs below $25k, 2.8% for AGIs $25k-50k, 2.5% for AGIs $50k-75k, 1.9% for AGIs $75k-100k, 2.1% for AGIs $100k-200k, 1.9% for AGIs over 200k)
Taxable individual retirement arrangement distribution: $9,780 (reported on 4.3% of returns)
92868:
$9,780
California:
$19,557
(% of AGI for various income ranges: 1.1% for AGIs below $25k, 0.8% for AGIs $25k-50k, 1.0% for AGIs $50k-75k, 0.8% for AGIs $75k-100k, 1.3% for AGIs $100k-200k)
Total itemized deductions: $22,598 (26% of AGI, reported on 27.5% of returns)
Here:
$22,598
State:
$34,004
Here:
26.0% of AGI
State:
22.7% of AGI
(% of AGI for various income ranges: 7.0% for AGIs below $25k, 9.5% for AGIs $25k-50k, 13.5% for AGIs $50k-75k, 16.7% for AGIs $75k-100k, 17.8% for AGIs $100k-200k, 16.1% for AGIs over 200k)
Charity contributions: $2,984 (reported on 22.6% of returns)
Here:
$2,984
State:
$4,659
(% of AGI for various income ranges: 0.4% for AGIs below $25k, 0.9% for AGIs $25k-50k, 1.4% for AGIs $50k-75k, 2.6% for AGIs $75k-100k, 1.8% for AGIs $100k-200k, 1.7% for AGIs over 200k)
Taxes paid: $7,248 (reported on 27.5% of returns)
92868:
$7,248
State:
$14,448
(% of AGI for various income ranges: 1.2% for AGIs below $25k, 1.9% for AGIs $25k-50k, 3.6% for AGIs $50k-75k, 5.0% for AGIs $75k-100k, 6.5% for AGIs $100k-200k, 9.7% for AGIs over 200k)
Earned income credit: $2,078 (reported on 18.2% of returns)
Here:
$2,078
State:
$2,286
(% of AGI for various income ranges: 5.2% for AGIs below $25k, 1.0% for AGIs $25k-50k)
Percentage of individuals using paid preparers for their 2012 taxes: 66.7%
Here:
67%
State:
64%
(% for various income ranges: 64.4% for AGIs below $25k, 68.2% for AGIs $25k-50k, 67.3% for AGIs $50k-75k, 68.1% for AGIs $75k-100k, 68.4% for AGIs $100k-200k, 80.0% for AGIs over 200k)
Averages for the 2004 tax year for zip code 92868, filed in 2005:
Average Adjusted Gross Income (AGI) in 2004: $39,597 (Individual Income Tax Returns)
Here:
$39,597
State:
$58,600
Salary/wage: $38,191 (reported on 89.1% of returns)
Here:
$38,191
State:
$49,455
(% of AGI for various income ranges: 106.6% for AGIs below $10k, 83.9% for AGIs $10k-25k, 91.0% for AGIs $25k-50k, 90.1% for AGIs $50k-75k, 89.9% for AGIs $75k-100k, 70.8% for AGIs over 100k)
Taxable interest for individuals: $1,069 (reported on 35.6% of returns)
This zip code:
$1,069
California:
$2,365
(% of AGI for various income ranges: 4.5% for AGIs below $10k, 1.0% for AGIs $10k-25k, 0.6% for AGIs $25k-50k, 0.5% for AGIs $50k-75k, 0.5% for AGIs $75k-100k, 2.1% for AGIs over 100k)
Taxable dividends: $1,590 (reported on 11.7% of returns)
Here:
$1,590
State:
$4,746
(% of AGI for various income ranges: 2.7% for AGIs below $10k, 0.5% for AGIs $10k-25k, 0.3% for AGIs $25k-50k, 0.3% for AGIs $50k-75k, 0.2% for AGIs $75k-100k, 0.9% for AGIs over 100k)
Net capital gain/loss: +$5,913 (reported on 9.5% of returns)
Here:
+$5,913
State:
+$23,418
(% of AGI for various income ranges: -0.6% for AGIs below $10k, 0.3% for AGIs $10k-25k, -0.1% for AGIs $25k-50k, 0.5% for AGIs $50k-75k, 1.0% for AGIs $75k-100k, 5.9% for AGIs over 100k)
Profit/loss from business: +$9,598 (reported on 14.6% of returns)
Here:
+$9,598
State:
+$16,826
(% of AGI for various income ranges: 9.4% for AGIs below $10k, 7.5% for AGIs $10k-25k, 2.7% for AGIs $25k-50k, 2.6% for AGIs $50k-75k, 2.0% for AGIs $75k-100k, 4.2% for AGIs over 100k)
IRA payment deduction: $2,788 (reported on 2.4% of returns)
92868:
$2,788
California:
$3,192
(% of AGI for various income ranges: 0.2% for AGIs $10k-25k, 0.2% for AGIs $25k-50k, 0.2% for AGIs $50k-75k, 0.1% for AGIs $75k-100k, 0.1% for AGIs over 100k)
Self-employed pension: $11,312 (reported on 0.4% of returns)
Here:
$11,312
California:
$17,688
(% of AGI for various income ranges: 1.0% for AGIs below $10k, 0.1% for AGIs $50k-75k, 0.3% for AGIs over 100k)
Total itemized deductions: $19,934 (30% of AGI, reported on 32.9% of returns)
Here:
$19,934
State:
$28,113
Here:
29.8% of AGI
State:
25.3% of AGI
(% of AGI for various income ranges: 16.8% for AGIs below $10k, 11.3% for AGIs $10k-25k, 13.6% for AGIs $25k-50k, 19.1% for AGIs $50k-75k, 20.8% for AGIs $75k-100k, 18.1% for AGIs over 100k)
Charity contributions deductions: $2,408 (3% of AGI, reported on 29.1% of returns)
Here:
$2,408
State:
$3,923
Here:
3.5% of AGI
State:
3.3% of AGI
(% of AGI for various income ranges: 0.9% for AGIs below $10k, 0.8% for AGIs $10k-25k, 1.4% for AGIs $25k-50k, 2.2% for AGIs $50k-75k, 2.4% for AGIs $75k-100k, 2.0% for AGIs over 100k)
Total tax: $5,061 (reported on 74.0% of returns)
92868:
$5,061
State:
$10,761
(% of AGI for various income ranges: 4.3% for AGIs below $10k, 4.1% for AGIs $10k-25k, 6.5% for AGIs $25k-50k, 9.1% for AGIs $50k-75k, 10.1% for AGIs $75k-100k, 17.2% for AGIs over 100k)
Earned income credit: $1,738 (reported on 15.8% of returns)
Here:
$1,738
State:
$1,763
Percentage of individuals using paid preparers for their 2004 taxes: 67.7%
Here:
68%
State:
66%
(% for various income ranges: 59.9% for AGIs below $10k, 68.0% for AGIs $10k-25k, 67.4% for AGIs $25k-50k, 69.7% for AGIs $50k-75k, 73.4% for AGIs $75k-100k, 77.2% for AGIs over 100k)
Likely homosexual households (counted as self-reported same-sex unmarried-partner households)
Lesbian couples: 0.2% of all households
Gay men: 0.2% of all households
Household received Food Stamps/SNAP in the past 12 months: 835 Household did not receive Food Stamps/SNAP in the past 12 months: 7,613
Women who had a birth in the past 12 months: 208 (129 now married, 79 unmarried) Women who did not have a birth in the past 12 months: 6,706 (2,564 now married, 4,145 unmarried)
Housing units in zip code 92868 with a mortgage: 2,242 (163 second mortgage, 13 home equity loan, 114 both second mortgage and home equity loan) Houses without a mortgage: 57
Median monthly owner costs for units with a mortgage: $2,519 Median monthly owner costs for units without a mortgage: $626
Residents with income below the poverty level in 2022:
This zip code:
12.6%
Whole state:
12.2%
Residents with income below 50% of the poverty level in 2022:
This zip code:
6.1%
Whole state:
6.2%
Median number of rooms in houses and condos:
Here:
5.4
State:
6.0
Median number of rooms in apartments:
Here:
3.5
State:
3.9
Notable locations in this zip code not listed on our city pages
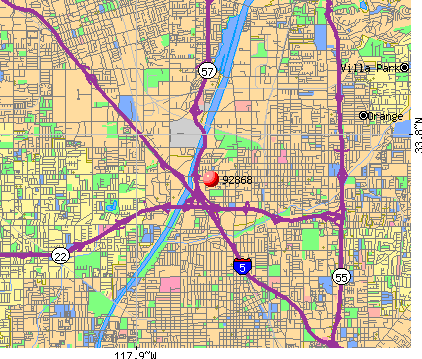
Notable locations in zip code 92868: Lacy Security Facility (A), Care Ambulance Service (B), City of Orange Fire Department Station 6 (C), City of Orange Fire Department Station 5 (D). Display/hide their locations on the map
2,270 married couples with children.
1,555 single-parent households (250 men, 1,305 women).
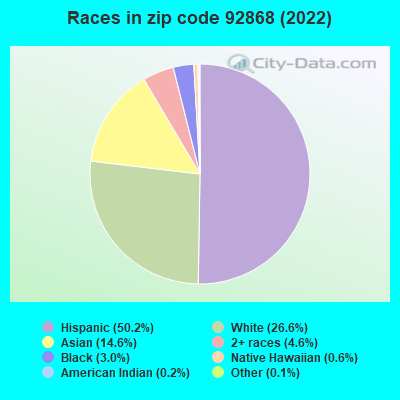
52.6% of residents of 92868 zip code speak English at home.
33.8% of residents speak Spanish at home (64% very well, 20% well, 11% not well, 5% not at all).
1.2% of residents speak other Indo-European language at home (94% very well, 6% well).
11.8% of residents speak Asian or Pacific Island language at home (55% very well, 26% well, 16% not well, 3% not at all).
0.6% of residents speak other language at home (93% very well, 4% not well, 3% not at all).
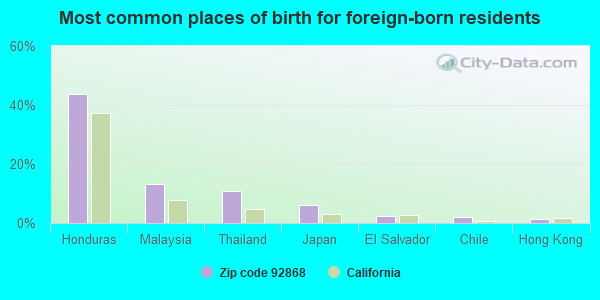
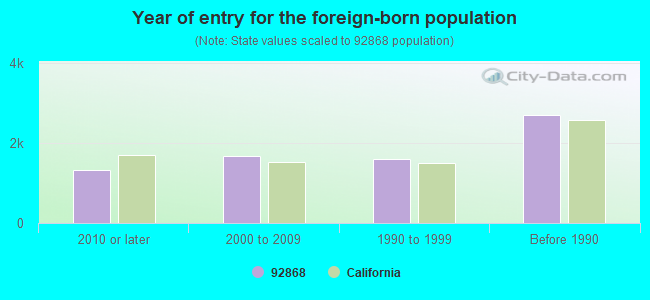
Foreign born population: 6,631 (24.5%) (52.4% of them are naturalized citizens)
Major facilities with environmental interests located in this zip code:
INDEPENDENT FORGE CO (692 N BATAVIA ST in ORANGE, CA)
STATE MASTER (California - Hazardous Waste Tracking) - HAZARDOU WASTE PROGRAM HAZARDOUS WASTE BIENNIAL REPORTER (Resource Conservation and Recovery Act (tracking hazardous waste)) Large Quantity Generators, more that 1000 kg of hazardous waste/month (Resource Conservation and Recovery Act (tracking hazardous waste)) Business NAICS classification: ALUMINUM EXTRUDED PRODUCT MANUFACTURING.
JOHN JEZOWSKI INC (748 N POPLAR in ORANGE, CA)
STATE MASTER (California - Hazardous Waste Tracking) - HAZARDOU WASTE PROGRAM Small Quantity Generators, between 100 kg and 1000 kg of hazardous waste/month (Resource Conservation and Recovery Act (tracking hazardous waste)) - notification Alternative names: JEZOWSKI & MARKEL CONTRACTORS INC
ACS HYDRAULIC INC (756 N HARITION in ORANGE, CA)
STATE MASTER (California - Hazardous Waste Tracking) - HAZARDOU WASTE PROGRAM Small Quantity Generators, between 100 kg and 1000 kg of hazardous waste/month (Resource Conservation and Recovery Act (tracking hazardous waste)) - notification Organizations: STEVEN DRILLING (CONTACT/OWNER)
Alternative names: ACS HYDRAULICS INC
GRAY THOMAS & ASSOC (1205 W BARKLEY AVE in ORANGE, CA)
STATE MASTER (California - Hazardous Waste Tracking) - HAZARDOU WASTE PROGRAM TRANSPORTER (Resource Conservation and Recovery Act (tracking hazardous waste)) - notification Organizations: THOMAS A GRAY (CONTACT/OWNER)
Alternative names: THOMAS GRAY & ASSOCIATES INC
MAGIC CARPET TRANSPORTATION (1202 W SHELLY CT in ORANGE, CA)
STATE MASTER (California - Hazardous Waste Tracking) - HAZARDOU WASTE PROGRAM Small Quantity Generators, between 100 kg and 1000 kg of hazardous waste/month (Resource Conservation and Recovery Act (tracking hazardous waste)) - notification Business NAICS classification: ALL OTHER TRANSIT AND GROUND PASSENGER TRANSPORTATION. Alternative names: MAGIC CARPET AMBULETTE CORP
MAILING & MARKETING INC (324 BLUERIDGE in ORANGE, CA)
STATE MASTER (California - Hazardous Waste Tracking) - HAZARDOU WASTE PROGRAM Small Quantity Generators, between 100 kg and 1000 kg of hazardous waste/month (Resource Conservation and Recovery Act (tracking hazardous waste)) - notification Organizations: D INGLE & B GALEY (CONTACT/OWNER)
HANDPIECE PARTS AND PRODUCTS (707 W ANGUS in ORANGE, CA)
STATE MASTER (California - Hazardous Waste Tracking) - HAZARDOU WASTE PROGRAM Small Quantity Generators, between 100 kg and 1000 kg of hazardous waste/month (Resource Conservation and Recovery Act (tracking hazardous waste)) - notification Organizations: STAN BOWEN (CONTACT/OWNER)
ALL DIAMETER GRINDING INC (725 N MAIN ST in ORANGE, CA)
STATE MASTER (California - Hazardous Waste Tracking) - HAZARDOU WASTE PROGRAM Small Quantity Generators, between 100 kg and 1000 kg of hazardous waste/month (Resource Conservation and Recovery Act (tracking hazardous waste)) - notification Organizations: MARVIN W GOODWIN (CONTACT/OWNER)
APPLIED FRICTION TECHNIQUES INC (1223 W BARKLEY AVE in ORANGE, CA)
STATE MASTER (California - Hazardous Waste Tracking) - HAZARDOU WASTE PROGRAM Small Quantity Generators, between 100 kg and 1000 kg of hazardous waste/month (Resource Conservation and Recovery Act (tracking hazardous waste)) - notification Organizations: ROBERT C BROOKS (CONTACT/OWNER)
KARCO SPECIALTIES (721 N BATAVIA ST in ORANGE, CA)
STATE MASTER (California - Hazardous Waste Tracking) - HAZARDOU WASTE PROGRAM Small Quantity Generators, between 100 kg and 1000 kg of hazardous waste/month (Resource Conservation and Recovery Act (tracking hazardous waste)) - notification Organizations: KARTOZIAN RICHARD (CONTACT/OWNER)
FLOWER ST CLEANERS (2322 W CHAPMAN AVE in ORANGE, CA)
STATE MASTER (California - Hazardous Waste Tracking) - HAZARDOU WASTE PROGRAM Small Quantity Generators, between 100 kg and 1000 kg of hazardous waste/month (Resource Conservation and Recovery Act (tracking hazardous waste)) - notification Organizations: BUM KOO KANG (CONTACT/OWNER)
MORAN ROWEN AND DORSEY INC (1310 WEST STEWART DRIVE SUITE 402 in ORANGE, CA)
STATE MASTER (California - Hazardous Waste Tracking) - HAZARDOU WASTE PROGRAM Small Quantity Generators, between 100 kg and 1000 kg of hazardous waste/month (Resource Conservation and Recovery Act (tracking hazardous waste)) - notification Business NAICS classification: OFFICES OF PHYSICIANS, MENTAL HEALTH SPECIALISTS.
MORAN ROWEN DORSEY INC (705 W LA VETA STE 107 in ORANGE, CA)
STATE MASTER (California - Hazardous Waste Tracking) - HAZARDOU WASTE PROGRAM Small Quantity Generators, between 100 kg and 1000 kg of hazardous waste/month (Resource Conservation and Recovery Act (tracking hazardous waste)) - notification Business NAICS classification: OFFICES OF PHYSICIANS, MENTAL HEALTH SPECIALISTS. Alternative names: MORAN ROWEN AND DORSEY INC
Housing units lacking complete plumbing facilities: 0.9% Housing units lacking complete kitchen facilities: 2.3%
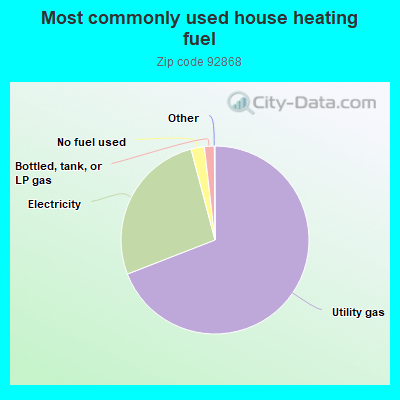
69.1%Utility gas
26.8%Electricity
2.3%No fuel used
1.7%Bottled, tank, or LP gas
Place of birth for U.S.-born residents:
This state: 16,856
Northeast: 543
Midwest: 854
South: 777
West: 711
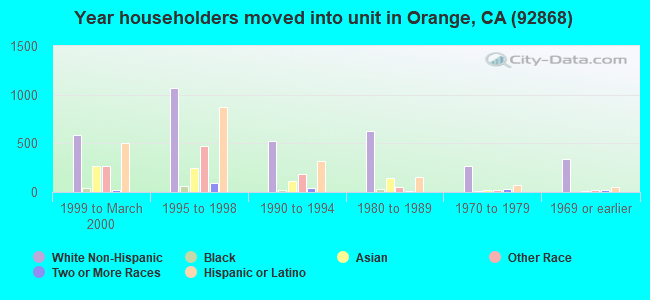
41% of the 92868 zip code residents lived in the same house 5 years ago. Out of people who lived in different houses, 78% lived in this county. Out of people who lived in different counties, 50% lived in California.
86% of the 92868 zip code residents lived in the same house 1 year ago. Out of people who lived in different houses, 65% moved from this county. Out of people who lived in different houses, 25% moved from different county within same state. Out of people who lived in different houses, 5% moved from different state. Out of people who lived in different houses, 1% moved from abroad.
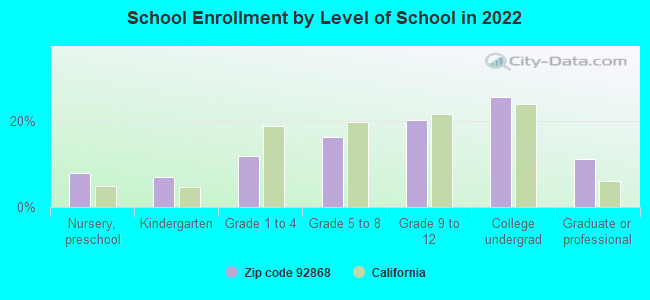
Private vs. public school enrollment:
Students in private schools in grades 1 to 8 (elementary and middle school): 232
Here:
12.7%
California:
10.5%
Students in private schools in grades 9 to 12 (high school): 118
Here:
9.0%
California:
8.5%
Students in private undergraduate colleges: 406
Here:
24.4%
California:
15.9%
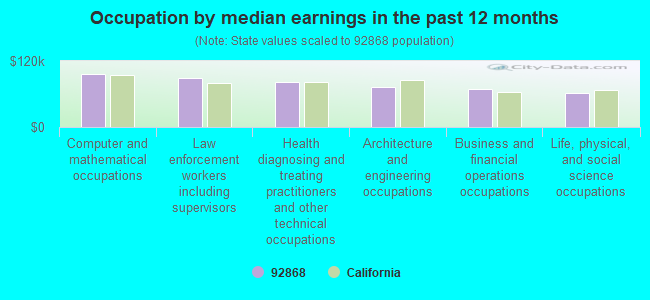
Occupation by median earnings in the past 12 months ($)
97,269Computer and mathematical occupations
88,721Law enforcement workers including supervisors
81,735Health diagnosing and treating practitioners and other technical occupations
73,188Architecture and engineering occupations
69,675Business and financial operations occupations
62,304Life, physical, and social science occupations
Companies with biggest federal contracts located in this zip code (ORANGE, CA):
BERGEN BRUNSWIG DRUG COMPANY (4000 W METROPOLITAN DR) : $1,504,833,373 in 42332 contractsfrom 2000 to 2006
Contracts for Drugs and Biologicals, Medical and Surgical Instruments, Equipment, and Supplies, Fire Control Maintenance and Repair Shop Specialized Equipment, Medicated Cosmetics and Toiletries by Defense Logistics Agency Signed by year:2000: $39,578,598; 2001: $291,514,186; 2002: $263,832,094; 2003: $114,943,975; 2004: $567,333,908; 2005: $216,972,293; 2006: $10,658,319.
Biggest contracts:
$2,735,293 with Defense Logistics Agency for Drugs and Biologicals. Taking place in HI. Signed on 2003-12-24. Completion date: 2004-01-02.
$1,474,441, same as above.Signed on 2005-02-17. Completion date: 2005-02-26.
$1,297,935 with Defense Logistics Agency for Drugs and Biologicals. Taking place in VA. Signed on 2002-08-13. Completion date: 2002-08-20.
$864,500 with Defense Logistics Agency for Drugs and Biologicals. Signed on 2002-08-30. Completion date: 2002-09-06.
BERGEN BRUNSWIG CORPORATION (4000 W METROPOLITAN DR) : $227,979,848 in 4803 contractsfrom 1999 to 2005
Contracts for Drugs and Biologicals, Medical and Surgical Instruments, Equipment, and Supplies, Lease or Rental of Equipment -- Ground Effect Vehicles, Motor Vehicles, Trailers, and Cycles by Defense Logistics Agency, Bureau of Prisoners/Federal Prison System, Department of Veterans Affairs, Army, and others Signed by year:2000: $176,160,900; 2001: $11,000; 2002: $4,000; 2003: $900; 2004: $5,477,076; 2005: $5,516,533; 2006: $0.
Biggest contracts:
$1,044,688 with Defense Logistics Agency for Drugs and Biologicals. Taking place in HI. Signed on 2000-02-02. Completion date: 2000-02-10.
$491,501 with Defense Logistics Agency for Drugs and Biologicals. Taking place in VA. Signed on 2000-09-29. Completion date: 2000-10-06.
$465,096 with Defense Logistics Agency for Drugs and Biologicals. Signed on 2000-09-12. Completion date: 2000-10-03.
$463,742 with Defense Logistics Agency for Drugs and Biologicals. Taking place in VA. Signed on 2000-09-28. Completion date: 2000-10-05.
HOLMES & NARVER SERVICES, INC (999 W TOWN AND COUNTRY RD) : $186,587,750 in 96 contractsfrom 1999 to 2006
Contracts for Maintenance, Repair and Rebuilding of Equipment -- Ground Effect Vehicles, Motor Vehicles, Trailers, and Cycles, Facilities Operations Support Services, Construction of Structures and Facilities -- Family Housing Facilities, Telecommunications Network Management Services, and moreby Army, Air Force Signed by year:2000: $122,363; 2001: $20,592; 2002: -$176,040; 2003: $10,865,778; 2004: $69,588,496; 2005: $77,300,768; 2006: $28,867,715.
Biggest contracts:
$15,279,933 with Army for Maintenance, Repair and Rebuilding of Equipment -- Ground Effect Vehicles, Motor Vehicles, Trailers, and Cycles. Taking place in TX. Signed on 2005-04-29. Completion date: 2009-09-29.
$14,988,304 with Army for Facilities Operations Support Services. Taking place in LA. Signed on 2004-03-03. Completion date: 2004-06-14.
$14,978,304, same as above.Signed on 2004-03-18. Completion date: 2004-06-14.
$11,500,000 with Army for Maintenance, Repair and Rebuilding of Equipment -- Ground Effect Vehicles, Motor Vehicles, Trailers, and Cycles. Taking place in TX. Signed on 2005-05-19. Completion date: 2009-09-29.
HOLMES & NARVER INC (999 TOWN & COUNTRY ROAD) : $18,909,293 in 152 contractsfrom 1999 to 2006
Contracts for Maintenance, Repair or Alteration of Real Property -- Family Housing Facilities, Intercommunication and Public Address Systems, Airborne, Architect - Engineer Services (including landscaping, interior layout, and designing), Engineering and Technical Services, and moreby Army, Internal Revenue Service, NASA, ENERGY, Department of, and others Signed by year:2000: $5,252,185; 2001: $3,272,221; 2002: $2,411,898; 2003: $2,471,436; 2004: $5,663,263; 2005: $4,131; 2006: -$54,669.
Biggest contracts:
$5,126,001 with Army for Maintenance, Repair or Alteration of Real Property -- Family Housing Facilities. Taking place in MO. Signed on 2004-04-30. Completion date: 2000-02-25.
$3,600,000 with Internal Revenue Service for Intercommunication and Public Address Systems, Airborne. Taking place in DC. Signed on 2000-03-15. Completion date: 2000-04-15.
$1,262,153 with NASA for Architect - Engineer Services (including landscaping, interior layout, and designing). Signed on 2003-10-01. Completion date: 2004-07-31.
$650,000 with Internal Revenue Service for Engineering and Technical Services. Taking place in VA. Signed on 2001-09-15. Completion date: 2006-08-15.
HOLMES & NARVER CONSTRUCTORS, (999 TOWN & COUNTRY ROAD) : $11,980,640 in 15 contractsfrom 1999 to 2003
Contracts for Construction of Structures and Facilities -- Family Housing Facilities, Construction of Structures and Facilities -- Other Non-Building Facilities by Army, Air Force Signed by year:2000: $11,364,806; 2001: $9,382; 2002: $203,539; 2003: -$289,424; 2004: $0; 2005: $0; 2006: $0.
Biggest contracts:
$11,193,254 with Army for Construction of Structures and Facilities -- Family Housing Facilities. Taking place in MS. Signed on 2000-03-31. Completion date: 2001-05-15.
$488,591 with Air Force for Construction of Structures and Facilities -- Family Housing Facilities. Signed on 1999-11-24. Completion date: 2000-04-13.
$171,552 with Army for Construction of Structures and Facilities -- Other Non-Building Facilities. Taking place in MS. Signed on 2000-09-07. Completion date: 2001-04-09.
$123,707, same as above.Signed on 2002-05-30. Completion date: 2002-11-29.
WEST AMERICAN RUBBER COMPANY, (1413 W BRADEN CT; small business) : $3,284,750 in 16 contractsfrom 2000 to 2006
Contracts for Camouflage and Deception Equipment, Safety and Rescue Equipment, O-Ring, Rubber Fabricated Materials by Army, Navy Signed by year:2000: $102,274; 2001: $525,141; 2002: $735,431; 2003: $1,229,424; 2004: $0; 2005: $680,369; 2006: $12,111.
Biggest contracts:
$911,949 with Army for Camouflage and Deception Equipment. Signed on 2003-03-06. Completion date: 2003-05-31.
$693,828, same as above.Signed on 2002-09-11. Completion date: 2003-05-31.
$495,735 with Army for Safety and Rescue Equipment. Signed on 2005-05-17. Completion date: 2005-12-31.
$375,129 with Army for Camouflage and Deception Equipment. Signed on 2001-06-01. Completion date: 2003-05-31.
SFPP, L P (1100 TOWN AND COUNTRY ROAD)
$973,140 with Defense Logistics Agency for Lease or Rental of Facilities -- Fuel Storage Buildings. Signed on 2004-06-15. Completion date: 2005-10-03.
DEPAR, INC (806 NORTH BATAVIA STREET; small business) : $683,567 in 259 contractsfrom 2000 to 2005
Contracts for Facilities Operations Support Services, Other Housekeeping Services, Quality Control Services -- Water Purification and Sewage Treatment Equipment, Quality Control Services -- Special Industry Machinery, and moreby Navy, Air Force Signed by year:2000: $28,507; 2001: $110,581; 2002: $270,542; 2003: $187,092; 2004: $80,803; 2005: $6,042; 2006: $0.
Biggest contracts:
$45,000 with Navy for Facilities Operations Support Services. Signed on 2002-03-25. Completion date: 2002-04-30.
$40,000, same as above.Signed on 2004-11-08. Completion date: 2005-09-30.
$35,000, same as above.Signed on 2001-11-30. Completion date: 2001-12-31.
$30,000, same as above.Signed on 2001-12-27. Completion date: 2002-01-31.
PURE EFFECT INCORPORATED (611 W PALM AVE; small business) : $633,241 in 10 contractsfrom 1999 to 2005
Contracts for Maintenance, Repair and Rebuilding of Equipment -- Brushes, Paints, Sealers, and Adhesives, Other Housekeeping Services, Plywood and Veneer, Maintenance, Repair and Rebuilding of Equipment -- Service and Trade Equipment by Air Force Signed by year:2000: $96,640; 2001: $88,115; 2002: $307,680; 2003: $25,674; 2004: $0; 2005: $18,492; 2006: $0.
Biggest contracts:
$139,480 with Air Force for Maintenance, Repair and Rebuilding of Equipment -- Brushes, Paints, Sealers, and Adhesives. Taking place in AZ. Signed on 2002-10-01. Completion date: 2003-09-30.
$99,480 with Air Force for Other Housekeeping Services. Taking place in NV. Signed on 2002-02-13. Completion date: 2002-09-30.
$96,640, same as above.Signed on 2000-11-21. Completion date: 2001-09-30.
$96,640, same as above.Signed on 1999-10-07. Completion date: 2000-09-30.
GRAY, THOMAS & ASSOCIATES INC (1205 W BARKLEY AVE; small business) : $505,290 in 20 contractsfrom 2000 to 2006
Contracts for Development of Environmental Impact Statements and Assessments, Waste Treatment and Storage, Hazardous Substance Removal, Cleanup, and Disposal Services and Operational Support, Other Salvage Services, and moreby Army, Department of Veterans Affairs, Agricultural Research Service (disused code), Agricultural Research Service, and others Signed by year:2000: $81,125; 2001: $72,354; 2002: $94,860; 2003: -$1,000; 2004: $169,647; 2005: $70,473; 2006: $17,831.
Biggest contracts:
$81,125 with Army for Development of Environmental Impact Statements and Assessments. Signed on 2000-09-27. Completion date: 2003-09-30.
$75,438 with Department of Veterans Affairs for Waste Treatment and Storage. Signed on 2004-08-19. Effective on 2004-09-30. Completion date: 2004-09-30.
$69,081 with Army for Hazardous Substance Removal, Cleanup, and Disposal Services and Operational Support. Signed on 2001-12-21. Completion date: 2002-09-30.
$69,063 with Department of Veterans Affairs for Hazardous Substance Removal, Cleanup, and Disposal Services and Operational Support. Signed on 2004-03-22. Completion date: 2004-05-01.
Top industries in this zip code by the number of employees in 2005:
Health Care and Social Assistance: General Medical and Surgical Hospitals (over 1000 employees: 3 establishments)
Administrative and Support and Waste Management and Remediation Services: Temporary Help Services (over 1000: 1, 500-999: 1, 100-249: 9, 50-99: 6, 20-49: 5, 10-19: 1, 5-9: 1, 1-4: 8)
Management of Companies and Enterprises: Corporate, Subsidiary, and Regional Managing Offices (500-999: 1, 250-499: 2, 100-249: 5, 20-49: 2, 10-19: 4, 5-9: 4, 1-4: 5)
Health Care and Social Assistance: Offices of Physicians (except Mental Health Specialists) (100-249: 2, 50-99: 5, 20-49: 14, 10-19: 21, 5-9: 32, 1-4: 81)
Finance and Insurance: Mortgage and Nonmortgage Loan Brokers (500-999: 2, 50-99: 1, 20-49: 2, 10-19: 5, 5-9: 2, 1-4: 7)
Administrative and Support and Waste Management and Remediation Services: Security Guards and Patrol Services (500-999: 1, 250-499: 1, 100-249: 3, 20-49: 2)
Health Care and Social Assistance: Home Health Care Services (250-499: 1, 100-249: 4, 50-99: 1, 20-49: 1)
2005 - 2018 National Fire Incident Reporting System (NFIRS) incidents
According to the data from the years 2005 - 2018 the average number of fire incidents per year is 43. The highest number of fire incidents - 118 took place in 2006, and the least - 1 in 2015. The data has a declining trend.
When looking into fire subcategories, the most incidents belonged to: Outside Fires (34.8%), and Mobile Property/Vehicle Fires (32.9%).
Fire incident types reported to NFIRS in Zip Code 92868


 Nearest zip codes: 92706, 92866, 92867, 92701, 92865, 92806.


 According to the data from the years 2005 - 2018 the average number of fire incidents per year is 43. The highest number of fire incidents - 118 took place in 2006, and the least - 1 in 2015. The data has a declining trend.
 When looking into fire subcategories, the most incidents belonged to: Outside Fires (34.8%), and Mobile Property/Vehicle Fires (32.9%).