Estimated zip code population in 2022: 22,761 Zip code population in 2010: 19,582 Zip code population in 2000: 15,172
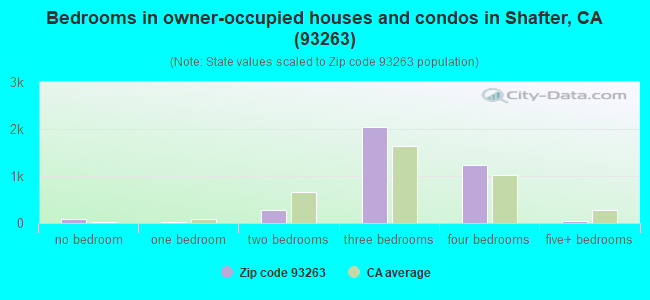
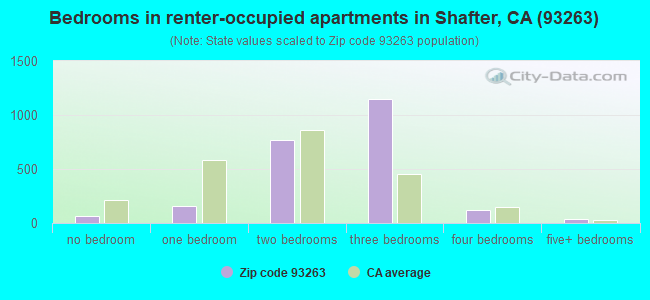
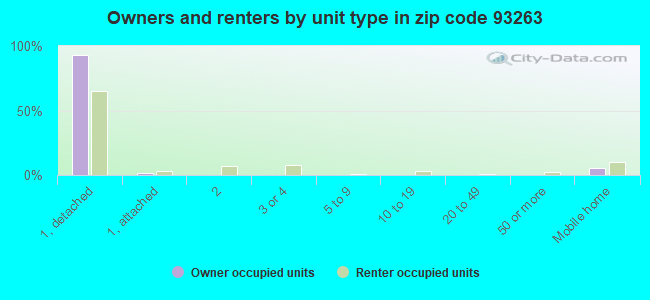
Houses and condos: 6,336 Renter-occupied apartments: 2,297
% of renters here:
38%
State:
44%
March 2022 cost of living index in zip code 93263: 91.0 (less than average, U.S. average is 100)
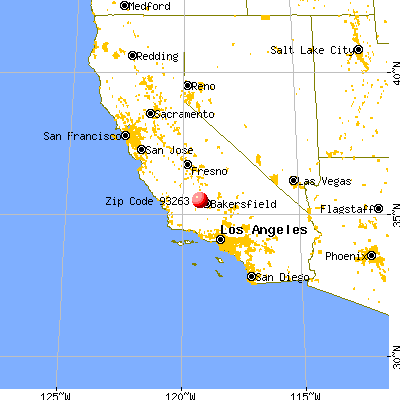
Land area: 90.6 sq. mi. Water area: 0.0 sq. mi.
Population density: 251 people per square mile
(very low).
OSM Map
General Map
Google Map
MSN Map
OSM Map
General Map
Google Map
MSN Map
OSM Map
General Map
Google Map
MSN Map
OSM Map
General Map
Google Map
MSN Map
Please wait while loading the map...
Real estate property taxes paid for housing units in 2022:
This zip code:
0.8% ($2,117)
California:
0.7% ($4,831)
Median real estate property taxes paid for housing units with mortgages in 2022: $2,553 (0.8%) Median real estate property taxes paid for housing units with no mortgage in 2022: $1,500 (0.7%)
Business Search- 14 Million verified businesses
Males: 11,256
(49.5%)
Females: 11,504
(50.5%)
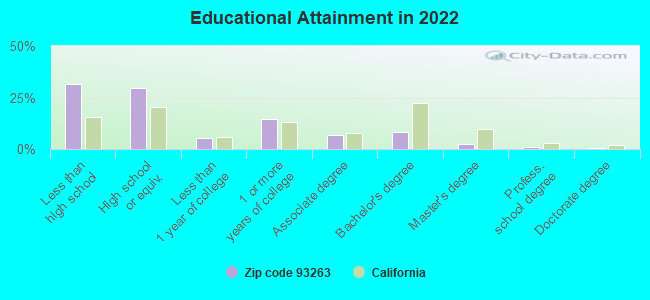
For population 25 years and over in 93263:
High school or higher: 67.2%
Bachelor's degree or higher: 11.8%
Graduate or professional degree: 3.7%
Unemployed: 6.5%
Mean travel time to work (commute): 21.3 minutes
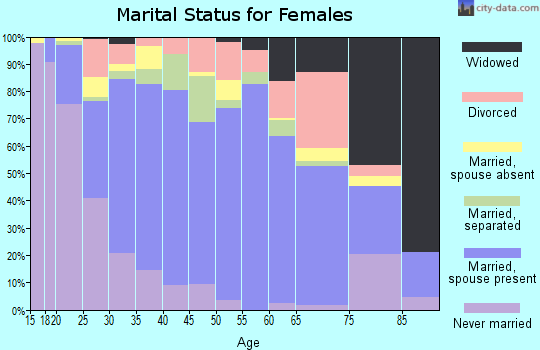
For population 15 years and over in 93263:
Never married: 42.4%
Now married: 46.8%
Separated: 1.7%
Widowed: 3.9%
Divorced: 5.2%
Zip code 93263 compared to state average:
Median house value significantly below state average.
Black race population percentage significantly below state average.
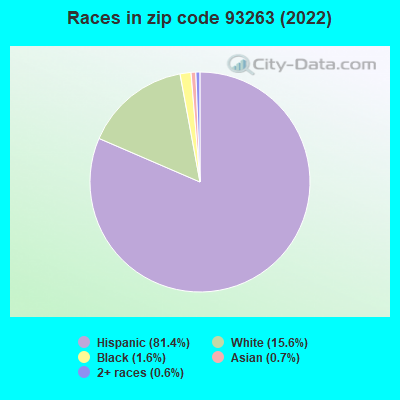
Hispanic race population percentage above state average.
Median age significantly below state average.
Percentage of population with a bachelor's degree or higher significantly below state average.
Estimated median house/condo value in 2022: $268,530
93263:
$268,530
California:
$715,900
According to our research of California and other state lists, there were 21 registered sex offenders living in 93263 zip code as of April 25, 2024. The ratio of all residents to sex offenders in zip code 93263 is 983 to 1. The ratio of registered sex offenders to all residents in this zip code is lower than the state average.
Median resident age:
This zip code:
28.1 years
California median age:
37.9 years
Average household size:
This zip code:
3.7 people
California:
2.8 people
Averages for the 2020 tax year for zip code 93263, filed in 2021:
Average Adjusted Gross Income (AGI) in 2020: $49,943 (Individual Income Tax Returns)
Here:
$49,943
State:
$95,910
Salary/wage: $42,843 (reported on 89.1% of returns)
Here:
$42,843
State:
$77,331
(% of AGI for various income ranges: 1413.8% for AGIs below $25k, 4151.1% for AGIs $25k-50k, 7749.8% for AGIs $50k-75k, 12146.7% for AGIs $75k-100k, 20020.6% for AGIs $100k-200k, 88820.0% for AGIs over 200k)
Taxable interest for individuals: $677 (reported on 20.9% of returns)
This zip code:
$677
California:
$2,294
(% of AGI for various income ranges: 3.3% for AGIs below $25k, 5.2% for AGIs $25k-50k, 7.7% for AGIs $50k-75k, 10.2% for AGIs $75k-100k, 88.0% for AGIs $100k-200k, 3120.0% for AGIs over 200k)
Ordinary dividends: $28,132 (reported on 3.9% of returns)
Here:
$28,132
State:
$10,949
(% of AGI for various income ranges: 2.2% for AGIs below $25k, 1.9% for AGIs $25k-50k, 10.3% for AGIs $50k-75k, 32.5% for AGIs $75k-100k, 143.8% for AGIs $100k-200k, 48140.0% for AGIs over 200k)
Net capital gain/loss in AGI: +$9,308 (reported on 5.3% of returns)
Here:
+$9,308
State:
+$49,306
(% of AGI for various income ranges: 2.5% for AGIs below $25k, 7.5% for AGIs $25k-50k, 22.7% for AGIs $50k-75k, 73.1% for AGIs $75k-100k, 390.8% for AGIs $100k-200k, 10065.0% for AGIs over 200k)
Profit/loss from business: +$10,146 (reported on 11.0% of returns)
Here:
+$10,146
State:
+$15,671
(% of AGI for various income ranges: 108.8% for AGIs below $25k, 147.0% for AGIs $25k-50k, 200.1% for AGIs $50k-75k, 166.5% for AGIs $75k-100k, 215.8% for AGIs $100k-200k, 7130.0% for AGIs over 200k)
Taxable individual retirement arrangement distribution: $15,395 (reported on 2.3% of returns)
93263:
$15,395
California:
$23,505
(% of AGI for various income ranges: 8.9% for AGIs below $25k, 26.3% for AGIs $25k-50k, 57.1% for AGIs $50k-75k, 107.3% for AGIs $75k-100k, 314.2% for AGIs $100k-200k)
Total itemized deductions: $28,616 (reported on 6.6% of returns)
Here:
$28,616
State:
$39,517
(% of AGI for various income ranges: 75.6% for AGIs $25k-50k, 337.2% for AGIs $50k-75k, 716.2% for AGIs $75k-100k, 1457.8% for AGIs $100k-200k, 14170.0% for AGIs over 200k)
Charity contributions: $7,858 (reported on 5.5% of returns)
Here:
$7,858
State:
$12,598
(% of AGI for various income ranges: 9.0% for AGIs $25k-50k, 39.6% for AGIs $50k-75k, 99.8% for AGIs $75k-100k, 314.8% for AGIs $100k-200k, 7760.0% for AGIs over 200k)
Taxes paid: $8,336 (reported on 6.6% of returns)
93263:
$8,336
State:
$8,807
(% of AGI for various income ranges: 19.2% for AGIs $25k-50k, 100.6% for AGIs $50k-75k, 237.7% for AGIs $75k-100k, 453.2% for AGIs $100k-200k, 2905.0% for AGIs over 200k)
Earned income credit: $2,502 (reported on 24.9% of returns)
Here:
$2,502
State:
$2,074
(% of AGI for various income ranges: 150.4% for AGIs below $25k, 116.8% for AGIs $25k-50k, 4.0% for AGIs $50k-75k)
Percentage of individuals using paid preparers for their 2020 taxes: 93.7%
Here:
94%
State:
92%
(% for various income ranges: 92.7% for AGIs below $25k, 93.4% for AGIs $25k-50k, 95.0% for AGIs $50k-75k, 94.9% for AGIs $75k-100k, 95.7% for AGIs $100k-200k, 91.7% for AGIs over 200k)
Averages for the 2012 tax year for zip code 93263, filed in 2013:
Average Adjusted Gross Income (AGI) in 2012: $42,249 (Individual Income Tax Returns)
Here:
$42,249
State:
$72,726
Salary/wage: $34,437 (reported on 91.0% of returns)
Here:
$34,437
State:
$59,079
(% of AGI for various income ranges: 81.7% for AGIs below $25k, 88.0% for AGIs $25k-50k, 86.8% for AGIs $50k-75k, 83.8% for AGIs $75k-100k, 76.9% for AGIs $100k-200k, 24.9% for AGIs over 200k)
Taxable interest for individuals: $1,190 (reported on 17.0% of returns)
This zip code:
$1,190
California:
$2,146
(% of AGI for various income ranges: 0.3% for AGIs below $25k, 0.2% for AGIs $25k-50k, 0.3% for AGIs $50k-75k, 0.2% for AGIs $75k-100k, 0.8% for AGIs $100k-200k, 1.1% for AGIs over 200k)
Ordinary dividends: $42,634 (reported on 4.0% of returns)
Here:
$42,634
State:
$9,308
(% of AGI for various income ranges: 0.2% for AGIs below $25k, 0.1% for AGIs $25k-50k, 0.3% for AGIs $50k-75k, 0.4% for AGIs $75k-100k, 0.9% for AGIs $100k-200k, 22.3% for AGIs over 200k)
Net capital gain/loss in AGI: +$6,281 (reported on 3.5% of returns)
Here:
+$6,281
State:
+$30,460
(% of AGI for various income ranges: 0.4% for AGIs $50k-75k, 0.1% for AGIs $75k-100k, 0.3% for AGIs $100k-200k, 2.4% for AGIs over 200k)
Profit/loss from business: +$12,736 (reported on 11.7% of returns)
Here:
+$12,736
State:
+$17,064
(% of AGI for various income ranges: 8.7% for AGIs below $25k, 3.2% for AGIs $25k-50k, 2.5% for AGIs $50k-75k, 1.6% for AGIs $75k-100k, 5.3% for AGIs $100k-200k)
Taxable individual retirement arrangement distribution: $9,815 (reported on 2.7% of returns)
93263:
$9,815
California:
$19,557
(% of AGI for various income ranges: 0.6% for AGIs below $25k, 0.5% for AGIs $25k-50k, 0.5% for AGIs $50k-75k, 0.9% for AGIs $75k-100k, 1.4% for AGIs $100k-200k)
Total itemized deductions: $24,824 (23% of AGI, reported on 19.1% of returns)
Here:
$24,824
State:
$34,004
Here:
23.3% of AGI
State:
22.7% of AGI
(% of AGI for various income ranges: 2.7% for AGIs below $25k, 6.2% for AGIs $25k-50k, 12.4% for AGIs $50k-75k, 16.0% for AGIs $75k-100k, 18.2% for AGIs $100k-200k, 15.5% for AGIs over 200k)
Charity contributions: $4,532 (reported on 15.8% of returns)
Here:
$4,532
State:
$4,659
(% of AGI for various income ranges: 0.3% for AGIs below $25k, 0.7% for AGIs $25k-50k, 1.3% for AGIs $50k-75k, 2.0% for AGIs $75k-100k, 3.2% for AGIs $100k-200k, 3.2% for AGIs over 200k)
Taxes paid: $8,381 (reported on 18.9% of returns)
93263:
$8,381
State:
$14,448
(% of AGI for various income ranges: 3.4% for AGIs below $25k, 1.2% for AGIs $25k-50k, 3.0% for AGIs $50k-75k, 4.2% for AGIs $75k-100k, 6.0% for AGIs $100k-200k, 6.1% for AGIs over 200k)
Earned income credit: $2,770 (reported on 34.1% of returns)
Here:
$2,770
State:
$2,286
(% of AGI for various income ranges: 11.0% for AGIs below $25k, 2.1% for AGIs $25k-50k)
Percentage of individuals using paid preparers for their 2012 taxes: 75.6%
Here:
76%
State:
64%
(% for various income ranges: 70.8% for AGIs below $25k, 80.2% for AGIs $25k-50k, 79.5% for AGIs $50k-75k, 80.0% for AGIs $75k-100k, 78.4% for AGIs $100k-200k, 87.5% for AGIs over 200k)
Averages for the 2004 tax year for zip code 93263, filed in 2005:
Average Adjusted Gross Income (AGI) in 2004: $30,659 (Individual Income Tax Returns)
Here:
$30,659
State:
$58,600
Salary/wage: $26,812 (reported on 90.9% of returns)
Here:
$26,812
State:
$49,455
(% of AGI for various income ranges: 154.5% for AGIs below $10k, 83.6% for AGIs $10k-25k, 87.1% for AGIs $25k-50k, 85.5% for AGIs $50k-75k, 79.0% for AGIs $75k-100k, 46.0% for AGIs over 100k)
Taxable interest for individuals: $1,639 (reported on 23.3% of returns)
This zip code:
$1,639
California:
$2,365
(% of AGI for various income ranges: 3.7% for AGIs below $10k, 0.6% for AGIs $10k-25k, 0.6% for AGIs $25k-50k, 1.0% for AGIs $50k-75k, 0.7% for AGIs $75k-100k, 3.3% for AGIs over 100k)
Taxable dividends: $2,154 (reported on 6.2% of returns)
Here:
$2,154
State:
$4,746
(% of AGI for various income ranges: 0.9% for AGIs below $10k, 0.2% for AGIs $10k-25k, 0.1% for AGIs $25k-50k, 0.3% for AGIs $50k-75k, 0.3% for AGIs $75k-100k, 1.4% for AGIs over 100k)
Net capital gain/loss: +$19,799 (reported on 5.9% of returns)
Here:
+$19,799
State:
+$23,418
(% of AGI for various income ranges: 2.4% for AGIs below $10k, 0.2% for AGIs $10k-25k, 0.6% for AGIs $25k-50k, 0.2% for AGIs $50k-75k, 2.1% for AGIs $75k-100k, 18.6% for AGIs over 100k)
Profit/loss from business: +$8,652 (reported on 10.7% of returns)
Here:
+$8,652
State:
+$16,826
(% of AGI for various income ranges: -5.1% for AGIs below $10k, 4.8% for AGIs $10k-25k, 4.2% for AGIs $25k-50k, 1.0% for AGIs $50k-75k, 1.9% for AGIs $75k-100k, 2.7% for AGIs over 100k)
Profit/loss from farming: +$4,613 (reported on 1.2% of returns)
Here:
+$4,613
State:
-$7,562
(% of AGI for various income ranges: 2.4% for AGIs below $10k, -0.1% for AGIs $10k-25k, 0.3% for AGIs $50k-75k, 0.5% for AGIs over 100k)
IRA payment deduction: $3,532 (reported on 1.5% of returns)
93263:
$3,532
California:
$3,192
(% of AGI for various income ranges: 0.1% for AGIs $10k-25k, 0.2% for AGIs $25k-50k, 0.4% for AGIs $50k-75k, 0.2% for AGIs over 100k)
Total itemized deductions: $17,500 (26% of AGI, reported on 20.9% of returns)
Here:
$17,500
State:
$28,113
Here:
25.9% of AGI
State:
25.3% of AGI
(% of AGI for various income ranges: 6.7% for AGIs below $10k, 4.0% for AGIs $10k-25k, 10.4% for AGIs $25k-50k, 17.0% for AGIs $50k-75k, 18.4% for AGIs $75k-100k, 15.1% for AGIs over 100k)
Charity contributions deductions: $3,374 (5% of AGI, reported on 19.1% of returns)
Here:
$3,374
State:
$3,923
Here:
4.8% of AGI
State:
3.3% of AGI
(% of AGI for various income ranges: 0.7% for AGIs below $10k, 0.5% for AGIs $10k-25k, 1.3% for AGIs $25k-50k, 2.7% for AGIs $50k-75k, 3.9% for AGIs $75k-100k, 3.7% for AGIs over 100k)
Total tax: $4,075 (reported on 52.4% of returns)
93263:
$4,075
State:
$10,761
(% of AGI for various income ranges: 4.1% for AGIs below $10k, 2.4% for AGIs $10k-25k, 3.9% for AGIs $25k-50k, 6.3% for AGIs $50k-75k, 9.8% for AGIs $75k-100k, 16.8% for AGIs over 100k)
Earned income credit: $2,067 (reported on 38.2% of returns)
Here:
$2,067
State:
$1,763
Percentage of individuals using paid preparers for their 2004 taxes: 79.2%
Here:
79%
State:
66%
(% for various income ranges: 73.4% for AGIs below $10k, 81.9% for AGIs $10k-25k, 80.9% for AGIs $25k-50k, 77.0% for AGIs $50k-75k, 77.9% for AGIs $75k-100k, 81.3% for AGIs over 100k)
Household received Food Stamps/SNAP in the past 12 months: 1,334 Household did not receive Food Stamps/SNAP in the past 12 months: 4,804
Women who had a birth in the past 12 months: 490 (327 now married, 164 unmarried) Women who did not have a birth in the past 12 months: 5,767 (2,338 now married, 3,426 unmarried)
Housing units in zip code 93263 with a mortgage: 2,451 (74 second mortgage, 67 both second mortgage and home equity loan) Houses without a mortgage: 17
Median monthly owner costs for units with a mortgage: $1,678 Median monthly owner costs for units without a mortgage: $459
Residents with income below the poverty level in 2022:
This zip code:
24.2%
Whole state:
12.2%
Residents with income below 50% of the poverty level in 2022:
This zip code:
15.4%
Whole state:
6.2%
Median number of rooms in houses and condos:
Here:
5.6
State:
6.0
Median number of rooms in apartments:
Here:
4.7
State:
3.9
Notable locations in this zip code not listed on our city pages
Notable locations in zip code 93263: Arkelo Ranch (A), Aukeman Dairy (B), Oasis Holsteins Dairy (C), Shafter High School Farm (D), Kern County Fire Department Station 32 Shafter (E), Shafter Branch Kern County Library (F), Richland School District Office (G), Depot Museum (H). Display/hide their locations on the map
Churches in zip code 93263 include: Bible Truth Tabernacle (A), Church of Christ (B), Congregational Church of Shafter (C), Ebenezer Reformed Church (D), First Assembly of God Church (E), First Southern Baptist Church (F), Kingdom Hall of Jehovahs Witnesses (G), Mennonite Brethren Church (H), Saint Marks Episcopal Church (I). Display/hide their locations on the map
In group quarters: 722 (-1 institutionalized population)
Size of family households: 1,008 2-persons, 1,209 3-persons, 1,132 4-persons, 821 5-persons, 547 6-persons, 238 7-or-more-persons
Size of nonfamily households: 840 1-person, 119 2-persons, 37 3-persons
3,998 married couples with children.
2,284 single-parent households (1,047 men, 1,237 women).
37.9% of residents of 93263 zip code speak English at home.
59.8% of residents speak Spanish at home (48% very well, 29% well, 13% not well, 9% not at all).
0.2% of residents speak other Indo-European language at home (100% very well).
0.2% of residents speak Asian or Pacific Island language at home (88% very well, 12% well).
1.8% of residents speak other language at home (76% very well, 18% well, 6% not well).
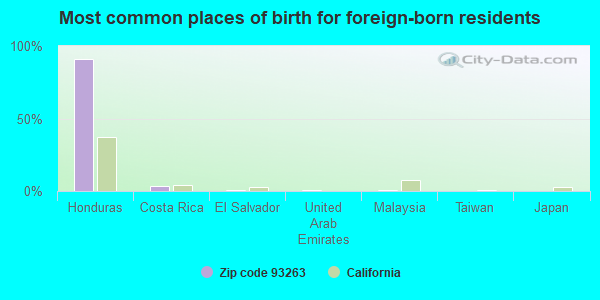
Foreign born population: 5,884 (25.9%) (25.7% of them are naturalized citizens)
This zip code:
25.9%
Whole state:
26.7%
91%Honduras
3%Costa Rica
1%El Salvador
1%United Arab Emirates
1%Malaysia
0%Taiwan
0%Japan
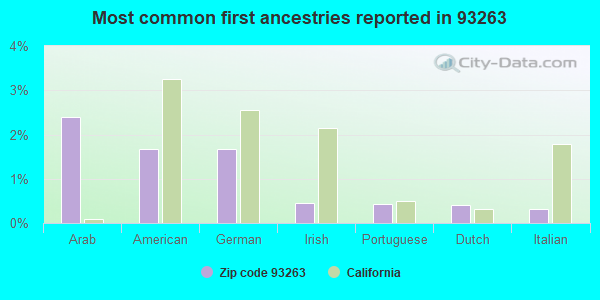
2%Arab
2%American
2%German
0%Irish
0%Portuguese
0%Dutch
0%Italian
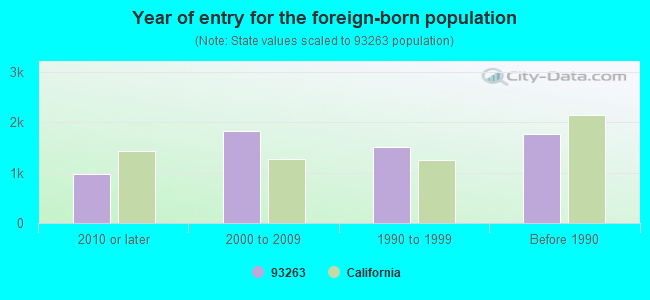
Year of entry for the foreign-born population
9832010 or later
1,8272000 to 2009
1,5171990 to 1999
1,761Before 1990
Major facilities with environmental interests located in this zip code:
CENTRAL VALLEY CONT HIGH (526 MANNEL AVE. in SHAFTER, CA)
(National Center for Education Statistics) - STATE ID-1530021 (National Center for Education Statistics) - STATE ID-1535087 Organizations: KERN UNION HIGH (SCHOOL DISTRICT)
CHEVRONTEXACO E AND P CO (30565 MERCED AVE in SHAFTER, CA)
STATE MASTER (California - Hazardous Waste Tracking) - HAZARDOU WASTE PROGRAM Large Quantity Generators, more that 1000 kg of hazardous waste/month (Resource Conservation and Recovery Act (tracking hazardous waste))
HOLIDAY FORD LINC MERC SHAFTER (1100 E LERDO HWY in SHAFTER, CA)
STATE MASTER (California - Hazardous Waste Tracking) - HAZARDOU WASTE PROGRAM Small Quantity Generators, between 100 kg and 1000 kg of hazardous waste/month (Resource Conservation and Recovery Act (tracking hazardous waste)) - notification Organizations: SHAFTER FORD LINCOLN MERCURY (CONTACT/OWNER)
GOLDEN OAK ELEMENTARY (190 S. WALL in SHAFTER, CA)
(National Center for Education Statistics) - STATE ID-6090591 Organizations: RICHLAND SCHOOL DISTRICT (SCHOOL DISTRICT)
MAPLE ELEMENTARY (29161 FRESNO AVE. in SHAFTER, CA)
(National Center for Education Statistics) - STATE ID-6009732
ELK CORPORATION OF TEXAS -SHAFTER (6200 ZERKER ROAD in SHAFTER, CA)
CRITERIA AND HAZARDOUS AIR POLLUTANT INVENTORY (Inventory of air pollution sources) AIR MAJOR ("Best Available" air pollution technologies tracking) Small Quantity Generators, between 100 kg and 1000 kg of hazardous waste/month (Resource Conservation and Recovery Act (tracking hazardous waste)) - notification TRI REPORTER (Tracking of toxic chemicals releasing facilities) Business SIC classification: ASPHALT FELTS AND COATINGS Organizations: ELK CORP TEXAS (CONTACT/OWNER)
Alternative names: ELK CORP OF TEXAS
LONE STAR GAS PLANT (19430 BEECH AVENUE in SHAFTER, CA)
AIR SYNTHETIC MINOR (AIRS/AFS) CRITERIA AND HAZARDOUS AIR POLLUTANT INVENTORY (Inventory of air pollution sources) AIR MAJOR ("Best Available" air pollution technologies tracking) Business SIC classification: NATURAL GAS LIQUIDS Business NAICS classification: NATURAL GAS LIQUID EXTRACTION. Alternative names: LONE STAR GAS LIQUIDS, LONE STAR GAS LIQUIDS PROCESSING INCORPORATED, LONE STAR GAS LIQUIDS PROCESSING, INC, LONE STAR GAS LIQUIDS PROCESSING, INC.
NEELEY TRUCKING (738 W FRESNO AVE in SHAFTER, CA)
TRANSPORTER (Resource Conservation and Recovery Act (tracking hazardous waste)) Organizations: ALBERT L NEELEY (CONTACT/OWNER)
NILLEL EQUIP CO INC (184 CENTRAL AVE in SHAFTER, CA)
Small Quantity Generators, between 100 kg and 1000 kg of hazardous waste/month (Resource Conservation and Recovery Act (tracking hazardous waste)) - notification Business NAICS classification: ALL OTHER MISCELLANEOUS STORE RETAILERS (EXCEPT TOBACCO STORES). Organizations: JAMES D SELF (CONTACT/OWNER)
FAMOSA VINEYARDS (34583 FAMOSA WOODY RD in SHAFTER, CA)
Small Quantity Generators, between 100 kg and 1000 kg of hazardous waste/month (Resource Conservation and Recovery Act (tracking hazardous waste)) - notification Organizations: LUCICH FARMS (CONTACT/OWNER)
GAF MATERIALS CORP (6505 ZERKER ROAD in SHAFTER, CA)
CRITERIA AND HAZARDOUS AIR POLLUTANT INVENTORY (Inventory of air pollution sources) TRI REPORTER (Tracking of toxic chemicals releasing facilities) Business SIC classification: PRESSED AND BLOWN GLASS AND GLASSWARE Alternative names: BUILDING MATERIALS CORP.(DBA GAF MATERIALS CORP.), GAF BUILDING MATERIALS
GARLIC CO GARLIC SEED TRTMT (30710 SAN DIEGO ST in SHAFTER, CA)
Small Quantity Generators, between 100 kg and 1000 kg of hazardous waste/month (Resource Conservation and Recovery Act (tracking hazardous waste))
EOTT ENERGY OPERATING LTD (ROGAS UNLOADING FACILITY - S.STOCKDALE E/O ENOS in SHAFTER, CA)
CRITERIA AND HAZARDOUS AIR POLLUTANT INVENTORY (Inventory of air pollution sources) Business SIC classification: NATURAL GAS LIQUIDS
Housing units lacking complete plumbing facilities: 2.9% Housing units lacking complete kitchen facilities: 1.6%
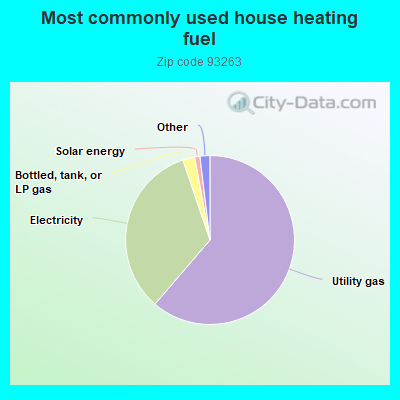
61.3%Utility gas
33.5%Electricity
2.3%Bottled, tank, or LP gas
1.0%Solar energy
0.9%No fuel used
0.8%Other fuel
Population in 1990: 12,270. Population change in the 1990s: +2,902 (+23.7%).
Place of birth for U.S.-born residents:
This state: 15,315
Northeast: 140
Midwest: 225
South: 843
West: 163
47% of the 93263 zip code residents lived in the same house 5 years ago. Out of people who lived in different houses, 83% lived in this county. Out of people who lived in different counties, 50% lived in California.
94% of the 93263 zip code residents lived in the same house 1 year ago. Out of people who lived in different houses, 53% moved from this county. Out of people who lived in different houses, 31% moved from different county within same state. Out of people who lived in different houses, 18% moved from different state. Out of people who lived in different houses, 2% moved from abroad.
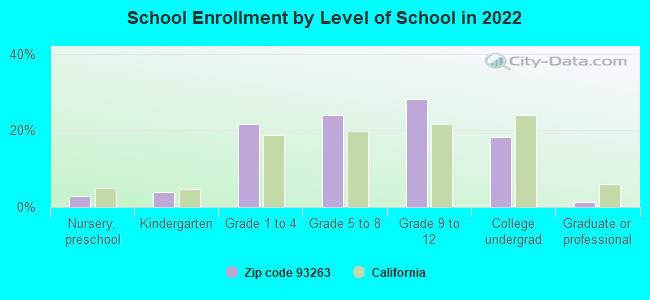
Private vs. public school enrollment:
Students in private schools in grades 1 to 8 (elementary and middle school): 92
Here:
2.6%
California:
10.5%
Students in private schools in grades 9 to 12 (high school): 62
Here:
2.8%
California:
8.5%
Students in private undergraduate colleges: 407
Here:
28.0%
California:
15.9%
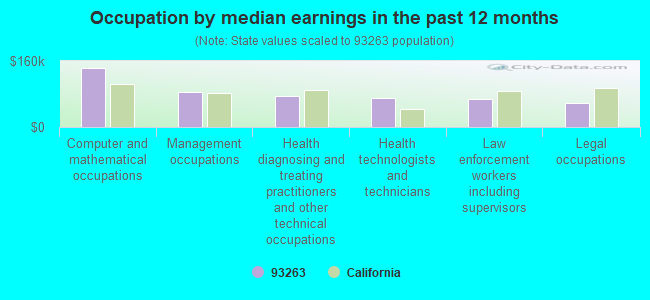
Occupation by median earnings in the past 12 months ($)
143,209Computer and mathematical occupations
85,395Management occupations
75,135Health diagnosing and treating practitioners and other technical occupations
69,313Health technologists and technicians
68,712Law enforcement workers including supervisors
58,394Legal occupations
Companies with federal contracts located in this zip code:
GF KERN-TEK INC (720 COMMERCE WAY in SHAFTER, CA; small business) : $92,916 in 4 contractsfrom 2004 to 2005
$47,936 with Defense Logistics Agency for Vehicular Cab, Body, and Frame Structural Components. Signed on 2004-11-05. Completion date: 2005-11-05.
$22,950 with Defense Logistics Agency for Aircraft Ground Servicing Equipment. Signed on 2004-10-09. Completion date: 2005-01-12.
$19,040 with Defense Logistics Agency for Vehicular Cab, Body, and Frame Structural Components. Signed on 2005-11-23. Completion date: 2006-01-07.
$2,990 with Defense Logistics Agency for Aircraft Ground Servicing Equipment. Signed on 2005-04-08. Completion date: 2005-05-06.
Top industries in this zip code by the number of employees in 2005:
Construction: Water and Sewer Line and Related Structures Construction (50-99 employees: 1 establishment)
Construction: New Single-Family Housing Construction (except Operative Builders) (20-49: 2, 1-4: 3)
Health Care and Social Assistance: Nursing Care Facilities (50-99: 1)
People in group quarters in 2010:
517 people in correctional residential facilities
86 people in residential treatment centers for adults
48 people in group homes intended for adults
14 people in workers' group living quarters and job corps centers
People in group quarters in 2000:
461 people in local jails and other confinement facilities (including police lockups)
80 people in nursing homes
53 people in agriculture workers' dormitories on farms
28 people in homes for the physically handicapped
25 people in homes for the mentally retarded
20 people in homes or halfway houses for drug/alcohol abuse
Fatal accident statistics in 2014:
Fatal accident count: 1
Vehicles involved in fatal accidents: 1
Fatal accidents caused by drunken drivers: 0
Fatalities: 1
Persons involved in fatal accidents: 1
Pedestrians involved in fatal accidents: 0
Fatal accident statistics in 2013:
Fatal accident count: 5
Vehicles involved in fatal accidents: 8
Fatal accidents caused by drunken drivers: 3
Fatalities: 5
Persons involved in fatal accidents: 10
Pedestrians involved in fatal accidents: 0
Home Mortgage Disclosure Act Aggregated Statistics For Year 2009 (Based on 3 full and 4 partial tracts)
A) FHA, FSA/RHS & VA Home Purchase Loans
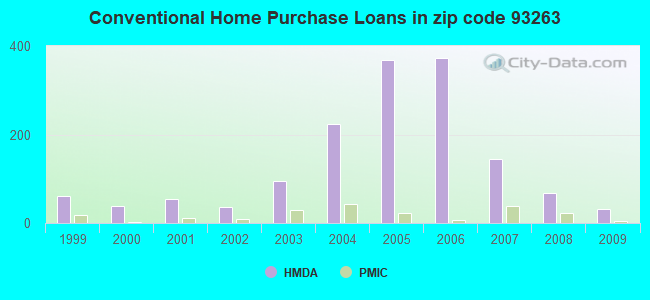
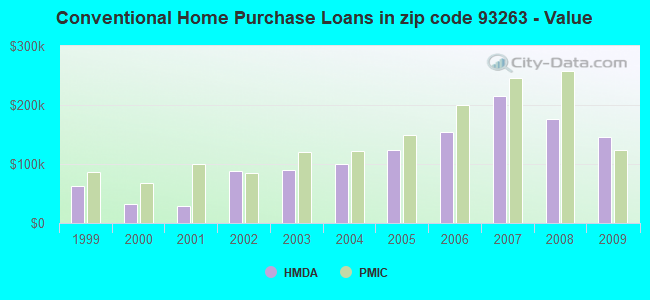
B) Conventional Home Purchase Loans
C) Refinancings
D) Home Improvement Loans
F) Non-occupant Loans on < 5 Family Dwellings (A B C & D)
G) Loans On Manufactured Home Dwelling (A B C & D)
Number
Average Value
Number
Average Value
Number
Average Value
Number
Average Value
Number
Average Value
Number
Average Value
LOANS ORIGINATED
102
$158,686
31
$145,384
75
$175,644
5
$81,014
14
$143,496
0
$0
APPLICATIONS APPROVED, NOT ACCEPTED
14
$195,938
1
$252,000
7
$137,429
3
$56,293
0
$0
0
$0
APPLICATIONS DENIED
13
$155,913
7
$83,143
65
$157,756
10
$39,542
6
$84,000
2
$53,500
APPLICATIONS WITHDRAWN
18
$137,778
5
$171,410
25
$165,717
1
$150,000
6
$106,500
0
$0
FILES CLOSED FOR INCOMPLETENESS
0
$0
2
$87,000
7
$218,100
0
$0
1
$94,000
0
$0
Aggregated Statistics For Year 2008 (Based on 3 full and 4 partial tracts)
A) FHA, FSA/RHS & VA Home Purchase Loans
B) Conventional Home Purchase Loans
C) Refinancings
D) Home Improvement Loans
E) Loans on Dwellings For 5+ Families
F) Non-occupant Loans on < 5 Family Dwellings (A B C & D)
G) Loans On Manufactured Home Dwelling (A B C & D)
Number
Average Value
Number
Average Value
Number
Average Value
Number
Average Value
Number
Average Value
Number
Average Value
Number
Average Value
LOANS ORIGINATED
69
$195,954
67
$176,701
106
$158,598
24
$74,667
2
$706,000
26
$102,269
2
$29,000
APPLICATIONS APPROVED, NOT ACCEPTED
4
$198,875
14
$235,971
33
$171,909
7
$112,000
0
$0
7
$187,847
2
$67,300
APPLICATIONS DENIED
11
$211,091
38
$186,076
159
$189,725
32
$67,622
0
$0
24
$149,083
4
$37,250
APPLICATIONS WITHDRAWN
16
$217,562
24
$201,827
53
$164,118
9
$47,052
0
$0
15
$133,498
4
$103,948
FILES CLOSED FOR INCOMPLETENESS
2
$261,500
1
$248,000
7
$214,714
2
$105,000
0
$0
2
$108,000
0
$0
Aggregated Statistics For Year 2007 (Based on 3 full and 4 partial tracts)
A) FHA, FSA/RHS & VA Home Purchase Loans
B) Conventional Home Purchase Loans
C) Refinancings
D) Home Improvement Loans
F) Non-occupant Loans on < 5 Family Dwellings (A B C & D)
G) Loans On Manufactured Home Dwelling (A B C & D)
Number
Average Value
Number
Average Value
Number
Average Value
Number
Average Value
Number
Average Value
Number
Average Value
LOANS ORIGINATED
7
$206,057
145
$215,037
335
$171,379
60
$96,407
64
$169,848
0
$0
APPLICATIONS APPROVED, NOT ACCEPTED
0
$0
40
$206,671
85
$176,449
12
$43,954
6
$154,000
1
$36,000
APPLICATIONS DENIED
4
$194,500
79
$197,674
325
$192,864
58
$97,652
36
$171,760
7
$122,806
APPLICATIONS WITHDRAWN
3
$262,333
27
$179,319
143
$183,267
11
$164,818
18
$166,199
0
$0
FILES CLOSED FOR INCOMPLETENESS
0
$0
8
$222,732
41
$222,033
5
$153,700
3
$313,120
0
$0
Aggregated Statistics For Year 2006 (Based on 3 full and 4 partial tracts)
A) FHA, FSA/RHS & VA Home Purchase Loans
B) Conventional Home Purchase Loans
C) Refinancings
D) Home Improvement Loans
E) Loans on Dwellings For 5+ Families
F) Non-occupant Loans on < 5 Family Dwellings (A B C & D)
G) Loans On Manufactured Home Dwelling (A B C & D)
Number
Average Value
Number
Average Value
Number
Average Value
Number
Average Value
Number
Average Value
Number
Average Value
Number
Average Value
LOANS ORIGINATED
9
$205,207
372
$153,815
542
$163,156
92
$88,485
1
$500,000
67
$136,070
4
$58,422
APPLICATIONS APPROVED, NOT ACCEPTED
0
$0
67
$163,135
112
$154,009
16
$107,338
0
$0
19
$153,487
3
$70,520
APPLICATIONS DENIED
0
$0
151
$155,755
311
$172,397
75
$88,401
0
$0
43
$150,856
4
$130,450
APPLICATIONS WITHDRAWN
2
$246,000
70
$165,139
260
$162,887
21
$114,952
0
$0
17
$142,000
1
$110,000
FILES CLOSED FOR INCOMPLETENESS
0
$0
21
$165,520
61
$161,295
3
$195,333
0
$0
2
$150,500
0
$0
Aggregated Statistics For Year 2005 (Based on 3 full and 4 partial tracts)
A) FHA, FSA/RHS & VA Home Purchase Loans
B) Conventional Home Purchase Loans
C) Refinancings
D) Home Improvement Loans
F) Non-occupant Loans on < 5 Family Dwellings (A B C & D)
G) Loans On Manufactured Home Dwelling (A B C & D)
Number
Average Value
Number
Average Value
Number
Average Value
Number
Average Value
Number
Average Value
Number
Average Value
LOANS ORIGINATED
7
$130,201
369
$123,367
627
$133,974
59
$101,926
87
$131,385
1
$24,000
APPLICATIONS APPROVED, NOT ACCEPTED
3
$93,533
42
$108,073
107
$122,491
17
$95,059
16
$126,900
1
$30,240
APPLICATIONS DENIED
2
$132,385
121
$135,872
371
$129,594
72
$89,682
40
$129,419
1
$50,000
APPLICATIONS WITHDRAWN
1
$110,000
65
$111,097
329
$129,734
37
$132,254
27
$98,250
2
$27,500
FILES CLOSED FOR INCOMPLETENESS
0
$0
15
$147,217
74
$131,030
4
$61,835
6
$123,333
0
$0
Aggregated Statistics For Year 2004 (Based on 3 full and 4 partial tracts)
A) FHA, FSA/RHS & VA Home Purchase Loans
B) Conventional Home Purchase Loans
C) Refinancings
D) Home Improvement Loans
E) Loans on Dwellings For 5+ Families
F) Non-occupant Loans on < 5 Family Dwellings (A B C & D)
G) Loans On Manufactured Home Dwelling (A B C & D)
Number
Average Value
Number
Average Value
Number
Average Value
Number
Average Value
Number
Average Value
Number
Average Value
Number
Average Value
LOANS ORIGINATED
50
$112,621
224
$100,659
381
$99,249
35
$61,570
1
$582,000
69
$80,469
0
$0
APPLICATIONS APPROVED, NOT ACCEPTED
1
$118,000
42
$114,478
98
$101,001
11
$85,298
1
$187,000
17
$68,712
1
$28,000
APPLICATIONS DENIED
4
$110,750
66
$94,249
347
$93,289
69
$54,304
1
$240,000
37
$91,351
2
$50,500
APPLICATIONS WITHDRAWN
3
$98,000
41
$92,220
262
$97,175
14
$62,331
0
$0
23
$71,046
1
$81,000
FILES CLOSED FOR INCOMPLETENESS
1
$120,000
7
$112,143
39
$91,055
2
$30,875
0
$0
6
$85,087
0
$0
Aggregated Statistics For Year 2003 (Based on 3 full and 4 partial tracts)
A) FHA, FSA/RHS & VA Home Purchase Loans
B) Conventional Home Purchase Loans
C) Refinancings
D) Home Improvement Loans
F) Non-occupant Loans on < 5 Family Dwellings (A B C & D)
Number
Average Value
Number
Average Value
Number
Average Value
Number
Average Value
Number
Average Value
LOANS ORIGINATED
68
$90,585
95
$89,333
353
$89,144
14
$55,803
45
$63,340
APPLICATIONS APPROVED, NOT ACCEPTED
3
$109,667
19
$114,625
70
$89,273
8
$42,125
7
$82,263
APPLICATIONS DENIED
9
$67,919
40
$79,420
296
$88,266
28
$31,073
23
$61,181
APPLICATIONS WITHDRAWN
3
$53,593
9
$94,433
159
$90,918
2
$18,000
9
$71,349
FILES CLOSED FOR INCOMPLETENESS
2
$39,500
2
$323,590
25
$103,560
2
$27,000
1
$68,000
Aggregated Statistics For Year 2002 (Based on 1 full and 4 partial tracts)
A) FHA, FSA/RHS & VA Home Purchase Loans
B) Conventional Home Purchase Loans
C) Refinancings
D) Home Improvement Loans
F) Non-occupant Loans on < 5 Family Dwellings (A B C & D)
Number
Average Value
Number
Average Value
Number
Average Value
Number
Average Value
Number
Average Value
LOANS ORIGINATED
48
$93,816
36
$88,005
81
$86,780
7
$17,016
10
$55,095
APPLICATIONS APPROVED, NOT ACCEPTED
6
$92,333
3
$88,637
20
$78,738
0
$0
1
$75,590
APPLICATIONS DENIED
6
$89,262
8
$115,375
74
$81,459
6
$21,500
4
$30,520
APPLICATIONS WITHDRAWN
5
$62,400
5
$91,126
34
$78,066
2
$22,500
0
$0
FILES CLOSED FOR INCOMPLETENESS
1
$82,000
1
$34,000
6
$93,853
0
$0
2
$57,000
Aggregated Statistics For Year 2001 (Based on 1 full and 4 partial tracts)
A) FHA, FSA/RHS & VA Home Purchase Loans
B) Conventional Home Purchase Loans
C) Refinancings
D) Home Improvement Loans
F) Non-occupant Loans on < 5 Family Dwellings (A B C & D)
Number
Average Value
Number
Average Value
Number
Average Value
Number
Average Value
Number
Average Value
LOANS ORIGINATED
49
$92,420
54
$28,188
132
$62,658
26
$27,026
112
$51,203
APPLICATIONS APPROVED, NOT ACCEPTED
1
$101,000
3
$78,237
2
$36,695
2
$4,745
2
$48,570
APPLICATIONS DENIED
0
$0
11
$104,663
59
$58,609
12
$18,874
3
$57,400
APPLICATIONS WITHDRAWN
12
$78,083
12
$79,755
55
$86,725
6
$15,253
0
$0
FILES CLOSED FOR INCOMPLETENESS
0
$0
1
$36,050
8
$81,198
2
$42,500
1
$36,050
Aggregated Statistics For Year 2000 (Based on 1 full and 4 partial tracts)
A) FHA, FSA/RHS & VA Home Purchase Loans
B) Conventional Home Purchase Loans
C) Refinancings
D) Home Improvement Loans
F) Non-occupant Loans on < 5 Family Dwellings (A B C & D)
Number
Average Value
Number
Average Value
Number
Average Value
Number
Average Value
Number
Average Value
LOANS ORIGINATED
36
$82,775
38
$32,974
28
$79,834
5
$22,878
5
$42,800
APPLICATIONS APPROVED, NOT ACCEPTED
1
$118,000
2
$42,500
6
$55,432
3
$15,000
3
$50,780
APPLICATIONS DENIED
1
$124,000
9
$93,672
53
$45,848
7
$43,857
6
$33,000
APPLICATIONS WITHDRAWN
5
$62,262
2
$41,625
20
$44,176
1
$30,000
3
$34,333
FILES CLOSED FOR INCOMPLETENESS
0
$0
2
$105,000
8
$51,542
1
$58,150
2
$37,500
Aggregated Statistics For Year 1999 (Based on 3 full and 2 partial tracts)
A) FHA, FSA/RHS & VA Home Purchase Loans
B) Conventional Home Purchase Loans
C) Refinancings
D) Home Improvement Loans
E) Loans on Dwellings For 5+ Families
F) Non-occupant Loans on < 5 Family Dwellings (A B C & D)
2002 - 2018 National Fire Incident Reporting System (NFIRS) incidents
Based on the data from the years 2002 - 2018 the average number of fires per year is 70. The highest number of fire incidents - 151 took place in 2006, and the least - 0 in 2003. The data has a growing trend.
When looking into fire subcategories, the most reports belonged to: Outside Fires (42.1%), and Structure Fires (33.1%).
Fire incident types reported to NFIRS in Zip Code 93263


+$4,613
-$7,562
(% of AGI for various income ranges: 2.4% for AGIs below $10k, -0.1% for AGIs $10k-25k, 0.3% for AGIs $50k-75k, 0.5% for AGIs over 100k)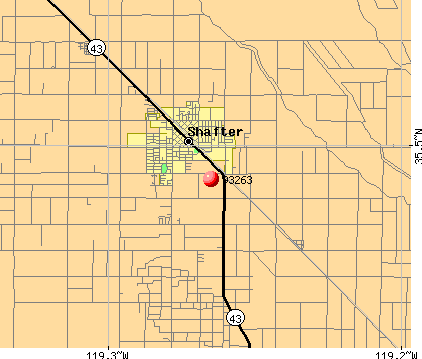 Nearest zip codes: 93314, 93312, 93250, 93206, 93276, 93280.


 Based on the data from the years 2002 - 2018 the average number of fires per year is 70. The highest number of fire incidents - 151 took place in 2006, and the least - 0 in 2003. The data has a growing trend.
 When looking into fire subcategories, the most reports belonged to: Outside Fires (42.1%), and Structure Fires (33.1%).