Estimated zip code population in 2022: 1,719 Zip code population in 2010: 2,387 Zip code population in 2000: 2,196
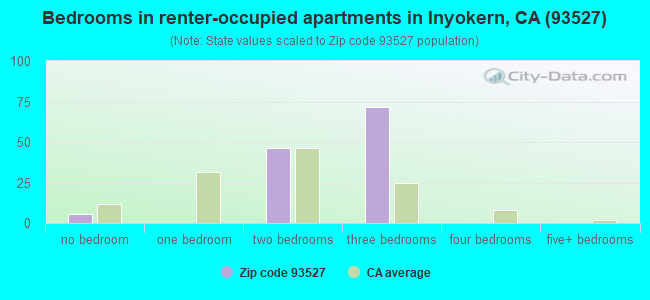
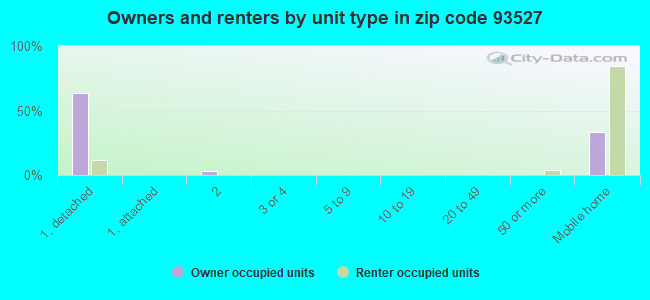
Houses and condos: 1,101 Renter-occupied apartments: 123
% of renters here:
15%
State:
44%
March 2022 cost of living index in zip code 93527: 93.0 (less than average, U.S. average is 100)
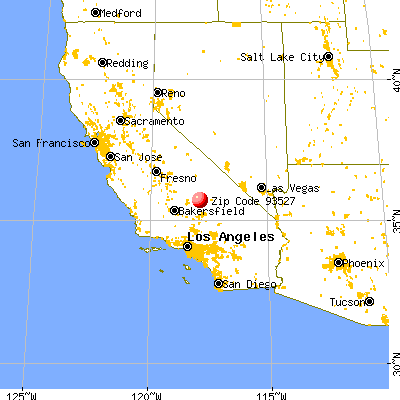
Land area: 545.3 sq. mi. Water area: 0.2 sq. mi.
Population density: 3 people per square mile
(very low).
OSM Map
General Map
Google Map
MSN Map
OSM Map
General Map
Google Map
MSN Map
OSM Map
General Map
Google Map
MSN Map
OSM Map
General Map
Google Map
MSN Map
Please wait while loading the map...
Real estate property taxes paid for housing units in 2022:
This zip code:
0.6% ($1,911)
California:
0.7% ($4,831)
Median real estate property taxes paid for housing units with mortgages in 2022: $2,538 (0.7%) Median real estate property taxes paid for housing units with no mortgage in 2022: $1,607 (0.8%)
Business Search- 14 Million verified businesses
Males: 631
(36.7%)
Females: 1,088
(63.3%)
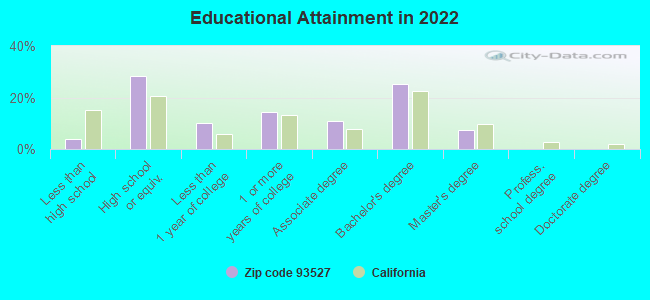
For population 25 years and over in 93527:
High school or higher: 96.0%
Bachelor's degree or higher: 32.6%
Graduate or professional degree: 7.5%
Unemployed: 11.7%
Mean travel time to work (commute): 28.8 minutes
For population 15 years and over in 93527:
Never married: 22.5%
Now married: 42.1%
Separated: 2.3%
Widowed: 9.8%
Divorced: 23.3%
Zip code 93527 compared to state average:
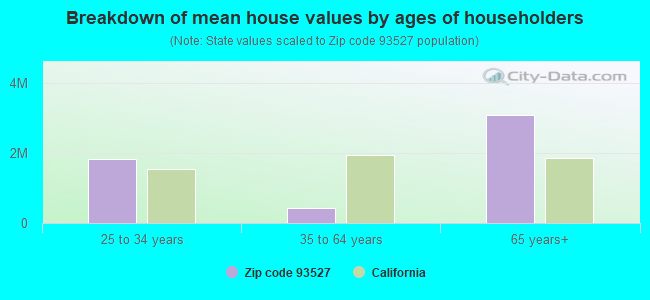
Median house value significantly below state average.
Unemployed percentage above state average.
Black race population percentage significantly below state average.
Hispanic race population percentage significantly below state average.
Median age significantly above state average.
Foreign-born population percentage significantly below state average.
Renting percentage significantly below state average.
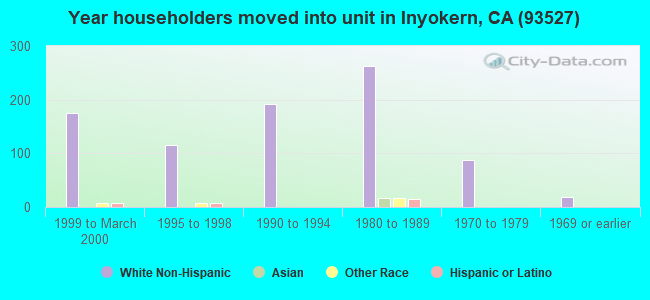
Length of stay since moving in significantly below state average.
Averages for the 2020 tax year for zip code 93527, filed in 2021:
Average Adjusted Gross Income (AGI) in 2020: $66,003 (Individual Income Tax Returns)
Here:
$66,003
State:
$95,910
Salary/wage: $62,619 (reported on 67.7% of returns)
Here:
$62,619
State:
$77,331
(% of AGI for various income ranges: 951.1% for AGIs below $25k, 3174.7% for AGIs $25k-50k, 5250.0% for AGIs $50k-75k, 8201.4% for AGIs $75k-100k, 13685.4% for AGIs $100k-200k)
Taxable interest for individuals: $897 (reported on 38.7% of returns)
This zip code:
$897
California:
$2,294
(% of AGI for various income ranges: 2.8% for AGIs below $25k, 13.3% for AGIs $25k-50k, 10.0% for AGIs $50k-75k, 42.9% for AGIs $75k-100k, 185.4% for AGIs $100k-200k)
Ordinary dividends: $2,725 (reported on 12.9% of returns)
Here:
$2,725
State:
$10,949
(% of AGI for various income ranges: 11.1% for AGIs below $25k, 62.0% for AGIs $50k-75k, 188.5% for AGIs $100k-200k)
Net capital gain/loss in AGI: +$5,981 (reported on 17.2% of returns)
Here:
+$5,981
State:
+$49,306
(% of AGI for various income ranges: 68.6% for AGIs $75k-100k, 720.8% for AGIs $100k-200k)
Profit/loss from business: +$2,771 (reported on 15.1% of returns)
Here:
+$2,771
State:
+$15,671
(% of AGI for various income ranges: 84.4% for AGIs below $25k, 63.3% for AGIs $25k-50k, 35.0% for AGIs $50k-75k, 81.5% for AGIs $100k-200k)
Taxable individual retirement arrangement distribution: $21,538 (reported on 8.6% of returns)
93527:
$21,538
California:
$23,505
(% of AGI for various income ranges: 146.1% for AGIs below $25k, 542.0% for AGIs $50k-75k, 706.2% for AGIs $100k-200k)
Total itemized deductions: $25,000 (reported on 10.8% of returns)
Here:
$25,000
State:
$39,517
(% of AGI for various income ranges: 1002.0% for AGIs $50k-75k, 1152.3% for AGIs $100k-200k)
Charity contributions: $5,738 (reported on 8.6% of returns)
Here:
$5,738
State:
$12,598
(% of AGI for various income ranges: 124.0% for AGIs $50k-75k, 257.7% for AGIs $100k-200k)
Taxes paid: $8,067 (reported on 9.7% of returns)
93527:
$8,067
State:
$8,807
(% of AGI for various income ranges: 246.0% for AGIs $50k-75k, 369.2% for AGIs $100k-200k)
Earned income credit: $2,167 (reported on 16.1% of returns)
Here:
$2,167
State:
$2,074
(% of AGI for various income ranges: 118.9% for AGIs below $25k, 74.0% for AGIs $25k-50k)
Percentage of individuals using paid preparers for their 2020 taxes: 94.6%
Here:
95%
State:
92%
(% for various income ranges: 92.9% for AGIs below $25k, 94.7% for AGIs $25k-50k, 100.0% for AGIs $50k-75k, 100.0% for AGIs $75k-100k, 90.0% for AGIs $100k-200k, 100.0% for AGIs over 200k)
Averages for the 2012 tax year for zip code 93527, filed in 2013:
Average Adjusted Gross Income (AGI) in 2012: $60,988 (Individual Income Tax Returns)
Here:
$60,988
State:
$72,726
Salary/wage: $55,398 (reported on 72.9% of returns)
Here:
$55,398
State:
$59,079
(% of AGI for various income ranges: 51.8% for AGIs below $25k, 67.3% for AGIs $25k-50k, 62.6% for AGIs $50k-75k, 70.7% for AGIs $75k-100k, 67.6% for AGIs $100k-200k)
Taxable interest for individuals: $1,297 (reported on 42.4% of returns)
This zip code:
$1,297
California:
$2,146
(% of AGI for various income ranges: 1.5% for AGIs below $25k, 1.6% for AGIs $25k-50k, 0.6% for AGIs $50k-75k, 0.2% for AGIs $75k-100k, 1.0% for AGIs $100k-200k)
Ordinary dividends: $2,333 (reported on 17.6% of returns)
Here:
$2,333
State:
$9,308
(% of AGI for various income ranges: 1.2% for AGIs below $25k, 0.7% for AGIs $25k-50k, 0.7% for AGIs $50k-75k, 0.8% for AGIs $100k-200k)
Net capital gain/loss in AGI: +$262 (reported on 18.8% of returns)
Here:
+$262
State:
+$30,460
(% of AGI for various income ranges: 0.6% for AGIs $100k-200k)
Profit/loss from business: +$1,750 (reported on 14.1% of returns)
Here:
+$1,750
State:
+$17,064
(% of AGI for various income ranges: 8.0% for AGIs below $25k)
Taxable individual retirement arrangement distribution: $11,244 (reported on 10.6% of returns)
93527:
$11,244
California:
$19,557
(% of AGI for various income ranges: 5.8% for AGIs below $25k, 2.5% for AGIs $25k-50k, 3.3% for AGIs $50k-75k, 1.5% for AGIs $100k-200k)
Total itemized deductions: $19,100 (20% of AGI, reported on 38.8% of returns)
Here:
$19,100
State:
$34,004
Here:
20.2% of AGI
State:
22.7% of AGI
(% of AGI for various income ranges: 12.0% for AGIs below $25k, 9.9% for AGIs $25k-50k, 12.0% for AGIs $50k-75k, 13.2% for AGIs $75k-100k, 12.4% for AGIs $100k-200k)
Charity contributions: $3,400 (reported on 27.1% of returns)
Here:
$3,400
State:
$4,659
(% of AGI for various income ranges: 1.4% for AGIs $25k-50k, 1.2% for AGIs $50k-75k, 1.8% for AGIs $75k-100k, 1.7% for AGIs $100k-200k)
Taxes paid: $6,827 (reported on 38.8% of returns)
93527:
$6,827
State:
$14,448
(% of AGI for various income ranges: 1.9% for AGIs below $25k, 2.1% for AGIs $25k-50k, 3.4% for AGIs $50k-75k, 4.5% for AGIs $75k-100k, 5.5% for AGIs $100k-200k)
Earned income credit: $2,469 (reported on 15.3% of returns)
Here:
$2,469
State:
$2,286
(% of AGI for various income ranges: 7.2% for AGIs below $25k, 0.9% for AGIs $25k-50k)
Percentage of individuals using paid preparers for their 2012 taxes: 55.3%
Here:
55%
State:
64%
(% for various income ranges: 48.3% for AGIs below $25k, 52.9% for AGIs $25k-50k, 66.7% for AGIs $50k-75k, 70.0% for AGIs $75k-100k, 52.9% for AGIs $100k-200k)
Averages for the 2004 tax year for zip code 93527, filed in 2005:
Average Adjusted Gross Income (AGI) in 2004: $52,908 (Individual Income Tax Returns)
Here:
$52,908
State:
$58,600
Salary/wage: $47,516 (reported on 80.1% of returns)
Here:
$47,516
State:
$49,455
(% of AGI for various income ranges: 72.9% for AGIs below $10k, 65.2% for AGIs $10k-25k, 70.1% for AGIs $25k-50k, 75.5% for AGIs $50k-75k, 84.7% for AGIs $75k-100k, 63.4% for AGIs over 100k)
Taxable interest for individuals: $1,016 (reported on 56.9% of returns)
This zip code:
$1,016
California:
$2,365
(% of AGI for various income ranges: 1.8% for AGIs below $10k, 1.4% for AGIs $10k-25k, 1.5% for AGIs $25k-50k, 1.5% for AGIs $50k-75k, 0.6% for AGIs $75k-100k, 1.0% for AGIs over 100k)
Taxable dividends: $1,601 (reported on 20.6% of returns)
Here:
$1,601
State:
$4,746
(% of AGI for various income ranges: 0.7% for AGIs below $10k, 1.8% for AGIs $10k-25k, 0.4% for AGIs $25k-50k, 0.7% for AGIs $50k-75k, 0.4% for AGIs $75k-100k, 0.6% for AGIs over 100k)
Net capital gain/loss: +$5,564 (reported on 18.5% of returns)
Here:
+$5,564
State:
+$23,418
(% of AGI for various income ranges: -0.5% for AGIs below $10k, -0.4% for AGIs $10k-25k, -0.2% for AGIs $25k-50k, 0.7% for AGIs $50k-75k, 0.4% for AGIs $75k-100k, 5.1% for AGIs over 100k)
Profit/loss from business: +$4,103 (reported on 13.0% of returns)
Here:
+$4,103
State:
+$16,826
(% of AGI for various income ranges: 12.5% for AGIs below $10k, 2.4% for AGIs $10k-25k, 1.7% for AGIs $25k-50k, 0.6% for AGIs $50k-75k, 0.8% for AGIs $75k-100k, 0.4% for AGIs over 100k)
IRA payment deduction: $3,059 (reported on 1.9% of returns)
93527:
$3,059
California:
$3,192
Total itemized deductions: $16,667 (19% of AGI, reported on 37.4% of returns)
Here:
$16,667
State:
$28,113
Here:
19.1% of AGI
State:
25.3% of AGI
(% of AGI for various income ranges: 12.6% for AGIs $10k-25k, 12.2% for AGIs $25k-50k, 9.4% for AGIs $50k-75k, 13.3% for AGIs $75k-100k, 12.1% for AGIs over 100k)
Charity contributions deductions: $2,997 (3% of AGI, reported on 33.6% of returns)
Here:
$2,997
State:
$3,923
Here:
3.3% of AGI
State:
3.3% of AGI
(% of AGI for various income ranges: 1.1% for AGIs $10k-25k, 1.4% for AGIs $25k-50k, 1.3% for AGIs $50k-75k, 2.4% for AGIs $75k-100k, 2.3% for AGIs over 100k)
Total tax: $7,230 (reported on 81.2% of returns)
93527:
$7,230
State:
$10,761
(% of AGI for various income ranges: 2.0% for AGIs below $10k, 4.0% for AGIs $10k-25k, 7.1% for AGIs $25k-50k, 9.5% for AGIs $50k-75k, 11.7% for AGIs $75k-100k, 14.9% for AGIs over 100k)
Earned income credit: $1,447 (reported on 12.8% of returns)
Here:
$1,447
State:
$1,763
Percentage of individuals using paid preparers for their 2004 taxes: 56.9%
Here:
57%
State:
66%
(% for various income ranges: 43.7% for AGIs below $10k, 57.8% for AGIs $10k-25k, 59.3% for AGIs $25k-50k, 62.9% for AGIs $50k-75k, 58.5% for AGIs $75k-100k, 56.4% for AGIs over 100k)
Household received Food Stamps/SNAP in the past 12 months: 140 Household did not receive Food Stamps/SNAP in the past 12 months: 694
Women who had a birth in the past 12 months: 12 (12 now married, 0 unmarried) Women who did not have a birth in the past 12 months: 295 (81 now married, 215 unmarried)
Housing units in zip code 93527 with a mortgage: 406 (64 second mortgage, 67 both second mortgage and home equity loan) Houses without a mortgage: 10
Median monthly owner costs for units with a mortgage: $2,037 Median monthly owner costs for units without a mortgage: $633
Residents with income below the poverty level in 2022:
This zip code:
16.1%
Whole state:
12.2%
Residents with income below 50% of the poverty level in 2022:
This zip code:
10.5%
Whole state:
6.2%
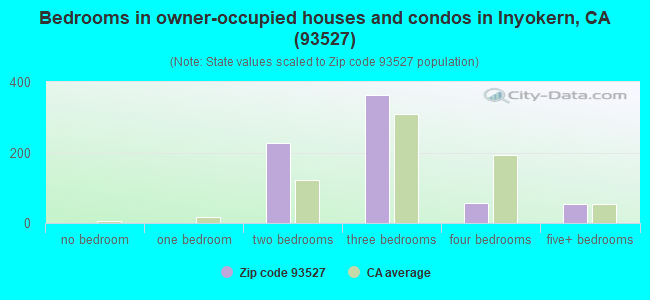
Median number of rooms in houses and condos:
Here:
5.3
State:
6.0
Median number of rooms in apartments:
Here:
5.6
State:
3.9
Notable locations in this zip code not listed on our city pages
Notable locations in zip code 93527: Kennedy Meadows Campground (A), Templeton Cow Camp (B), Painter Camp (C), Trout Meadows Forest Service Station (D), Willow Meadows Campground (E), Table Meadow (F), Kern Peak Lookout (G), Monache Cow Camps (H), Monache Station (I), Lower Pylos Camp (J), Upper Pyles Camp (K), Casa Vieja Meadows Forest Service Facility (L), Tulare County Fire Department Battalion 2 Kennedy Meadows Fire Station 18 (M), Bureau of Land Management Chimney Peak Fire Station (N). Display/hide their locations on the map
Streams, rivers, and creeks: Ninemile Creek (A), Lost Trout Creek (B), Lost Creek (C), Long Stringer (D), Long Canyon Creek (E), Little Kern Lake Creek (F), Lion Creek (G), Leggett Creek (H), Hell for Sure Creek (I). Display/hide their locations on the map
Size of family households: 304 2-persons, 113 3-persons, 44 4-persons, 5 5-persons, 23 6-persons, 16 7-or-more-persons
Size of nonfamily households: 325 1-person
239 married couples with children.
94 single-parent households (10 men, 84 women).
94.3% of residents of 93527 zip code speak English at home.
2.2% of residents speak Spanish at home (59% very well, 22% well, 19% not well).
2.4% of residents speak other Indo-European language at home (100% very well).
0.7% of residents speak Asian or Pacific Island language at home (58% very well, 42% not well).
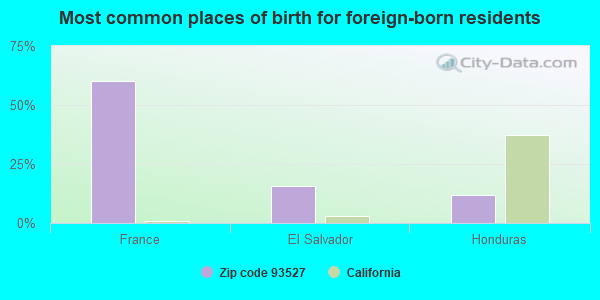
Foreign born population: 59 (3.5%) (100.0% of them are naturalized citizens)
This zip code:
3.5%
Whole state:
26.7%
60%France
16%El Salvador
12%Honduras
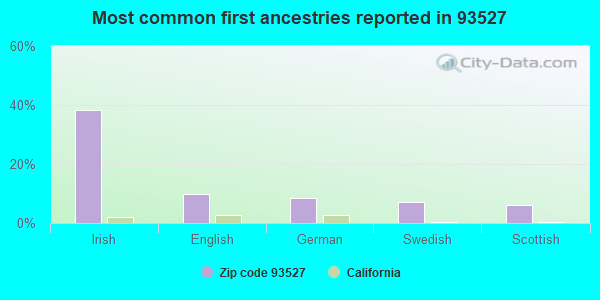
38%Irish
10%English
9%German
7%Swedish
6%Scottish
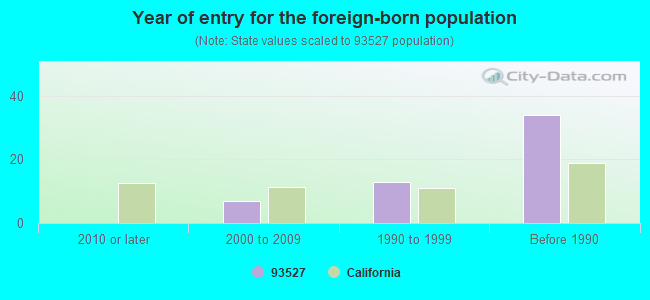
Year of entry for the foreign-born population
02010 or later
72000 to 2009
131990 to 1999
34Before 1990
Facilities with environmental interests located in this zip code:
INYOKERN ELEMENTARY (2ND AND LOCUST in INYOKERN, CA)
(National Center for Education Statistics) - STATE ID-6009609 Organizations: SIERRA SANDS UNIFIED (SCHOOL DISTRICT)
CALTRANS DISTRICT 09 (ROUTE 178 in INYOKERN, CA)
Small Quantity Generators, between 100 kg and 1000 kg of hazardous waste/month (Resource Conservation and Recovery Act (tracking hazardous waste)) Organizations: CA DEPT OF TRANS (CONTACT/OWNER)
NORTHROP INYOKERN FACILITY (E KERN CO, INYOKERN AIRPORT in INYOKERN, CA)
Small Quantity Generators, between 100 kg and 1000 kg of hazardous waste/month (Resource Conservation and Recovery Act (tracking hazardous waste))
Housing units lacking complete plumbing facilities: 6.0% Housing units lacking complete kitchen facilities: 8.7%
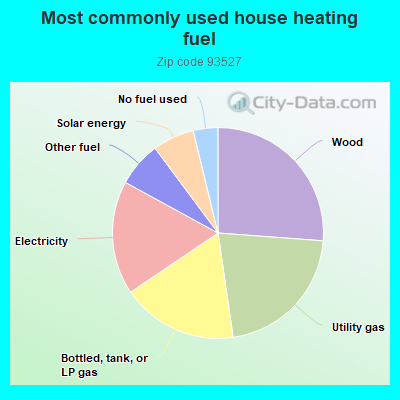
26.3%Wood
21.6%Utility gas
17.9%Bottled, tank, or LP gas
17.5%Electricity
6.9%Other fuel
6.4%Solar energy
3.8%No fuel used
Population in 1990: 2,633.
Place of birth for U.S.-born residents:
This state: 1,221
Northeast: 87
Midwest: 146
South: 93
West: 102
62% of the 93527 zip code residents lived in the same house 5 years ago. Out of people who lived in different houses, 60% lived in this county. Out of people who lived in different counties, 50% lived in California.
95% of the 93527 zip code residents lived in the same house 1 year ago. Out of people who lived in different houses, 46% moved from this county. Out of people who lived in different houses, 57% moved from different county within same state.
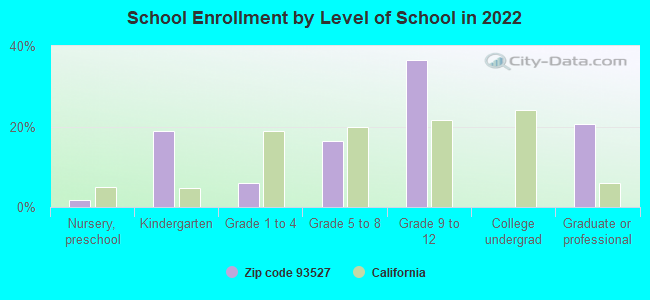
Private vs. public school enrollment:
Students in private schools in grades 1 to 8 (elementary and middle school): 9
Here:
13.0%
California:
10.5%
Students in private schools in grades 9 to 12 (high school): 6
Here:
5.7%
California:
8.5%
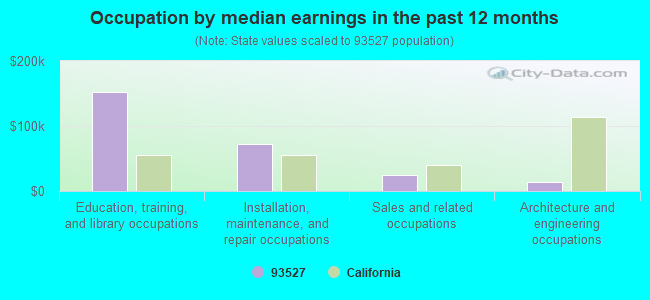
Occupation by median earnings in the past 12 months ($)
153,041Education, training, and library occupations
72,388Installation, maintenance, and repair occupations
24,538Sales and related occupations
13,460Architecture and engineering occupations
Companies with federal contracts located in this zip code (INYOKERN, CA):
COSO OPERATING COMPANY LLC (2 GIL STATION ROAD LITTLE) : $120,000,000 in 6 contractsfrom 1999 to 2004
Contracts for Other Professional Services, Geothermal -- Basic Research (R&D) by Navy Signed by year:2000: $10,000,000; 2001: $0; 2002: $20,000,000; 2003: $0; 2004: $10,000,000; 2005: $0; 2006: $0.
Biggest contracts:
$80,000,000 with Navy for Other Professional Services. Signed on 1999-10-01. Completion date: 2009-12-30.
$10,000,000 with Navy for Geothermal -- Basic Research (R&D). Signed on 2004-03-16. Completion date: 2002-12-31.
$10,000,000 with Navy for Other Professional Services. Signed on 2002-12-02. Completion date: 2009-12-05.
$10,000,000, same as above.Signed on 2002-01-30. Completion date: 2009-12-05.
KIVA BIOLOGICAL CONSULTING (8626 LAS FLORES; small business) : $565,065 in 18 contractsfrom 1999 to 2005
Contracts for Other Professional Services, Other Special Studies and Analyses, Endangered Species Studies - Plant and Animal, Historical Studies, and moreby Army, Navy, Geological Survey, National Park Service, and others Signed by year:2000: $85,596; 2001: $182,183; 2002: $44,886; 2003: $45,900; 2004: $110,600; 2005: $70,900; 2006: $0.
Biggest contracts:
$82,500 with Army for Other Professional Services. Taking place in NV. Signed on 2004-09-03. Completion date: 2005-05-31.
$62,100 with Navy for Other Special Studies and Analyses. Signed on 2001-04-05. Completion date: 2003-02-01.
$62,000 with Navy for Endangered Species Studies - Plant and Animal. Signed on 2005-04-22. Completion date: 2006-04-30.
$49,950 with Navy for Historical Studies. Signed on 2000-09-25. Completion date: 2003-03-31.
INDIAN WELLS VALLEY AIRPORT, DIST (1699 AIRPORT ROAD) : $25,124 in 37 contractsfrom 2002 to 2006
Contracts for Lease or Rental of Facilities -- Office Buildings by Public Buildings Service Signed by year:2000: $0; 2001: $0; 2002: $1; 2003: $12,963; 2004: $2,160; 2005: $2,160; 2006: $7,840.
Biggest contracts:
$2,160 with Public Buildings Service for Lease or Rental of Facilities -- Office Buildings. Signed on 2003-06-15. Completion date: 2003-06-15.
$2,160, same as above.Signed on 2003-09-15. Completion date: 2003-09-15.
$1,120, same as above.Signed on 2006-07-01. Completion date: 2006-09-30.
$1,120, same as above.Signed on 2006-07-01. Completion date: 2006-09-30.
INDIAN WELLS BREWING CO (2565 N HIGHWAY 14; small business) : $17,560 in 3 contractsfrom 2005 to 2006
$9,670 with Navy for Beverages, Nonalcoholic. Signed on 2005-08-30. Completion date: 2005-09-01.
$5,523, same as above.Signed on 2006-05-25. Completion date: 2006-06-01.
$2,367, same as above.Signed on 2006-06-09. Completion date: 2006-06-01.
MERTZ, HARRY & KEITH CONSTRUCT (6400 BROWN RD; small business)
$10,881 with Navy for Maintenance, Repair or Alteration of Real Property -- Other Non-Building Facilities. Signed on 2004-12-08. Completion date: 2004-09-09.
STEVENS, ROY JOE II (1485 HIGHWAY 14; small business)
$8,250 with Navy for Maintenance, Repair or Alteration of Real Property -- Other Non-Building Facilities. Signed on 2006-03-27. Completion date: 2006-04-02.
KIRAN MEHRA ARCHITECT AIA (2727 N. DERA STREET, BLDG.; small business) : $7,400 in 3 contractsfrom 1999 to 2000
$2,500 with Navy for Architect - Engineer Services (including landscaping, interior layout, and designing). Signed on 2000-02-08. Completion date: 2000-02-29.
$2,500, same as above.Signed on 2000-01-11. Completion date: 2000-01-31.
$2,400, same as above.Signed on 1999-11-10. Completion date: 2000-02-11.
Top industries in this zip code by the number of employees in 2005:
Utilities: Electric Power Distribution (50-99 employees: 1 establishment)
Accommodation and Food Services: Limited-Service Restaurants (10-19: 1, 5-9: 1)
Accommodation and Food Services: Full-Service Restaurants (5-9: 1)
Health Care and Social Assistance: Child Day Care Services (5-9: 1)
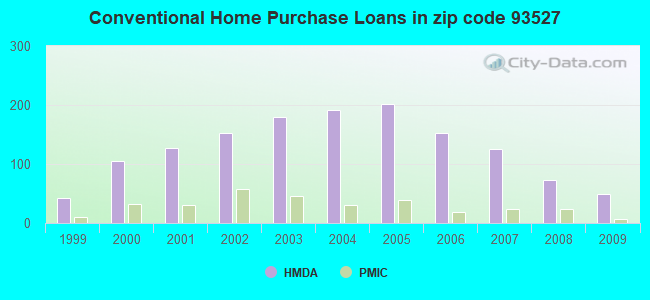
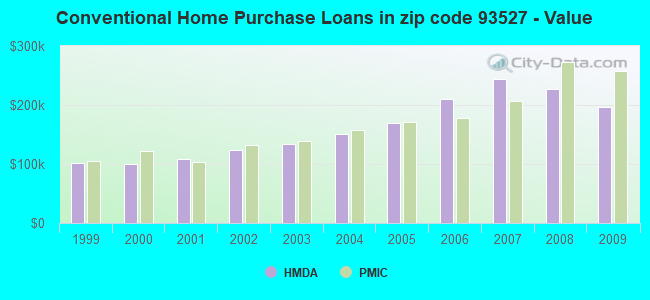
Detailed PMIC statistics for the following Tracts:0027.00
, 0055.01
2005 - 2018 National Fire Incident Reporting System (NFIRS) incidents
Based on the data from the years 2005 - 2018 the average number of fire incidents per year is 17. The highest number of fire incidents - 30 took place in 2006, and the least - 3 in 2008. The data has a dropping trend.
When looking into fire subcategories, the most incidents belonged to: Outside Fires (42.5%), and Structure Fires (37.8%).
Fire incident types reported to NFIRS in Zip Code 93527


 Nearest zip codes: 93549, 93208, 93238, 93255, 93545, 93530.


 Based on the data from the years 2005 - 2018 the average number of fire incidents per year is 17. The highest number of fire incidents - 30 took place in 2006, and the least - 3 in 2008. The data has a dropping trend.
 When looking into fire subcategories, the most incidents belonged to: Outside Fires (42.5%), and Structure Fires (37.8%).