Estimated zip code population in 2022: 30,802 Zip code population in 2010: 34,630 Zip code population in 2000: 25,793
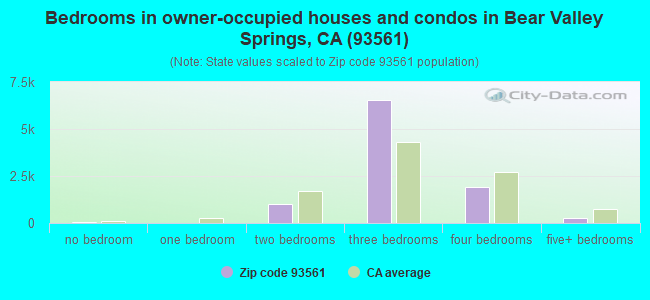
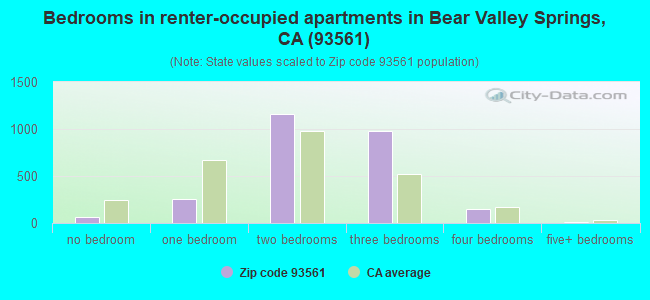
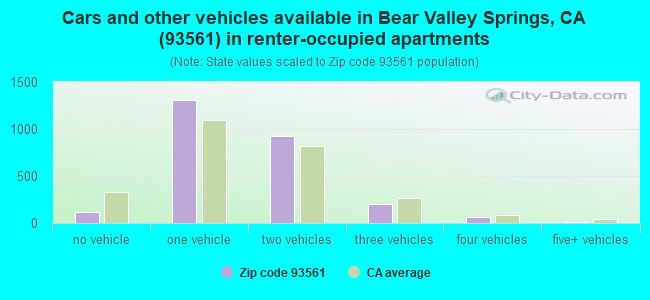
Houses and condos: 13,954 Renter-occupied apartments: 2,635
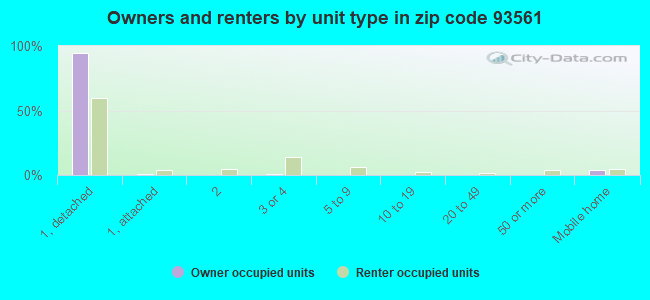
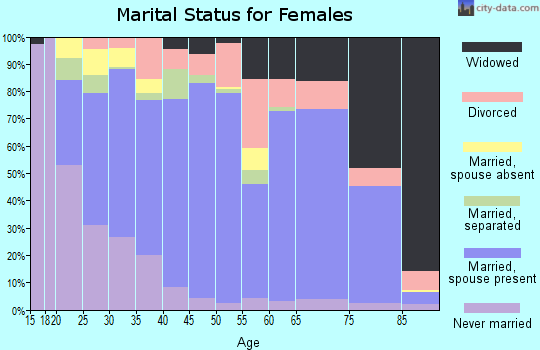
% of renters here:
21%
State:
44%
March 2022 cost of living index in zip code 93561: 95.2 (less than average, U.S. average is 100)
Land area: 264.1 sq. mi. Water area: 0.3 sq. mi.
Population density: 117 people per square mile
(very low).
OSM Map
General Map
Google Map
MSN Map
OSM Map
General Map
Google Map
MSN Map
OSM Map
General Map
Google Map
MSN Map
OSM Map
General Map
Google Map
MSN Map
Please wait while loading the map...
Real estate property taxes paid for housing units in 2022:
This zip code:
0.9% ($3,383)
California:
0.7% ($4,831)
Median real estate property taxes paid for housing units with mortgages in 2022: $3,557 (0.9%) Median real estate property taxes paid for housing units with no mortgage in 2022: $3,096 (0.9%)
Averages for the 2020 tax year for zip code 93561, filed in 2021:
Average Adjusted Gross Income (AGI) in 2020: $73,450 (Individual Income Tax Returns)
Here:
$73,450
State:
$95,910
Salary/wage: $67,679 (reported on 74.5% of returns)
Here:
$67,679
State:
$77,331
(% of AGI for various income ranges: 1153.7% for AGIs below $25k, 3335.7% for AGIs $25k-50k, 6247.7% for AGIs $50k-75k, 9038.3% for AGIs $75k-100k, 17626.2% for AGIs $100k-200k, 53001.0% for AGIs over 200k)
Taxable interest for individuals: $794 (reported on 44.3% of returns)
This zip code:
$794
California:
$2,294
(% of AGI for various income ranges: 19.6% for AGIs below $25k, 31.4% for AGIs $25k-50k, 38.8% for AGIs $50k-75k, 64.2% for AGIs $75k-100k, 102.6% for AGIs $100k-200k, 349.0% for AGIs over 200k)
Ordinary dividends: $3,488 (reported on 16.3% of returns)
Here:
$3,488
State:
$10,949
(% of AGI for various income ranges: 26.5% for AGIs below $25k, 41.8% for AGIs $25k-50k, 70.5% for AGIs $50k-75k, 85.0% for AGIs $75k-100k, 180.6% for AGIs $100k-200k, 647.1% for AGIs over 200k)
Net capital gain/loss in AGI: +$12,674 (reported on 17.0% of returns)
Here:
+$12,674
State:
+$49,306
(% of AGI for various income ranges: 4.7% for AGIs below $25k, 22.1% for AGIs $25k-50k, 49.4% for AGIs $50k-75k, 142.5% for AGIs $75k-100k, 347.2% for AGIs $100k-200k, 9607.1% for AGIs over 200k)
Profit/loss from business: +$9,418 (reported on 15.8% of returns)
Here:
+$9,418
State:
+$15,671
(% of AGI for various income ranges: 136.4% for AGIs below $25k, 204.2% for AGIs $25k-50k, 177.7% for AGIs $50k-75k, 162.9% for AGIs $75k-100k, 351.2% for AGIs $100k-200k, 1375.7% for AGIs over 200k)
Taxable individual retirement arrangement distribution: $18,814 (reported on 9.5% of returns)
93561:
$18,814
California:
$23,505
(% of AGI for various income ranges: 72.7% for AGIs below $25k, 142.2% for AGIs $25k-50k, 253.7% for AGIs $50k-75k, 308.0% for AGIs $75k-100k, 614.5% for AGIs $100k-200k, 1284.3% for AGIs over 200k)
Self-employed (Keogh) retirement plans: $18,300 (reported on 0.2% of returns)
93561:
$18,300
California:
$30,163
(% of AGI for various income ranges: 34.5% for AGIs $100k-200k)
Total itemized deductions: $28,061 (reported on 14.4% of returns)
Here:
$28,061
State:
$39,517
(% of AGI for various income ranges: 74.2% for AGIs below $25k, 195.0% for AGIs $25k-50k, 502.2% for AGIs $50k-75k, 757.2% for AGIs $75k-100k, 1451.7% for AGIs $100k-200k, 4534.8% for AGIs over 200k)
Charity contributions: $6,654 (reported on 11.7% of returns)
Here:
$6,654
State:
$12,598
(% of AGI for various income ranges: 4.8% for AGIs below $25k, 22.1% for AGIs $25k-50k, 64.0% for AGIs $50k-75k, 114.2% for AGIs $75k-100k, 319.9% for AGIs $100k-200k, 1211.4% for AGIs over 200k)
Taxes paid: $8,325 (reported on 14.3% of returns)
93561:
$8,325
State:
$8,807
(% of AGI for various income ranges: 15.3% for AGIs below $25k, 43.2% for AGIs $25k-50k, 144.5% for AGIs $50k-75k, 236.9% for AGIs $75k-100k, 466.4% for AGIs $100k-200k, 1201.4% for AGIs over 200k)
Earned income credit: $2,095 (reported on 11.6% of returns)
Here:
$2,095
State:
$2,074
(% of AGI for various income ranges: 84.1% for AGIs below $25k, 67.0% for AGIs $25k-50k, 1.3% for AGIs $50k-75k)
Percentage of individuals using paid preparers for their 2020 taxes: 94.1%
Here:
94%
State:
92%
(% for various income ranges: 92.4% for AGIs below $25k, 93.9% for AGIs $25k-50k, 94.8% for AGIs $50k-75k, 94.9% for AGIs $75k-100k, 95.0% for AGIs $100k-200k, 96.6% for AGIs over 200k)
Averages for the 2012 tax year for zip code 93561, filed in 2013:
Average Adjusted Gross Income (AGI) in 2012: $61,644 (Individual Income Tax Returns)
Here:
$61,644
State:
$72,726
Salary/wage: $56,319 (reported on 76.3% of returns)
Here:
$56,319
State:
$59,079
(% of AGI for various income ranges: 64.5% for AGIs below $25k, 63.6% for AGIs $25k-50k, 68.1% for AGIs $50k-75k, 71.2% for AGIs $75k-100k, 76.9% for AGIs $100k-200k, 54.1% for AGIs over 200k)
Taxable interest for individuals: $1,005 (reported on 45.5% of returns)
This zip code:
$1,005
California:
$2,146
(% of AGI for various income ranges: 1.9% for AGIs below $25k, 1.0% for AGIs $25k-50k, 0.7% for AGIs $50k-75k, 0.8% for AGIs $75k-100k, 0.5% for AGIs $100k-200k, 0.8% for AGIs over 200k)
Ordinary dividends: $3,026 (reported on 16.8% of returns)
Here:
$3,026
State:
$9,308
(% of AGI for various income ranges: 1.7% for AGIs below $25k, 0.9% for AGIs $25k-50k, 0.7% for AGIs $50k-75k, 0.7% for AGIs $75k-100k, 0.6% for AGIs $100k-200k, 1.3% for AGIs over 200k)
Net capital gain/loss in AGI: +$4,038 (reported on 14.2% of returns)
Here:
+$4,038
State:
+$30,460
(% of AGI for various income ranges: 0.3% for AGIs $50k-75k, 0.4% for AGIs $75k-100k, 0.4% for AGIs $100k-200k, 6.8% for AGIs over 200k)
Profit/loss from business: +$10,057 (reported on 17.1% of returns)
Here:
+$10,057
State:
+$17,064
(% of AGI for various income ranges: 9.5% for AGIs below $25k, 5.1% for AGIs $25k-50k, 1.6% for AGIs $50k-75k, 1.7% for AGIs $75k-100k, 1.5% for AGIs $100k-200k, 4.4% for AGIs over 200k)
Taxable individual retirement arrangement distribution: $15,353 (reported on 11.6% of returns)
93561:
$15,353
California:
$19,557
(% of AGI for various income ranges: 3.9% for AGIs below $25k, 3.8% for AGIs $25k-50k, 2.9% for AGIs $50k-75k, 3.4% for AGIs $75k-100k, 2.0% for AGIs $100k-200k, 3.4% for AGIs over 200k)
Self-employment retirement plans: $16,900 (reported on 0.3% of returns)
93561:
$16,900
California:
$24,530
Total itemized deductions: $23,575 (24% of AGI, reported on 44.8% of returns)
Here:
$23,575
State:
$34,004
Here:
24.3% of AGI
State:
22.7% of AGI
(% of AGI for various income ranges: 14.1% for AGIs below $25k, 14.1% for AGIs $25k-50k, 16.0% for AGIs $50k-75k, 17.3% for AGIs $75k-100k, 19.1% for AGIs $100k-200k, 16.7% for AGIs over 200k)
Charity contributions: $3,321 (reported on 37.7% of returns)
Here:
$3,321
State:
$4,659
(% of AGI for various income ranges: 0.9% for AGIs below $25k, 1.4% for AGIs $25k-50k, 1.9% for AGIs $50k-75k, 2.0% for AGIs $75k-100k, 2.5% for AGIs $100k-200k, 1.9% for AGIs over 200k)
Taxes paid: $8,008 (reported on 44.7% of returns)
93561:
$8,008
State:
$14,448
(% of AGI for various income ranges: 3.1% for AGIs below $25k, 3.3% for AGIs $25k-50k, 4.2% for AGIs $50k-75k, 5.4% for AGIs $75k-100k, 7.2% for AGIs $100k-200k, 8.6% for AGIs over 200k)
Earned income credit: $2,279 (reported on 14.4% of returns)
Here:
$2,279
State:
$2,286
(% of AGI for various income ranges: 6.1% for AGIs below $25k, 1.2% for AGIs $25k-50k)
Percentage of individuals using paid preparers for their 2012 taxes: 61.6%
Here:
62%
State:
64%
(% for various income ranges: 54.3% for AGIs below $25k, 59.7% for AGIs $25k-50k, 66.5% for AGIs $50k-75k, 67.1% for AGIs $75k-100k, 67.0% for AGIs $100k-200k, 73.9% for AGIs over 200k)
Averages for the 2004 tax year for zip code 93561, filed in 2005:
Average Adjusted Gross Income (AGI) in 2004: $50,719 (Individual Income Tax Returns)
Here:
$50,719
State:
$58,600
Salary/wage: $46,665 (reported on 77.0% of returns)
Here:
$46,665
State:
$49,455
(% of AGI for various income ranges: 186.5% for AGIs below $10k, 59.4% for AGIs $10k-25k, 67.4% for AGIs $25k-50k, 77.1% for AGIs $50k-75k, 77.6% for AGIs $75k-100k, 64.8% for AGIs over 100k)
Taxable interest for individuals: $1,562 (reported on 57.0% of returns)
This zip code:
$1,562
California:
$2,365
(% of AGI for various income ranges: 16.2% for AGIs below $10k, 2.9% for AGIs $10k-25k, 1.7% for AGIs $25k-50k, 1.4% for AGIs $50k-75k, 1.2% for AGIs $75k-100k, 1.8% for AGIs over 100k)
Taxable dividends: $2,096 (reported on 21.5% of returns)
Here:
$2,096
State:
$4,746
(% of AGI for various income ranges: 7.7% for AGIs below $10k, 1.5% for AGIs $10k-25k, 1.1% for AGIs $25k-50k, 0.6% for AGIs $50k-75k, 0.7% for AGIs $75k-100k, 0.9% for AGIs over 100k)
Net capital gain/loss: +$12,187 (reported on 20.4% of returns)
Here:
+$12,187
State:
+$23,418
(% of AGI for various income ranges: -9.7% for AGIs below $10k, 0.6% for AGIs $10k-25k, 1.4% for AGIs $25k-50k, 1.4% for AGIs $50k-75k, 2.3% for AGIs $75k-100k, 11.1% for AGIs over 100k)
Profit/loss from business: +$12,330 (reported on 18.7% of returns)
Here:
+$12,330
State:
+$16,826
(% of AGI for various income ranges: 2.4% for AGIs below $10k, 7.5% for AGIs $10k-25k, 4.6% for AGIs $25k-50k, 2.7% for AGIs $50k-75k, 2.1% for AGIs $75k-100k, 6.5% for AGIs over 100k)
IRA payment deduction: $3,072 (reported on 2.6% of returns)
93561:
$3,072
California:
$3,192
(% of AGI for various income ranges: 1.0% for AGIs below $10k, 0.1% for AGIs $10k-25k, 0.2% for AGIs $25k-50k, 0.2% for AGIs $50k-75k, 0.1% for AGIs $75k-100k, 0.1% for AGIs over 100k)
Self-employed pension: $18,975 (reported on 0.8% of returns)
Here:
$18,975
California:
$17,688
(% of AGI for various income ranges: 0.2% for AGIs $25k-50k, 0.1% for AGIs $50k-75k, 0.2% for AGIs $75k-100k, 0.6% for AGIs over 100k)
Total itemized deductions: $20,503 (26% of AGI, reported on 49.7% of returns)
Here:
$20,503
State:
$28,113
Here:
26.2% of AGI
State:
25.3% of AGI
(% of AGI for various income ranges: 48.1% for AGIs below $10k, 19.0% for AGIs $10k-25k, 19.9% for AGIs $25k-50k, 21.3% for AGIs $50k-75k, 21.6% for AGIs $75k-100k, 18.3% for AGIs over 100k)
Charity contributions deductions: $2,922 (4% of AGI, reported on 45.5% of returns)
Here:
$2,922
State:
$3,923
Here:
3.6% of AGI
State:
3.3% of AGI
(% of AGI for various income ranges: 2.0% for AGIs below $10k, 1.9% for AGIs $10k-25k, 2.3% for AGIs $25k-50k, 2.7% for AGIs $50k-75k, 3.0% for AGIs $75k-100k, 2.7% for AGIs over 100k)
Total tax: $6,779 (reported on 76.4% of returns)
93561:
$6,779
State:
$10,761
(% of AGI for various income ranges: 7.8% for AGIs below $10k, 3.9% for AGIs $10k-25k, 6.0% for AGIs $25k-50k, 7.8% for AGIs $50k-75k, 9.1% for AGIs $75k-100k, 15.4% for AGIs over 100k)
Earned income credit: $1,754 (reported on 12.6% of returns)
Here:
$1,754
State:
$1,763
Percentage of individuals using paid preparers for their 2004 taxes: 70.4%
Here:
70%
State:
66%
(% for various income ranges: 60.4% for AGIs below $10k, 71.9% for AGIs $10k-25k, 72.6% for AGIs $25k-50k, 73.2% for AGIs $50k-75k, 70.3% for AGIs $75k-100k, 74.8% for AGIs over 100k)
Likely homosexual households (counted as self-reported same-sex unmarried-partner households)
Lesbian couples: 0.5% of all households
Gay men: 0.0% of all households
Household received Food Stamps/SNAP in the past 12 months: 943 Household did not receive Food Stamps/SNAP in the past 12 months: 11,338
Women who had a birth in the past 12 months: 272 (249 now married, 21 unmarried) Women who did not have a birth in the past 12 months: 5,364 (2,538 now married, 2,809 unmarried)
Housing units in zip code 93561 with a mortgage: 5,986 (307 second mortgage, 11 home equity loan, 231 both second mortgage and home equity loan) Houses without a mortgage: 90
Median monthly owner costs for units with a mortgage: $1,915 Median monthly owner costs for units without a mortgage: $651
Residents with income below the poverty level in 2022:
This zip code:
8.9%
Whole state:
12.2%
Residents with income below 50% of the poverty level in 2022:
This zip code:
3.8%
Whole state:
6.2%
Median number of rooms in houses and condos:
Here:
5.8
State:
6.0
Median number of rooms in apartments:
Here:
4.5
State:
3.9
Notable locations in this zip code not listed on our city pages
In group quarters: 132 (-1 institutionalized population)
Size of family households: 3,940 2-persons, 1,486 3-persons, 1,663 4-persons, 769 5-persons, 226 6-persons, 115 7-or-more-persons
Size of nonfamily households: 3,580 1-person, 640 2-persons, 20 3-persons
5,063 married couples with children.
1,258 single-parent households (499 men, 759 women).
84.3% of residents of 93561 zip code speak English at home.
12.0% of residents speak Spanish at home (76% very well, 12% well, 12% not well, 1% not at all).
2.5% of residents speak other Indo-European language at home (87% very well, 4% well, 8% not well).
0.9% of residents speak Asian or Pacific Island language at home (70% very well, 15% well, 16% not well).
0.3% of residents speak other language at home (37% very well, 63% well).
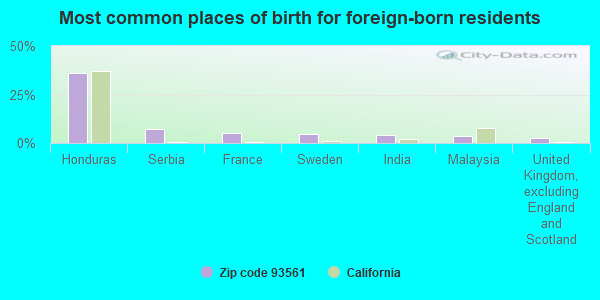
Foreign born population: 2,868 (9.3%) (58.0% of them are naturalized citizens)
This zip code:
9.3%
Whole state:
26.7%
36%Honduras
7%Serbia
5%France
5%Sweden
4%India
4%Malaysia
3%United Kingdom, excluding England and Scotland
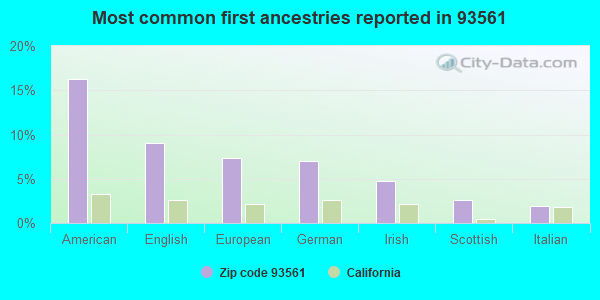
16%American
9%English
7%European
7%German
5%Irish
3%Scottish
2%Italian
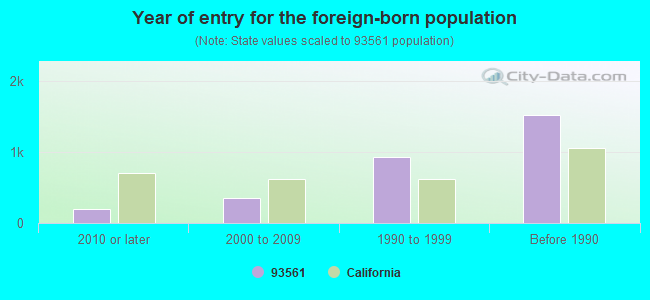
Year of entry for the foreign-born population
1922010 or later
3522000 to 2009
9241990 to 1999
1,516Before 1990
Major facilities with environmental interests located in this zip code:
G E WIND ENERGY L L C (13000 JAMESON RD in TEHACHAPI, CA)
STATE MASTER (California - Hazardous Waste Tracking) - HAZARDOU WASTE PROGRAM Large Quantity Generators, more that 1000 kg of hazardous waste/month (Resource Conservation and Recovery Act (tracking hazardous waste)) Organizations: GE WIND ENERGY LLC (CONTACT/OPERATOR)
Alternative names: ENRON WIND CORP, GE WIND ENERGY LLC, ZOND SYSTEMS INC
CHEVRON NO 205904 (401 EAST H ST in TEHACHAPI, CA)
STATE MASTER (California - Hazardous Waste Tracking) - HAZARDOU WASTE PROGRAM Large Quantity Generators, more that 1000 kg of hazardous waste/month (Resource Conservation and Recovery Act (tracking hazardous waste)) Organizations: CHEVRON PRODUCTS CO. (CONTACT/OPERATOR)
CALAVERAS CEMENT COMPANY (13573 TEHACHAPI BLVD. in MONOLITH, CA)
AIR MAJOR (AIRS/AFS) (Integrated Compliance Information System) - ICIS-09-1994-0041, FORMAL ENFORCEMENT ACTION COMPLIANCE ACTIVITY (Tracking inspections of insecticide, fungicide, and rodenticide, and toxic substances) CRITERIA AND HAZARDOUS AIR POLLUTANT INVENTORY (Inventory of air pollution sources) TRI REPORTER (Tracking of toxic chemicals releasing facilities) Business SIC classification: CEMENT, HYDRAULIC Alternative names: LEHIGH SOUTHWEST CEMENT CO
HENWAY INC (1314 GOODRICK DR in TEHACHAPI, CA)
STATE MASTER (California - Hazardous Waste Tracking) - HAZARDOU WASTE PROGRAM Small Quantity Generators, between 100 kg and 1000 kg of hazardous waste/month (Resource Conservation and Recovery Act (tracking hazardous waste)) - notification Organizations: SCOTT AND SUSAN BAKER (CONTACT/OWNER)
CHEMTOOL INC (1300 GOODRICK DR in TEHACHAPI, CA)
STATE MASTER (California - Hazardous Waste Tracking) - HAZARDOU WASTE PROGRAM Small Quantity Generators, between 100 kg and 1000 kg of hazardous waste/month (Resource Conservation and Recovery Act (tracking hazardous waste)) - notification Organizations: JAMES ATHANS (CONTACT/OWNER)
CALTRANS DISTRICT 09 (320 W TEHACHAPI BLVD in TEHACHAPI, CA)
STATE MASTER (California - Hazardous Waste Tracking) - HAZARDOU WASTE PROGRAM Small Quantity Generators, between 100 kg and 1000 kg of hazardous waste/month (Resource Conservation and Recovery Act (tracking hazardous waste)) Alternative names: CALTRANS DISTRICT 9
GOLDEN HILLS ELEMENTARY (20215 PARK ROAD in TEHACHAPI, CA)
(National Center for Education Statistics) - STATE ID-6105415 Organizations: TEHACHAPI UNIFIED (SCHOOL DISTRICT)
JACOBSEN JUNIOR HIGH (126 S. SNYDER AVE. in TEHACHAPI, CA)
(National Center for Education Statistics) - STATE ID-6057426 Organizations: TEHACHAPI UNIFIED (SCHOOL DISTRICT)
MONROE HIGH (CONT.) (28661 EUMATILLA in TEHACHAPI, CA)
(National Center for Education Statistics) - STATE ID-1530245 Organizations: TEHACHAPI UNIFIED (SCHOOL DISTRICT)
FABRICARE CLEANERS (1121 VALLEY BLVD STE F in TEHACHAPI, CA)
Small Quantity Generators, between 100 kg and 1000 kg of hazardous waste/month (Resource Conservation and Recovery Act (tracking hazardous waste)) - notification Organizations: BILL WELLS (CONTACT/OWNER)
, PATRICIA WELLS (CONTACT/OWNER)
FOUR SEASONS CHEVROLET OLDS (104 S CURRY ST in TEHACHAPI, CA)
Small Quantity Generators, between 100 kg and 1000 kg of hazardous waste/month (Resource Conservation and Recovery Act (tracking hazardous waste)) - notification Organizations: SECURITY PACIFIC NATL (CONTACT/OWNER)
MIKE PELTIERS AUTO CARE (20717 SOUTH STREET in TEHACHAPI, CA)
Small Quantity Generators, between 100 kg and 1000 kg of hazardous waste/month (Resource Conservation and Recovery Act (tracking hazardous waste)) - notification Business NAICS classification: GENERAL AUTOMOTIVE REPAIR.
FLOWIND CORP (16538 CAMMERON RIDGE RD in TEHACHAPI, CA)
Small Quantity Generators, between 100 kg and 1000 kg of hazardous waste/month (Resource Conservation and Recovery Act (tracking hazardous waste)) - notification
Housing units lacking complete plumbing facilities: 1.3% Housing units lacking complete kitchen facilities: 1.9%
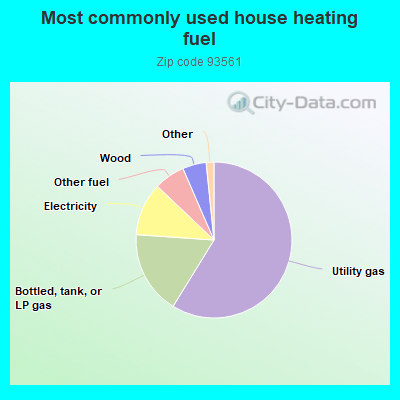
58.8%Utility gas
17.3%Bottled, tank, or LP gas
11.0%Electricity
6.4%Other fuel
4.9%Wood
0.7%No fuel used
0.7%Solar energy
Population in 1990: 24,466. Population change in the 1990s: +1,327 (+5.4%).
Place of birth for U.S.-born residents:
This state: 20,817
Northeast: 1,029
Midwest: 2,209
South: 1,713
West: 1,805
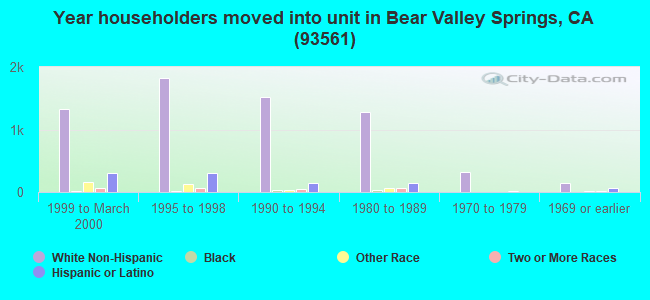
46% of the 93561 zip code residents lived in the same house 5 years ago. Out of people who lived in different houses, 49% lived in this county. Out of people who lived in different counties, 50% lived in California.
90% of the 93561 zip code residents lived in the same house 1 year ago. Out of people who lived in different houses, 53% moved from this county. Out of people who lived in different houses, 33% moved from different county within same state. Out of people who lived in different houses, 13% moved from different state. Out of people who lived in different houses, 1% moved from abroad.
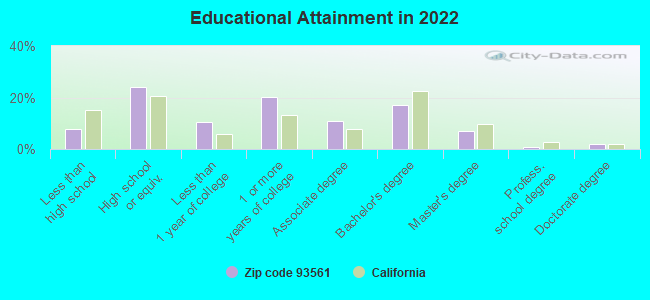
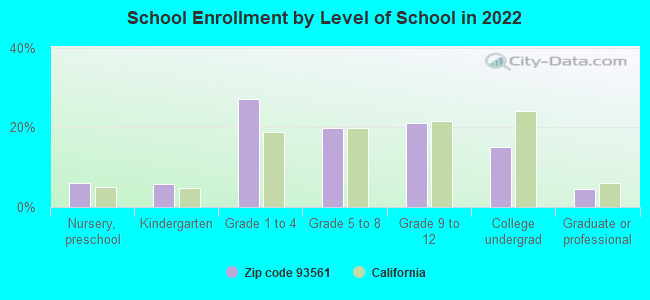
Private vs. public school enrollment:
Students in private schools in grades 1 to 8 (elementary and middle school): 933
Here:
27.4%
California:
10.5%
Students in private schools in grades 9 to 12 (high school): 61
Here:
4.1%
California:
8.5%
Students in private undergraduate colleges: 265
Here:
24.5%
California:
15.9%
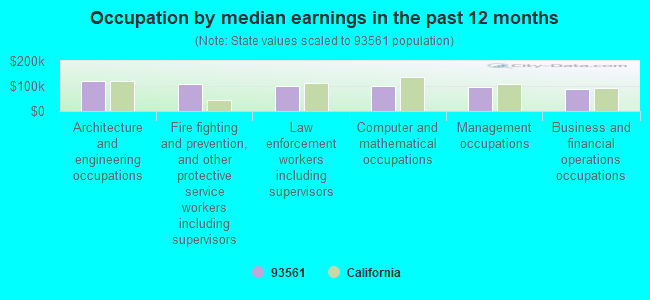
Occupation by median earnings in the past 12 months ($)
120,411Architecture and engineering occupations
107,667Fire fighting and prevention, and other protective service workers including supervisors
101,530Law enforcement workers including supervisors
99,449Computer and mathematical occupations
95,812Management occupations
89,123Business and financial operations occupations
Companies with federal contracts located in this zip code (TEHACHAPI, CA):
SOUTHERN OAK SERVICES INC (26020 COLUMBIA WY; small business) : $703,946 in 9 contractsfrom 2001 to 2005
Contracts for Technical Representation Services -- Aircraft and Airframe Structural Components by Air Force Signed by year:2000: $0; 2001: $115,784; 2002: $0; 2003: $143,638; 2004: $283,148; 2005: $161,376; 2006: $0.
Biggest contracts:
$161,376 with Air Force for Technical Representation Services -- Aircraft and Airframe Structural Components. Signed on 2005-10-03. Completion date: 2007-09-30.
$161,376, same as above.Signed on 2004-10-01. Completion date: 2007-09-30.
$115,784, same as above.Signed on 2001-11-29. Completion date: 2002-09-30.
$104,464, same as above.Signed on 2003-02-03. Completion date: 2003-09-30.
L G BARRETT (16334 HARRIS ROAD; small business) : $468,192 in 9 contractsfrom 2001 to 2005
Contracts for Training/Curriculum Development, Education Services by Air Force Signed by year:2000: $0; 2001: $84,506; 2002: $39,994; 2003: $188,854; 2004: $109,043; 2005: $45,795; 2006: $0.
Biggest contracts:
$114,498 with Air Force for Training/Curriculum Development. Signed on 2005-10-03. Completion date: 2004-09-30.
$109,043, same as above.Signed on 2004-10-01. Completion date: 2004-09-30.
$103,854, same as above.Signed on 2003-10-01. Completion date: 2004-09-30.
$85,000, same as above.Signed on 2003-04-02. Completion date: 2003-09-30.
PACIFIC SERVICE (26020 COLUMBIA WY; small business)
$112,055 with Air Force for Technical Representation Services -- Aircraft and Airframe Structural Components. Signed on 2000-11-22. Completion date: 2001-06-30.
SIGNS FROM ABOVE (24600 JACARANDA DR; small business)
$28,940 with Air Force for Landscaping/Groundskeeping Services. Signed on 2002-09-26. Completion date: 2002-12-20.
BENZ SANITATION INC (416 N DENNISON RD; small business) : $13,663 in 5 contractsfrom 2003 to 2006
Contracts for Plumbing Fixtures and Accessories, Trash/Garbage Collection Services - Including Portable Sanitation Services by Navy, Bureau of Land Management Signed by year:2000: $0; 2001: $0; 2002: $0; 2003: $2,771; 2004: $2,771; 2005: $2,561; 2006: $5,560.
Biggest contracts:
$3,130 with Navy for Plumbing Fixtures and Accessories. Signed on 2006-05-17. Completion date: 2006-06-20.
$2,771 with Bureau of Land Management for Trash/Garbage Collection Services - Including Portable Sanitation Services. Signed on 2004-09-30. Completion date: 2004-09-30.
$2,771, same as above.Signed on 2003-10-25. Completion date: 2003-10-25.
$2,561, same as above.Signed on 2005-10-01. Completion date: 2005-10-01.
VIRTUCON (733 SILVER OAK DR; small business) : $5,410 in 2 contractsin 2005
$2,705 with Defense Logistics Agency for Fastening Device. Signed on 2005-10-01. Completion date: 2006-09-30.
$2,705, same as above.Signed on 2005-09-14. Completion date: 2005-10-14.
Top industries in this zip code by the number of employees in 2005:
Utilities: Other Electric Power Generation (250-499 employees: 1 establishment, 20-49 employees: 1 establishment, 5-9 employees: 1 establishment, 1-4 employees: 2 establishments)
Health Care and Social Assistance: General Medical and Surgical Hospitals (100-249: 1)
Construction: New Single-Family Housing Construction (except Operative Builders) (20-49: 1, 10-19: 1, 5-9: 5, 1-4: 18)
Accommodation and Food Services: Hotels (except Casino Hotels) and Motels (20-49: 2, 10-19: 1, 1-4: 2)
Other Services (except Public Administration): Other Similar Organizations (except Business, Professional, Labor, and Political Organizations) (50-99: 1, 5-9: 1)
People in group quarters in 2010:
5,903 people in state prisons
23 people in other noninstitutional facilities
18 people in nursing facilities/skilled-nursing facilities
15 people in group homes intended for adults
2 people in group homes for juveniles (non-correctional)
People in group quarters in 2000:
4,357 people in state prisons
16 people in hospitals/wards and hospices for chronically ill
16 people in other hospitals or wards for chronically ill
16 people in other noninstitutional group quarters
11 people in nursing homes
2 people in orthopedic wards and institutions for the physically handicapped
2 people in religious group quarters
Home Mortgage Disclosure Act Aggregated Statistics For Year 2009 (Based on 2 full and 6 partial tracts)
A) FHA, FSA/RHS & VA Home Purchase Loans
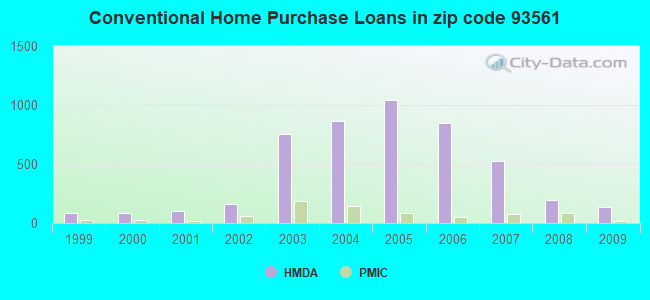
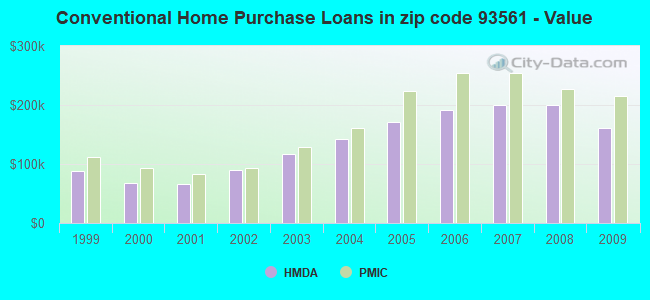
B) Conventional Home Purchase Loans
C) Refinancings
D) Home Improvement Loans
E) Loans on Dwellings For 5+ Families
F) Non-occupant Loans on < 5 Family Dwellings (A B C & D)
G) Loans On Manufactured Home Dwelling (A B C & D)
Number
Average Value
Number
Average Value
Number
Average Value
Number
Average Value
Number
Average Value
Number
Average Value
Number
Average Value
LOANS ORIGINATED
264
$178,199
134
$160,621
433
$184,828
18
$75,769
0
$0
72
$142,984
19
$135,501
APPLICATIONS APPROVED, NOT ACCEPTED
9
$151,467
15
$129,926
57
$211,222
2
$172,775
2
$228,000
7
$207,057
5
$68,010
APPLICATIONS DENIED
38
$190,944
18
$186,679
236
$202,090
17
$158,155
0
$0
32
$151,887
10
$136,842
APPLICATIONS WITHDRAWN
35
$176,076
18
$163,384
132
$195,846
9
$166,796
0
$0
22
$135,181
5
$171,182
FILES CLOSED FOR INCOMPLETENESS
0
$0
4
$116,540
42
$213,796
2
$44,340
0
$0
0
$0
3
$106,900
Aggregated Statistics For Year 2008 (Based on 2 full and 6 partial tracts)
A) FHA, FSA/RHS & VA Home Purchase Loans
B) Conventional Home Purchase Loans
C) Refinancings
D) Home Improvement Loans
F) Non-occupant Loans on < 5 Family Dwellings (A B C & D)
G) Loans On Manufactured Home Dwelling (A B C & D)
Number
Average Value
Number
Average Value
Number
Average Value
Number
Average Value
Number
Average Value
Number
Average Value
LOANS ORIGINATED
167
$208,197
199
$200,619
347
$177,596
49
$82,972
88
$150,207
21
$142,870
APPLICATIONS APPROVED, NOT ACCEPTED
14
$207,041
38
$223,098
73
$203,975
15
$75,226
17
$179,301
7
$110,914
APPLICATIONS DENIED
20
$223,826
97
$181,907
337
$207,203
48
$73,355
79
$183,380
16
$137,118
APPLICATIONS WITHDRAWN
23
$242,001
73
$195,435
135
$198,025
11
$84,259
22
$172,519
3
$147,873
FILES CLOSED FOR INCOMPLETENESS
2
$127,000
7
$195,264
25
$213,921
13
$96,881
9
$149,536
3
$204,027
Aggregated Statistics For Year 2007 (Based on 2 full and 6 partial tracts)
A) FHA, FSA/RHS & VA Home Purchase Loans
B) Conventional Home Purchase Loans
C) Refinancings
D) Home Improvement Loans
E) Loans on Dwellings For 5+ Families
F) Non-occupant Loans on < 5 Family Dwellings (A B C & D)
G) Loans On Manufactured Home Dwelling (A B C & D)
Number
Average Value
Number
Average Value
Number
Average Value
Number
Average Value
Number
Average Value
Number
Average Value
Number
Average Value
LOANS ORIGINATED
68
$228,217
529
$200,072
772
$201,552
140
$104,107
2
$228,000
214
$200,248
38
$133,620
APPLICATIONS APPROVED, NOT ACCEPTED
1
$297,120
92
$197,029
212
$214,594
36
$83,673
0
$0
57
$216,639
7
$162,651
APPLICATIONS DENIED
8
$157,402
142
$206,634
610
$232,514
105
$117,844
0
$0
89
$267,140
52
$117,067
APPLICATIONS WITHDRAWN
4
$267,650
145
$215,167
339
$219,308
22
$202,510
2
$300,000
41
$240,965
8
$213,836
FILES CLOSED FOR INCOMPLETENESS
0
$0
21
$190,622
97
$240,488
2
$152,290
0
$0
13
$251,233
1
$83,290
Aggregated Statistics For Year 2006 (Based on 2 full and 6 partial tracts)
A) FHA, FSA/RHS & VA Home Purchase Loans
B) Conventional Home Purchase Loans
C) Refinancings
D) Home Improvement Loans
E) Loans on Dwellings For 5+ Families
F) Non-occupant Loans on < 5 Family Dwellings (A B C & D)
G) Loans On Manufactured Home Dwelling (A B C & D)
Number
Average Value
Number
Average Value
Number
Average Value
Number
Average Value
Number
Average Value
Number
Average Value
Number
Average Value
LOANS ORIGINATED
25
$247,622
849
$191,573
1,196
$196,588
251
$131,287
2
$1,075,000
346
$205,290
43
$140,373
APPLICATIONS APPROVED, NOT ACCEPTED
5
$183,452
115
$205,163
210
$203,729
43
$116,828
0
$0
36
$198,854
20
$120,136
APPLICATIONS DENIED
2
$237,690
294
$192,425
525
$218,154
138
$136,655
0
$0
125
$208,910
30
$121,619
APPLICATIONS WITHDRAWN
8
$252,564
192
$197,064
582
$209,235
40
$140,204
0
$0
92
$190,063
8
$201,472
FILES CLOSED FOR INCOMPLETENESS
2
$180,000
25
$207,837
96
$220,010
5
$122,584
0
$0
9
$295,058
0
$0
Aggregated Statistics For Year 2005 (Based on 2 full and 6 partial tracts)
A) FHA, FSA/RHS & VA Home Purchase Loans
B) Conventional Home Purchase Loans
C) Refinancings
D) Home Improvement Loans
E) Loans on Dwellings For 5+ Families
F) Non-occupant Loans on < 5 Family Dwellings (A B C & D)
G) Loans On Manufactured Home Dwelling (A B C & D)
Number
Average Value
Number
Average Value
Number
Average Value
Number
Average Value
Number
Average Value
Number
Average Value
Number
Average Value
LOANS ORIGINATED
31
$207,363
1,039
$171,418
1,362
$173,006
206
$120,617
10
$1,694,616
371
$170,527
55
$127,727
APPLICATIONS APPROVED, NOT ACCEPTED
3
$163,860
145
$153,850
190
$175,370
32
$112,713
4
$1,503,805
36
$159,163
8
$128,335
APPLICATIONS DENIED
9
$224,099
286
$162,546
563
$172,540
107
$106,966
0
$0
93
$162,381
37
$113,745
APPLICATIONS WITHDRAWN
11
$172,696
226
$177,277
592
$185,217
87
$133,939
0
$0
70
$195,449
26
$160,693
FILES CLOSED FOR INCOMPLETENESS
0
$0
40
$224,211
92
$172,823
6
$115,317
0
$0
13
$187,618
5
$159,326
Aggregated Statistics For Year 2004 (Based on 2 full and 6 partial tracts)
A) FHA, FSA/RHS & VA Home Purchase Loans
B) Conventional Home Purchase Loans
C) Refinancings
D) Home Improvement Loans
E) Loans on Dwellings For 5+ Families
F) Non-occupant Loans on < 5 Family Dwellings (A B C & D)
G) Loans On Manufactured Home Dwelling (A B C & D)
Number
Average Value
Number
Average Value
Number
Average Value
Number
Average Value
Number
Average Value
Number
Average Value
Number
Average Value
LOANS ORIGINATED
41
$154,712
862
$142,708
1,342
$138,913
225
$72,879
6
$956,287
351
$131,751
72
$96,376
APPLICATIONS APPROVED, NOT ACCEPTED
5
$150,560
99
$153,787
230
$135,276
23
$69,812
0
$0
47
$141,495
20
$85,179
APPLICATIONS DENIED
13
$146,080
131
$140,358
505
$138,938
116
$72,858
0
$0
73
$158,390
29
$107,743
APPLICATIONS WITHDRAWN
4
$145,352
146
$149,020
492
$138,457
68
$60,087
0
$0
50
$126,048
10
$112,199
FILES CLOSED FOR INCOMPLETENESS
0
$0
16
$155,884
103
$147,436
12
$62,263
0
$0
7
$75,517
0
$0
Aggregated Statistics For Year 2003 (Based on 3 full and 6 partial tracts)
A) FHA, FSA/RHS & VA Home Purchase Loans
B) Conventional Home Purchase Loans
C) Refinancings
D) Home Improvement Loans
E) Loans on Dwellings For 5+ Families
F) Non-occupant Loans on < 5 Family Dwellings (A B C & D)
Number
Average Value
Number
Average Value
Number
Average Value
Number
Average Value
Number
Average Value
Number
Average Value
LOANS ORIGINATED
119
$128,014
756
$117,498
1,825
$114,456
89
$38,583
4
$474,098
414
$103,711
APPLICATIONS APPROVED, NOT ACCEPTED
7
$119,401
107
$109,183
275
$108,920
18
$56,043
0
$0
46
$90,827
APPLICATIONS DENIED
5
$83,644
86
$132,563
596
$116,734
65
$43,485
0
$0
72
$107,153
APPLICATIONS WITHDRAWN
26
$113,992
100
$122,732
477
$118,951
13
$78,022
4
$2,300,000
53
$105,983
FILES CLOSED FOR INCOMPLETENESS
0
$0
28
$144,873
79
$114,352
1
$46,410
0
$0
7
$88,513
Aggregated Statistics For Year 2002 (Based on 3 full tracts)
A) FHA, FSA/RHS & VA Home Purchase Loans
B) Conventional Home Purchase Loans
C) Refinancings
D) Home Improvement Loans
E) Loans on Dwellings For 5+ Families
F) Non-occupant Loans on < 5 Family Dwellings (A B C & D)
Number
Average Value
Number
Average Value
Number
Average Value
Number
Average Value
Number
Average Value
Number
Average Value
LOANS ORIGINATED
88
$97,568
165
$89,812
333
$84,264
18
$40,889
8
$644,250
84
$70,667
APPLICATIONS APPROVED, NOT ACCEPTED
4
$106,000
14
$54,857
65
$74,985
0
$0
0
$0
10
$57,200
APPLICATIONS DENIED
12
$112,000
18
$65,444
138
$83,522
2
$25,000
0
$0
6
$89,000
APPLICATIONS WITHDRAWN
6
$109,667
6
$115,000
72
$90,250
8
$15,000
0
$0
2
$96,000
FILES CLOSED FOR INCOMPLETENESS
0
$0
4
$57,000
28
$70,786
0
$0
0
$0
2
$66,000
Aggregated Statistics For Year 2001 (Based on 3 full tracts)
A) FHA, FSA/RHS & VA Home Purchase Loans
B) Conventional Home Purchase Loans
C) Refinancings
D) Home Improvement Loans
E) Loans on Dwellings For 5+ Families
F) Non-occupant Loans on < 5 Family Dwellings (A B C & D)
Number
Average Value
Number
Average Value
Number
Average Value
Number
Average Value
Number
Average Value
Number
Average Value
LOANS ORIGINATED
130
$86,600
103
$66,039
268
$74,590
8
$32,750
4
$1,697,500
67
$62,716
APPLICATIONS APPROVED, NOT ACCEPTED
2
$78,000
8
$180,750
34
$82,882
2
$5,000
0
$0
0
$0
APPLICATIONS DENIED
4
$49,000
22
$51,455
128
$63,141
14
$33,857
0
$0
8
$55,000
APPLICATIONS WITHDRAWN
4
$92,000
28
$77,571
86
$73,581
2
$59,000
0
$0
10
$62,200
FILES CLOSED FOR INCOMPLETENESS
2
$84,000
2
$63,000
26
$71,538
2
$47,000
0
$0
4
$58,500
Aggregated Statistics For Year 2000 (Based on 2 full tracts)
A) FHA, FSA/RHS & VA Home Purchase Loans
B) Conventional Home Purchase Loans
C) Refinancings
D) Home Improvement Loans
E) Loans on Dwellings For 5+ Families
F) Non-occupant Loans on < 5 Family Dwellings (A B C & D)
Number
Average Value
Number
Average Value
Number
Average Value
Number
Average Value
Number
Average Value
Number
Average Value
LOANS ORIGINATED
98
$81,449
86
$67,860
86
$62,302
8
$23,250
2
$960,000
32
$63,812
APPLICATIONS APPROVED, NOT ACCEPTED
6
$75,667
8
$86,250
14
$69,429
20
$25,400
0
$0
0
$0
APPLICATIONS DENIED
6
$99,667
34
$65,588
82
$59,268
20
$19,800
2
$1,350,000
14
$59,429
APPLICATIONS WITHDRAWN
6
$81,667
14
$54,571
32
$54,562
4
$22,500
0
$0
2
$55,000
FILES CLOSED FOR INCOMPLETENESS
4
$44,000
0
$0
12
$94,833
0
$0
0
$0
0
$0
Aggregated Statistics For Year 1999 (Based on 1 full and 1 partial tracts)
A) FHA, FSA/RHS & VA Home Purchase Loans
B) Conventional Home Purchase Loans
C) Refinancings
D) Home Improvement Loans
E) Loans on Dwellings For 5+ Families
F) Non-occupant Loans on < 5 Family Dwellings (A B C & D)
2005 - 2018 National Fire Incident Reporting System (NFIRS) incidents
Based on the data from the years 2005 - 2018 the average number of fire incidents per year is 116. The highest number of reported fires - 253 took place in 2006, and the least - 30 in 2010. The data has a decreasing trend.
When looking into fire subcategories, the most incidents belonged to: Outside Fires (49.1%), and Structure Fires (33.7%).
Fire incident types reported to NFIRS in Zip Code 93561


 Nearest zip codes: 93531, 93518, 93560, 93501, 93203, 93220.


 Based on the data from the years 2005 - 2018 the average number of fire incidents per year is 116. The highest number of reported fires - 253 took place in 2006, and the least - 30 in 2010. The data has a decreasing trend.
 When looking into fire subcategories, the most incidents belonged to: Outside Fires (49.1%), and Structure Fires (33.7%).