Estimated zip code population in 2022: 1,893 Zip code population in 2010: 2,604 Zip code population in 2000: 2,627
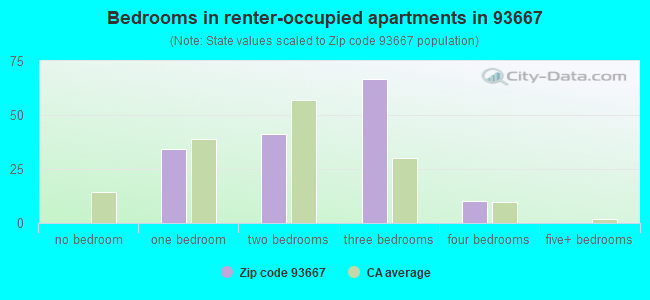
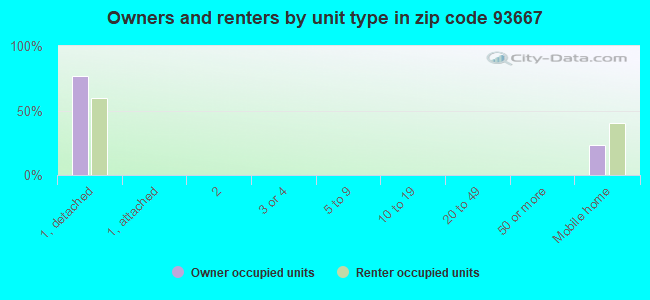
Houses and condos: 1,077 Renter-occupied apartments: 152
% of renters here:
19%
State:
44%
March 2022 cost of living index in zip code 93667: 97.5 (near average, U.S. average is 100)
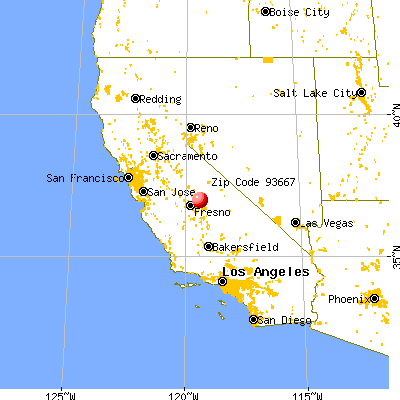
Land area: 111.4 sq. mi. Water area: 0.9 sq. mi.
Population density: 17 people per square mile
(very low).
OSM Map
General Map
Google Map
MSN Map
OSM Map
General Map
Google Map
MSN Map
OSM Map
General Map
Google Map
MSN Map
OSM Map
General Map
Google Map
MSN Map
Please wait while loading the map...
Real estate property taxes paid for housing units in 2022:
This zip code:
0.4% ($1,538)
California:
0.7% ($4,831)
Median real estate property taxes paid for housing units with mortgages in 2022: $2,072 (0.5%) Median real estate property taxes paid for housing units with no mortgage in 2022: $1,090 (0.4%)
Averages for the 2020 tax year for zip code 93667, filed in 2021:
Average Adjusted Gross Income (AGI) in 2020: $71,116 (Individual Income Tax Returns)
Here:
$71,116
State:
$95,910
Salary/wage: $62,437 (reported on 73.2% of returns)
Here:
$62,437
State:
$77,331
(% of AGI for various income ranges: 918.9% for AGIs below $25k, 3402.9% for AGIs $25k-50k, 5753.3% for AGIs $50k-75k, 8767.1% for AGIs $75k-100k, 16843.6% for AGIs $100k-200k)
Taxable interest for individuals: $460 (reported on 41.2% of returns)
This zip code:
$460
California:
$2,294
(% of AGI for various income ranges: 13.3% for AGIs below $25k, 15.0% for AGIs $25k-50k, 26.7% for AGIs $50k-75k, 51.4% for AGIs $75k-100k, 37.3% for AGIs $100k-200k)
Ordinary dividends: $3,446 (reported on 13.4% of returns)
Here:
$3,446
State:
$10,949
(% of AGI for various income ranges: 42.2% for AGIs below $25k, 90.0% for AGIs $50k-75k, 75.7% for AGIs $75k-100k, 216.4% for AGIs $100k-200k)
Net capital gain/loss in AGI: +$7,373 (reported on 15.5% of returns)
Here:
+$7,373
State:
+$49,306
(% of AGI for various income ranges: 29.4% for AGIs below $25k, 104.4% for AGIs $50k-75k, 81.4% for AGIs $75k-100k, 820.0% for AGIs $100k-200k)
Profit/loss from business: +$7,600 (reported on 15.5% of returns)
Here:
+$7,600
State:
+$15,671
(% of AGI for various income ranges: 208.9% for AGIs below $25k, 121.4% for AGIs $25k-50k, 171.1% for AGIs $50k-75k, 77.1% for AGIs $75k-100k, 350.9% for AGIs $100k-200k)
Taxable individual retirement arrangement distribution: $16,590 (reported on 10.3% of returns)
93667:
$16,590
California:
$23,505
(% of AGI for various income ranges: 240.6% for AGIs below $25k, 573.3% for AGIs $50k-75k, 645.5% for AGIs $100k-200k)
Total itemized deductions: $28,890 (reported on 10.3% of returns)
Here:
$28,890
State:
$39,517
(% of AGI for various income ranges: 505.7% for AGIs $25k-50k, 760.0% for AGIs $75k-100k, 1499.1% for AGIs $100k-200k)
Charity contributions: $9,386 (reported on 7.2% of returns)
Here:
$9,386
State:
$12,598
(% of AGI for various income ranges: 200.0% for AGIs $50k-75k, 433.6% for AGIs $100k-200k)
Taxes paid: $7,110 (reported on 10.3% of returns)
93667:
$7,110
State:
$8,807
(% of AGI for various income ranges: 94.3% for AGIs $25k-50k, 211.4% for AGIs $75k-100k, 391.8% for AGIs $100k-200k)
Earned income credit: $1,857 (reported on 14.4% of returns)
Here:
$1,857
State:
$2,074
(% of AGI for various income ranges: 87.8% for AGIs below $25k, 72.9% for AGIs $25k-50k)
Percentage of individuals using paid preparers for their 2020 taxes: 93.8%
Here:
94%
State:
92%
(% for various income ranges: 96.6% for AGIs below $25k, 90.5% for AGIs $25k-50k, 85.7% for AGIs $50k-75k, 100.0% for AGIs $75k-100k, 94.4% for AGIs $100k-200k, 100.0% for AGIs over 200k)
Averages for the 2012 tax year for zip code 93667, filed in 2013:
Average Adjusted Gross Income (AGI) in 2012: $53,789 (Individual Income Tax Returns)
Here:
$53,789
State:
$72,726
Salary/wage: $47,892 (reported on 76.8% of returns)
Here:
$47,892
State:
$59,079
(% of AGI for various income ranges: 64.6% for AGIs below $25k, 63.1% for AGIs $25k-50k, 68.5% for AGIs $50k-75k, 70.3% for AGIs $75k-100k, 70.0% for AGIs $100k-200k)
Taxable interest for individuals: $826 (reported on 41.1% of returns)
This zip code:
$826
California:
$2,146
(% of AGI for various income ranges: 0.4% for AGIs below $25k, 0.5% for AGIs $25k-50k, 0.3% for AGIs $50k-75k, 0.2% for AGIs $75k-100k, 1.2% for AGIs $100k-200k)
Ordinary dividends: $2,393 (reported on 14.7% of returns)
Here:
$2,393
State:
$9,308
(% of AGI for various income ranges: 0.7% for AGIs below $25k, 0.9% for AGIs $25k-50k, 0.6% for AGIs $50k-75k, 0.8% for AGIs $75k-100k, 0.5% for AGIs $100k-200k)
Net capital gain/loss in AGI: +$1,270 (reported on 10.5% of returns)
Here:
+$1,270
State:
+$30,460
(% of AGI for various income ranges: 0.8% for AGIs $100k-200k)
Profit/loss from business: +$6,538 (reported on 16.8% of returns)
Here:
+$6,538
State:
+$17,064
(% of AGI for various income ranges: 6.8% for AGIs below $25k, 3.3% for AGIs $25k-50k, 1.7% for AGIs $50k-75k, 1.4% for AGIs $75k-100k, 1.1% for AGIs $100k-200k)
Taxable individual retirement arrangement distribution: $12,956 (reported on 9.5% of returns)
93667:
$12,956
California:
$19,557
Total itemized deductions: $22,900 (25% of AGI, reported on 35.8% of returns)
Here:
$22,900
State:
$34,004
Here:
24.5% of AGI
State:
22.7% of AGI
(% of AGI for various income ranges: 10.4% for AGIs below $25k, 10.7% for AGIs $25k-50k, 14.7% for AGIs $50k-75k, 16.6% for AGIs $75k-100k, 17.3% for AGIs $100k-200k)
Charity contributions: $4,281 (reported on 27.4% of returns)
Here:
$4,281
State:
$4,659
(% of AGI for various income ranges: 1.8% for AGIs $25k-50k, 1.9% for AGIs $50k-75k, 2.1% for AGIs $75k-100k, 3.0% for AGIs $100k-200k)
Taxes paid: $6,297 (reported on 35.8% of returns)
93667:
$6,297
State:
$14,448
(% of AGI for various income ranges: 1.1% for AGIs below $25k, 2.5% for AGIs $25k-50k, 3.1% for AGIs $50k-75k, 4.4% for AGIs $75k-100k, 5.9% for AGIs $100k-200k)
Earned income credit: $2,167 (reported on 18.9% of returns)
Here:
$2,167
State:
$2,286
(% of AGI for various income ranges: 7.2% for AGIs below $25k, 1.3% for AGIs $25k-50k)
Percentage of individuals using paid preparers for their 2012 taxes: 53.7%
Here:
54%
State:
64%
(% for various income ranges: 45.7% for AGIs below $25k, 47.4% for AGIs $25k-50k, 57.1% for AGIs $50k-75k, 64.3% for AGIs $75k-100k, 69.2% for AGIs $100k-200k)
Averages for the 2004 tax year for zip code 93667, filed in 2005:
Average Adjusted Gross Income (AGI) in 2004: $45,432 (Individual Income Tax Returns)
Here:
$45,432
State:
$58,600
Salary/wage: $41,475 (reported on 84.3% of returns)
Here:
$41,475
State:
$49,455
(% of AGI for various income ranges: 107.8% for AGIs below $10k, 68.9% for AGIs $10k-25k, 77.5% for AGIs $25k-50k, 81.9% for AGIs $50k-75k, 81.9% for AGIs $75k-100k, 69.5% for AGIs over 100k)
Taxable interest for individuals: $616 (reported on 48.9% of returns)
This zip code:
$616
California:
$2,365
(% of AGI for various income ranges: 5.8% for AGIs below $10k, 1.5% for AGIs $10k-25k, 0.5% for AGIs $25k-50k, 0.5% for AGIs $50k-75k, 0.1% for AGIs $75k-100k, 0.6% for AGIs over 100k)
Taxable dividends: $1,497 (reported on 17.2% of returns)
Here:
$1,497
State:
$4,746
(% of AGI for various income ranges: 2.6% for AGIs below $10k, 0.6% for AGIs $10k-25k, 0.4% for AGIs $25k-50k, 0.4% for AGIs $50k-75k, 0.0% for AGIs $75k-100k, 1.0% for AGIs over 100k)
Net capital gain/loss: +$7,500 (reported on 13.7% of returns)
Here:
+$7,500
State:
+$23,418
(% of AGI for various income ranges: -0.1% for AGIs below $10k, -0.2% for AGIs $10k-25k, 1.3% for AGIs $25k-50k, 0.8% for AGIs $50k-75k, 0.6% for AGIs $75k-100k, 6.1% for AGIs over 100k)
Profit/loss from business: +$6,410 (reported on 14.7% of returns)
Here:
+$6,410
State:
+$16,826
(% of AGI for various income ranges: 0.0% for AGIs below $10k, 1.2% for AGIs $10k-25k, 4.2% for AGIs $25k-50k, 2.3% for AGIs $50k-75k, 1.7% for AGIs $75k-100k, 1.0% for AGIs over 100k)
IRA payment deduction: $2,850 (reported on 2.0% of returns)
93667:
$2,850
California:
$3,192
Total itemized deductions: $18,455 (25% of AGI, reported on 39.3% of returns)
Here:
$18,455
State:
$28,113
Here:
24.9% of AGI
State:
25.3% of AGI
(% of AGI for various income ranges: 17.4% for AGIs $10k-25k, 12.8% for AGIs $25k-50k, 16.8% for AGIs $50k-75k, 18.4% for AGIs $75k-100k, 16.6% for AGIs over 100k)
Charity contributions deductions: $3,296 (4% of AGI, reported on 32.4% of returns)
Here:
$3,296
State:
$3,923
Here:
4.2% of AGI
State:
3.3% of AGI
(% of AGI for various income ranges: 1.1% for AGIs $10k-25k, 1.8% for AGIs $25k-50k, 2.1% for AGIs $50k-75k, 2.4% for AGIs $75k-100k, 3.5% for AGIs over 100k)
Total tax: $5,554 (reported on 76.0% of returns)
93667:
$5,554
State:
$10,761
(% of AGI for various income ranges: 2.8% for AGIs below $10k, 3.4% for AGIs $10k-25k, 6.1% for AGIs $25k-50k, 7.8% for AGIs $50k-75k, 9.4% for AGIs $75k-100k, 15.0% for AGIs over 100k)
Earned income credit: $1,695 (reported on 13.4% of returns)
Here:
$1,695
State:
$1,763
Percentage of individuals using paid preparers for their 2004 taxes: 59.4%
Here:
59%
State:
66%
(% for various income ranges: 46.7% for AGIs below $10k, 58.6% for AGIs $10k-25k, 56.6% for AGIs $25k-50k, 64.6% for AGIs $50k-75k, 70.6% for AGIs $75k-100k, 71.4% for AGIs over 100k)
Household received Food Stamps/SNAP in the past 12 months: 157 Household did not receive Food Stamps/SNAP in the past 12 months: 663
Women who had a birth in the past 12 months: 3 (1 now married, 2 unmarried) Women who did not have a birth in the past 12 months: 270 (113 now married, 156 unmarried)
Housing units in zip code 93667 with a mortgage: 357 (18 second mortgage, 19 both second mortgage and home equity loan) Median monthly owner costs for units with a mortgage: $1,736 Median monthly owner costs for units without a mortgage: $429
Residents with income below the poverty level in 2022:
This zip code:
10.9%
Whole state:
12.2%
Residents with income below 50% of the poverty level in 2022:
This zip code:
7.4%
Whole state:
6.2%
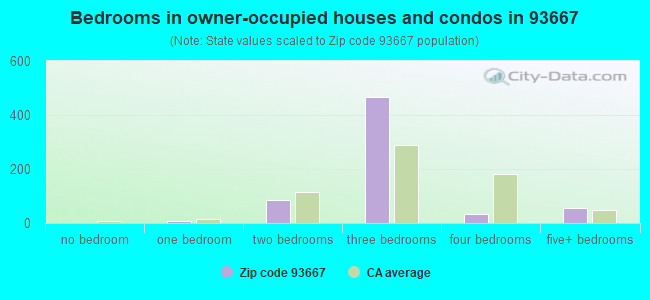
Median number of rooms in houses and condos:
Here:
5.5
State:
6.0
Median number of rooms in apartments:
Here:
4.5
State:
3.9
Notable locations in this zip code not listed on our city pages
Notable locations in zip code 93667: Kings River Powerhouse (A), Kirch Flat Campground (B), Sycamore Flat Campground One (C), Sycamore Flat Campground Two (D), Lakeview Picnic Ground (E), Humphreys Station (F), Lakeview Picnic Ground (G), Cats Head Campground (H), Black Mountain Lookout (I). Display/hide their locations on the map
Rivers and creeks: Deep Creek (A), Little Dry Creek (B), Lower Rancheria Creek (C), Sand Creek (D), Watts Creek (E), North Fork Kings River (F), Sycamore Springs Creek (G), Sycamore Creek (H), Coyote Springs Creek (I). Display/hide their locations on the map
Size of family households: 244 2-persons, 82 3-persons, 95 4-persons, 49 5-persons, 4 6-persons
Size of nonfamily households: 291 1-person, 43 2-persons
188 married couples with children.
83 single-parent households (58 men, 25 women).
88.6% of residents of 93667 zip code speak English at home.
7.1% of residents speak Spanish at home (93% very well, 7% not well).
3.1% of residents speak other Indo-European language at home (100% very well).
0.8% of residents speak Asian or Pacific Island language at home (100% not well).
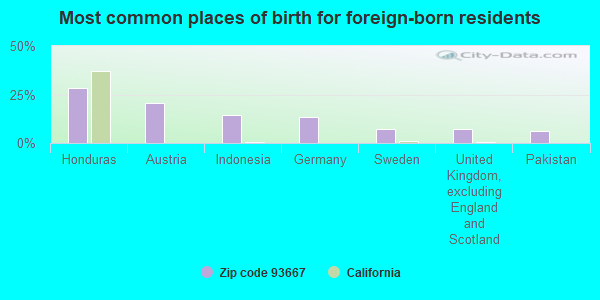
Foreign born population: 97 (5.1%) (69.5% of them are naturalized citizens)
This zip code:
5.1%
Whole state:
26.7%
28%Honduras
21%Austria
15%Indonesia
14%Germany
7%Sweden
7%United Kingdom, excluding England and Scotland
6%Pakistan
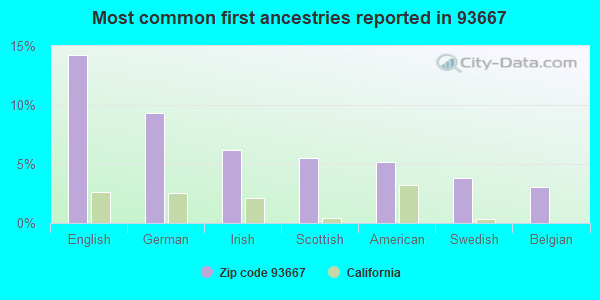
14%English
9%German
6%Irish
6%Scottish
5%American
4%Swedish
3%Belgian
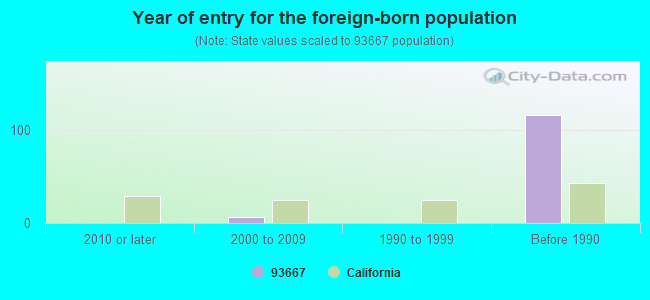
Year of entry for the foreign-born population
02010 or later
62000 to 2009
01990 to 1999
116Before 1990
Public high schools in in zip code 93667 not listed on the city page:
Facilities with environmental interests located in this zip code:
LODGE POLE ELEMENTARY (ALTER.) (33467 LODGE ROAD in TOLLHOUSE, CA)
(National Center for Education Statistics) - STATE ID-6112544 Organizations: SIERRA UNIFIED (SCHOOL DISTRICT)
Housing units lacking complete plumbing facilities: 2.6%
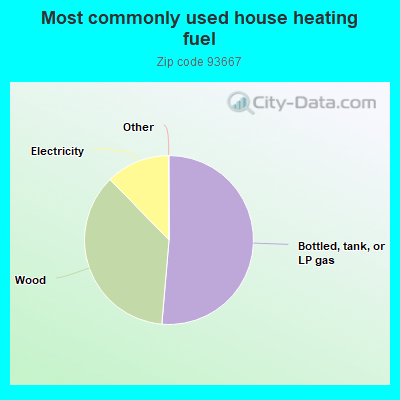
51.4%Bottled, tank, or LP gas
36.4%Wood
12.2%Electricity
Population in 1990: 1,820. Population change in the 1990s: +807 (+44.3%).
Place of birth for U.S.-born residents:
This state: 1,551
Northeast: 37
Midwest: 30
South: 58
West: 86
66% of the 93667 zip code residents lived in the same house 5 years ago. Out of people who lived in different houses, 78% lived in this county. Out of people who lived in different counties, 50% lived in California.
94% of the 93667 zip code residents lived in the same house 1 year ago. Out of people who lived in different houses, 99% moved from this county.
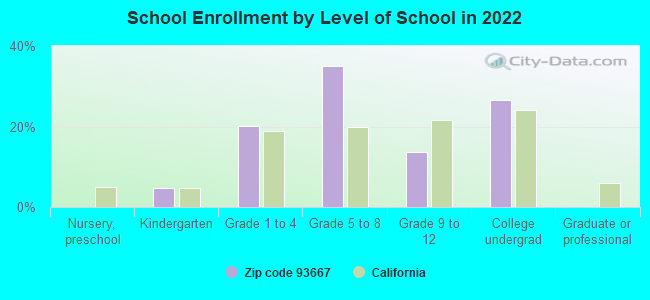
Private vs. public school enrollment:
Students in private schools in grades 1 to 8 (elementary and middle school):
Here:
0.0%
California:
10.5%
Students in private schools in grades 9 to 12 (high school): 12
Here:
27.3%
California:
8.5%
Students in private undergraduate colleges: 11
Here:
13.0%
California:
15.9%
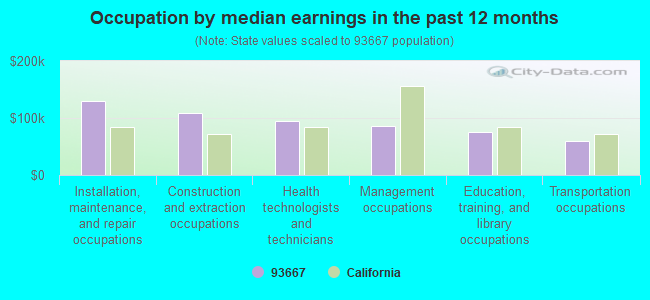
Occupation by median earnings in the past 12 months ($)
130,524Installation, maintenance, and repair occupations
108,040Construction and extraction occupations
94,409Health technologists and technicians
85,673Management occupations
74,812Education, training, and library occupations
59,404Transportation occupations
Top industries in this zip code by the number of employees in 2005:
Construction: New Single-Family Housing Construction (except Operative Builders) (20-49 employees: 1 establishment, 1-4 employees: 1 establishment)
Administrative and Support and Waste Management and Remediation Services: Landscaping Services (10-19: 1, 1-4: 1)
Other Services (except Public Administration): Environment, Conservation and Wildlife Organizations (5-9: 1)
Construction: Roofing Contractors (1-4: 1)
Other Services (except Public Administration): Civic and Social Organizations (1-4: 1)
Other Services (except Public Administration): Commercial and Industrial Machinery and Equipment (except Automotive and Electronic) Repair and Maintenance (1-4: 1)
Construction: Industrial Building Construction (1-4: 1)
Fatal accident statistics in 2014:
Fatal accident count: 1
Vehicles involved in fatal accidents: 1
Fatal accidents caused by drunken drivers: 1
Fatalities: 1
Persons involved in fatal accidents: 1
Pedestrians involved in fatal accidents: 0
Home Mortgage Disclosure Act Aggregated Statistics For Year 2009 (Based on 2 partial tracts)
A) FHA, FSA/RHS & VA Home Purchase Loans
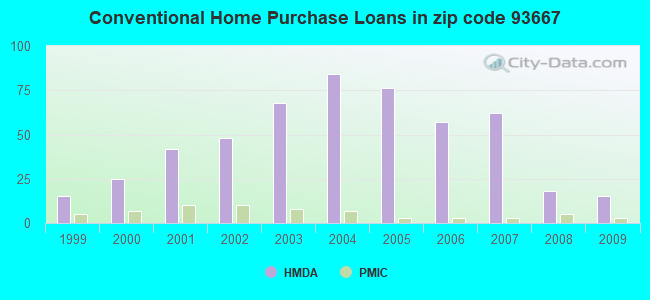
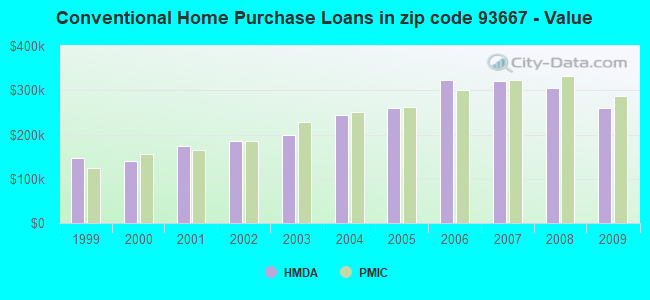
B) Conventional Home Purchase Loans
C) Refinancings
D) Home Improvement Loans
F) Non-occupant Loans on < 5 Family Dwellings (A B C & D)
G) Loans On Manufactured Home Dwelling (A B C & D)
Number
Average Value
Number
Average Value
Number
Average Value
Number
Average Value
Number
Average Value
Number
Average Value
LOANS ORIGINATED
10
$238,978
15
$259,665
54
$238,027
8
$117,551
4
$160,232
4
$160,740
APPLICATIONS APPROVED, NOT ACCEPTED
1
$212,180
2
$192,210
7
$242,391
0
$0
0
$0
2
$89,000
APPLICATIONS DENIED
2
$167,510
4
$377,232
26
$276,538
5
$121,080
2
$164,295
3
$80,877
APPLICATIONS WITHDRAWN
2
$252,785
2
$101,520
14
$258,707
2
$145,345
2
$184,935
3
$136,150
FILES CLOSED FOR INCOMPLETENESS
0
$0
1
$277,490
4
$328,162
1
$103,890
0
$0
0
$0
Aggregated Statistics For Year 2008 (Based on 2 partial tracts)
A) FHA, FSA/RHS & VA Home Purchase Loans
B) Conventional Home Purchase Loans
C) Refinancings
D) Home Improvement Loans
F) Non-occupant Loans on < 5 Family Dwellings (A B C & D)
G) Loans On Manufactured Home Dwelling (A B C & D)
Number
Average Value
Number
Average Value
Number
Average Value
Number
Average Value
Number
Average Value
Number
Average Value
LOANS ORIGINATED
5
$246,220
18
$305,500
47
$279,094
6
$175,460
5
$178,202
4
$131,385
APPLICATIONS APPROVED, NOT ACCEPTED
1
$299,150
4
$451,848
12
$282,057
1
$48,050
2
$590,000
1
$168,860
APPLICATIONS DENIED
1
$405,740
5
$259,214
42
$303,488
5
$72,552
5
$300,364
4
$131,130
APPLICATIONS WITHDRAWN
1
$341,450
3
$300,950
13
$270,512
1
$72,760
1
$354,980
1
$96,780
FILES CLOSED FOR INCOMPLETENESS
0
$0
1
$248,050
4
$392,968
0
$0
0
$0
0
$0
Aggregated Statistics For Year 2007 (Based on 2 partial tracts)
A) FHA, FSA/RHS & VA Home Purchase Loans
B) Conventional Home Purchase Loans
C) Refinancings
D) Home Improvement Loans
F) Non-occupant Loans on < 5 Family Dwellings (A B C & D)
G) Loans On Manufactured Home Dwelling (A B C & D)
Number
Average Value
Number
Average Value
Number
Average Value
Number
Average Value
Number
Average Value
Number
Average Value
LOANS ORIGINATED
1
$305,910
62
$319,957
73
$299,465
13
$128,072
12
$263,896
7
$159,919
APPLICATIONS APPROVED, NOT ACCEPTED
0
$0
11
$260,845
24
$273,625
5
$201,280
4
$291,192
5
$113,974
APPLICATIONS DENIED
0
$0
18
$375,379
57
$326,366
11
$225,713
5
$372,376
8
$129,861
APPLICATIONS WITHDRAWN
1
$184,090
12
$298,469
25
$310,069
2
$39,760
2
$259,890
1
$254,820
FILES CLOSED FOR INCOMPLETENESS
0
$0
1
$324,190
11
$396,051
2
$111,840
0
$0
0
$0
Aggregated Statistics For Year 2006 (Based on 2 partial tracts)
A) FHA, FSA/RHS & VA Home Purchase Loans
B) Conventional Home Purchase Loans
C) Refinancings
D) Home Improvement Loans
F) Non-occupant Loans on < 5 Family Dwellings (A B C & D)
G) Loans On Manufactured Home Dwelling (A B C & D)
Number
Average Value
Number
Average Value
Number
Average Value
Number
Average Value
Number
Average Value
Number
Average Value
LOANS ORIGINATED
1
$157,690
57
$323,896
94
$293,458
25
$140,179
14
$223,561
9
$153,370
APPLICATIONS APPROVED, NOT ACCEPTED
0
$0
16
$269,747
21
$294,215
6
$150,927
1
$267,000
1
$118,440
APPLICATIONS DENIED
0
$0
28
$290,021
44
$284,187
14
$187,643
5
$319,450
9
$135,811
APPLICATIONS WITHDRAWN
0
$0
11
$329,940
31
$295,019
3
$242,860
2
$169,540
2
$183,245
FILES CLOSED FOR INCOMPLETENESS
0
$0
4
$251,515
6
$275,007
1
$164,460
0
$0
0
$0
Aggregated Statistics For Year 2005 (Based on 2 partial tracts)
A) FHA, FSA/RHS & VA Home Purchase Loans
B) Conventional Home Purchase Loans
C) Refinancings
D) Home Improvement Loans
F) Non-occupant Loans on < 5 Family Dwellings (A B C & D)
G) Loans On Manufactured Home Dwelling (A B C & D)
Number
Average Value
Number
Average Value
Number
Average Value
Number
Average Value
Number
Average Value
Number
Average Value
LOANS ORIGINATED
0
$0
76
$260,078
125
$267,471
22
$138,344
17
$242,712
14
$136,279
APPLICATIONS APPROVED, NOT ACCEPTED
0
$0
20
$232,616
19
$256,080
3
$123,177
2
$346,520
3
$113,703
APPLICATIONS DENIED
1
$85,950
35
$242,662
49
$255,464
10
$149,234
5
$293,866
12
$131,638
APPLICATIONS WITHDRAWN
0
$0
22
$241,064
58
$241,565
7
$152,716
3
$295,537
4
$146,272
FILES CLOSED FOR INCOMPLETENESS
0
$0
4
$206,762
8
$234,172
2
$129,775
1
$223,680
1
$93,400
Aggregated Statistics For Year 2004 (Based on 2 partial tracts)
A) FHA, FSA/RHS & VA Home Purchase Loans
B) Conventional Home Purchase Loans
C) Refinancings
D) Home Improvement Loans
F) Non-occupant Loans on < 5 Family Dwellings (A B C & D)
G) Loans On Manufactured Home Dwelling (A B C & D)
Number
Average Value
Number
Average Value
Number
Average Value
Number
Average Value
Number
Average Value
Number
Average Value
LOANS ORIGINATED
0
$0
84
$243,704
118
$209,670
15
$105,829
14
$189,383
10
$130,013
APPLICATIONS APPROVED, NOT ACCEPTED
0
$0
12
$277,319
21
$209,937
3
$52,000
2
$138,575
3
$97,797
APPLICATIONS DENIED
1
$99,150
27
$246,957
48
$197,308
13
$111,229
5
$200,672
7
$81,216
APPLICATIONS WITHDRAWN
0
$0
14
$203,644
42
$200,832
4
$148,812
3
$183,863
3
$140,550
FILES CLOSED FOR INCOMPLETENESS
0
$0
5
$323,984
9
$204,581
1
$33,840
1
$318,770
0
$0
Aggregated Statistics For Year 2003 (Based on 2 partial tracts)
A) FHA, FSA/RHS & VA Home Purchase Loans
B) Conventional Home Purchase Loans
C) Refinancings
D) Home Improvement Loans
F) Non-occupant Loans on < 5 Family Dwellings (A B C & D)
Number
Average Value
Number
Average Value
Number
Average Value
Number
Average Value
Number
Average Value
LOANS ORIGINATED
2
$174,785
68
$199,770
231
$174,371
8
$51,564
16
$152,407
APPLICATIONS APPROVED, NOT ACCEPTED
0
$0
11
$179,629
31
$180,705
1
$61,930
3
$190,293
APPLICATIONS DENIED
0
$0
16
$143,016
65
$163,161
5
$58,002
2
$241,620
APPLICATIONS WITHDRAWN
0
$0
10
$170,587
45
$168,877
1
$170,220
3
$197,513
FILES CLOSED FOR INCOMPLETENESS
0
$0
6
$284,763
9
$203,002
0
$0
1
$133,330
Aggregated Statistics For Year 2002 (Based on 2 partial tracts)
A) FHA, FSA/RHS & VA Home Purchase Loans
B) Conventional Home Purchase Loans
C) Refinancings
D) Home Improvement Loans
F) Non-occupant Loans on < 5 Family Dwellings (A B C & D)
Number
Average Value
Number
Average Value
Number
Average Value
Number
Average Value
Number
Average Value
LOANS ORIGINATED
2
$149,235
48
$185,768
152
$168,261
3
$32,147
9
$118,929
APPLICATIONS APPROVED, NOT ACCEPTED
1
$41,960
5
$156,206
21
$163,318
1
$52,790
2
$64,635
APPLICATIONS DENIED
1
$85,950
10
$142,602
35
$154,136
3
$52,677
2
$151,940
APPLICATIONS WITHDRAWN
0
$0
12
$160,655
38
$155,406
0
$0
2
$113,870
FILES CLOSED FOR INCOMPLETENESS
0
$0
3
$260,907
7
$157,307
0
$0
0
$0
Aggregated Statistics For Year 2001 (Based on 2 partial tracts)
A) FHA, FSA/RHS & VA Home Purchase Loans
B) Conventional Home Purchase Loans
C) Refinancings
D) Home Improvement Loans
F) Non-occupant Loans on < 5 Family Dwellings (A B C & D)
Number
Average Value
Number
Average Value
Number
Average Value
Number
Average Value
Number
Average Value
LOANS ORIGINATED
5
$130,488
42
$174,711
91
$146,702
2
$35,365
6
$106,483
APPLICATIONS APPROVED, NOT ACCEPTED
0
$0
5
$153,566
13
$133,122
1
$37,220
2
$96,275
APPLICATIONS DENIED
2
$83,925
10
$102,264
29
$160,973
1
$30,120
2
$191,195
APPLICATIONS WITHDRAWN
1
$159,050
5
$151,806
28
$154,721
1
$54,140
1
$230,450
FILES CLOSED FOR INCOMPLETENESS
0
$0
2
$121,825
5
$179,556
1
$30,460
0
$0
Aggregated Statistics For Year 2000 (Based on 2 partial tracts)
A) FHA, FSA/RHS & VA Home Purchase Loans
B) Conventional Home Purchase Loans
C) Refinancings
D) Home Improvement Loans
F) Non-occupant Loans on < 5 Family Dwellings (A B C & D)
Number
Average Value
Number
Average Value
Number
Average Value
Number
Average Value
Number
Average Value
LOANS ORIGINATED
2
$131,470
25
$141,099
31
$109,085
7
$33,550
5
$89,676
APPLICATIONS APPROVED, NOT ACCEPTED
0
$0
5
$107,678
6
$164,462
2
$32,485
1
$102,540
APPLICATIONS DENIED
1
$92,720
8
$122,078
18
$136,187
2
$25,210
2
$100,845
APPLICATIONS WITHDRAWN
1
$158,710
3
$135,587
12
$101,717
1
$64,970
0
$0
FILES CLOSED FOR INCOMPLETENESS
0
$0
1
$89,000
3
$128,367
0
$0
1
$114,720
Aggregated Statistics For Year 1999 (Based on 1 partial tract)
A) FHA, FSA/RHS & VA Home Purchase Loans
B) Conventional Home Purchase Loans
C) Refinancings
D) Home Improvement Loans
F) Non-occupant Loans on < 5 Family Dwellings (A B C & D)
Detailed PMIC statistics for the following Tracts:0064.01
2006 - 2018 National Fire Incident Reporting System (NFIRS) incidents
Based on the data from the years 2006 - 2018 the average number of fires per year is 10. The highest number of fires - 28 took place in 2016, and the least - 2 in 2006. The data has a growing trend.
When looking into fire subcategories, the most reports belonged to: Outside Fires (65.9%), and Mobile Property/Vehicle Fires (17.5%).
Fire incident types reported to NFIRS in Zip Code 93667


 Nearest zip codes: 93602, 93657, 93651, 93664, 93621, 93619.


 (Students: 12, Location: 33280 LODGE RD., Grades: 9-12)


 Based on the data from the years 2006 - 2018 the average number of fires per year is 10. The highest number of fires - 28 took place in 2016, and the least - 2 in 2006. The data has a growing trend.
 When looking into fire subcategories, the most reports belonged to: Outside Fires (65.9%), and Mobile Property/Vehicle Fires (17.5%).