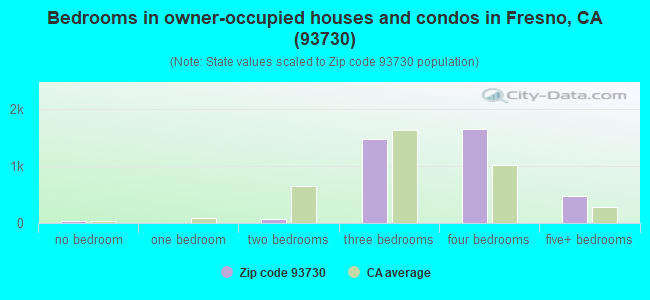
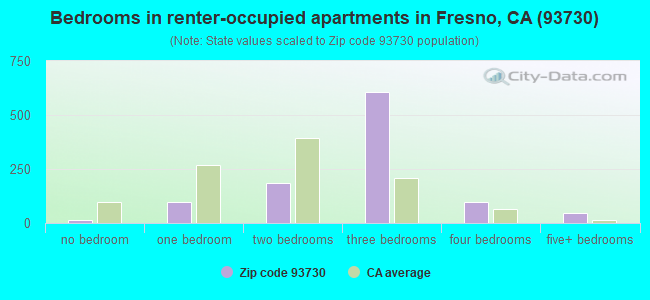
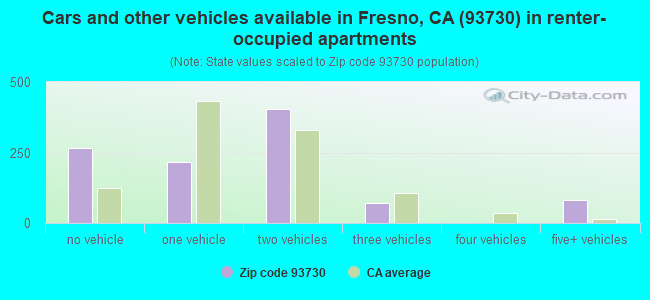
Houses and condos: 5,013 Renter-occupied apartments: 1,048
% of renters here:
22%
State:
44%
March 2022 cost of living index in zip code 93730: 98.2 (near average, U.S. average is 100)
Land area: 7.6 sq. mi. Water area: 0.6 sq. mi.
Population density: 1,618 people per square mile
(low).
OSM Map
Google Map
MSN Map
OSM Map
General Map
Google Map
MSN Map
OSM Map
Google Map
MSN Map
OSM Map
Google Map
MSN Map
Please wait while loading the map...
Real estate property taxes paid for housing units in 2022:
This zip code:
0.9% ($6,302)
California:
0.7% ($4,831)
Median real estate property taxes paid for housing units with mortgages in 2022: $6,193 (0.9%) Median real estate property taxes paid for housing units with no mortgage in 2022: $6,697 (1.0%)
Business Search- 14 Million verified businesses
Males: 6,179
(50.0%)
Females: 6,178
(50.0%)
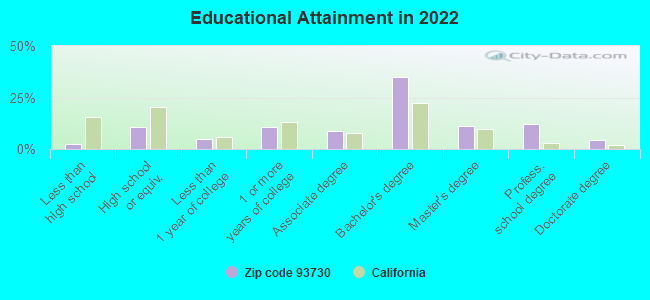
For population 25 years and over in 93730:
High school or higher: 98.9%
Bachelor's degree or higher: 63.9%
Graduate or professional degree: 28.4%
Unemployed: 2.9%
Mean travel time to work (commute): 23.8 minutes
For population 15 years and over in 93730:
Never married: 23.3%
Now married: 64.6%
Separated: 1.0%
Widowed: 4.8%
Divorced: 6.3%
Zip code 93730 compared to state average:
Median household income above state average.
Unemployed percentage below state average.
Black race population percentage below state average.
Hispanic race population percentage below state average.
Median age above state average.
Foreign-born population percentage below state average.
Renting percentage below state average.
Number of rooms per house above state average.
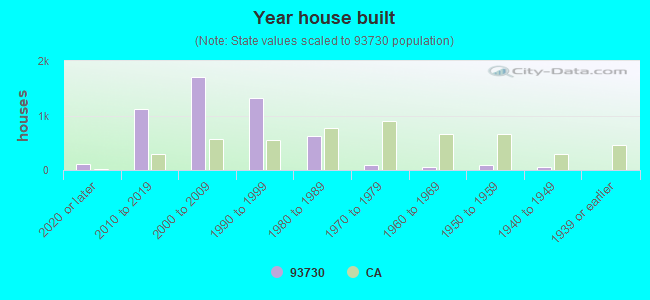
House age significantly below state average.
Number of college students below state average.
Percentage of population with a bachelor's degree or higher above state average.
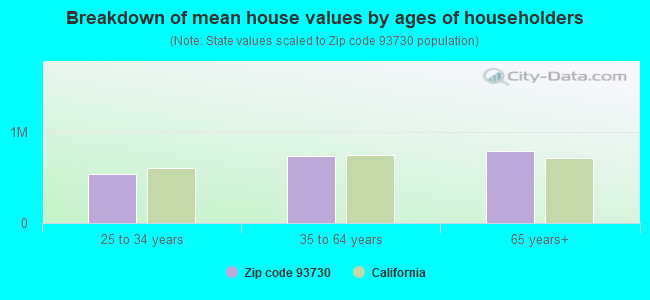
Estimated median house/condo value in 2022: $705,910
93730:
$705,910
California:
$715,900
According to our research of California and other state lists, there were 3 registered sex offenders living in 93730 zip code as of April 24, 2024. The ratio of all residents to sex offenders in zip code 93730 is 3,853 to 1. The ratio of registered sex offenders to all residents in this zip code is much lower than the state average.
Median resident age:
This zip code:
44.4 years
California median age:
37.9 years
Average household size:
This zip code:
2.6 people
California:
2.8 people
Averages for the 2020 tax year for zip code 93730, filed in 2021:
Average Adjusted Gross Income (AGI) in 2020: $174,159 (Individual Income Tax Returns)
Here:
$174,159
State:
$95,910
Salary/wage: $133,250 (reported on 78.4% of returns)
Here:
$133,250
State:
$77,331
(% of AGI for various income ranges: 1410.9% for AGIs below $25k, 3859.8% for AGIs $25k-50k, 7538.6% for AGIs $50k-75k, 9950.6% for AGIs $75k-100k, 21091.2% for AGIs $100k-200k, 105699.7% for AGIs over 200k)
Taxable interest for individuals: $3,700 (reported on 60.2% of returns)
This zip code:
$3,700
California:
$2,294
(% of AGI for various income ranges: 27.2% for AGIs below $25k, 63.8% for AGIs $25k-50k, 112.5% for AGIs $50k-75k, 137.4% for AGIs $75k-100k, 218.2% for AGIs $100k-200k, 2790.8% for AGIs over 200k)
Ordinary dividends: $17,943 (reported on 35.4% of returns)
Here:
$17,943
State:
$10,949
(% of AGI for various income ranges: 73.9% for AGIs below $25k, 130.2% for AGIs $25k-50k, 222.2% for AGIs $50k-75k, 340.9% for AGIs $75k-100k, 457.3% for AGIs $100k-200k, 8438.7% for AGIs over 200k)
Net capital gain/loss in AGI: +$30,752 (reported on 35.2% of returns)
Here:
+$30,752
State:
+$49,306
(% of AGI for various income ranges: 17.1% for AGIs below $25k, 252.7% for AGIs $25k-50k, 243.9% for AGIs $50k-75k, 236.6% for AGIs $75k-100k, 651.6% for AGIs $100k-200k, 15228.7% for AGIs over 200k)
Profit/loss from business: +$43,469 (reported on 21.3% of returns)
Here:
+$43,469
State:
+$15,671
(% of AGI for various income ranges: 134.7% for AGIs below $25k, 403.8% for AGIs $25k-50k, 676.7% for AGIs $50k-75k, 786.6% for AGIs $75k-100k, 1084.0% for AGIs $100k-200k, 10680.0% for AGIs over 200k)
Taxable individual retirement arrangement distribution: $28,318 (reported on 10.6% of returns)
93730:
$28,318
California:
$23,505
(% of AGI for various income ranges: 122.2% for AGIs below $25k, 196.9% for AGIs $25k-50k, 353.3% for AGIs $50k-75k, 631.7% for AGIs $75k-100k, 833.7% for AGIs $100k-200k, 1929.0% for AGIs over 200k)
Self-employed (Keogh) retirement plans: $35,511 (reported on 2.9% of returns)
93730:
$35,511
California:
$30,163
(% of AGI for various income ranges: 131.6% for AGIs $100k-200k, 1412.8% for AGIs over 200k)
Total itemized deductions: $39,105 (reported on 29.7% of returns)
Here:
$39,105
State:
$39,517
(% of AGI for various income ranges: 173.2% for AGIs below $25k, 394.9% for AGIs $25k-50k, 902.5% for AGIs $50k-75k, 1538.9% for AGIs $75k-100k, 2451.8% for AGIs $100k-200k, 11130.3% for AGIs over 200k)
Charity contributions: $11,761 (reported on 25.3% of returns)
Here:
$11,761
State:
$12,598
(% of AGI for various income ranges: 10.1% for AGIs below $25k, 36.2% for AGIs $25k-50k, 124.4% for AGIs $50k-75k, 218.0% for AGIs $75k-100k, 440.6% for AGIs $100k-200k, 3575.4% for AGIs over 200k)
Taxes paid: $9,189 (reported on 29.7% of returns)
93730:
$9,189
State:
$8,807
(% of AGI for various income ranges: 35.0% for AGIs below $25k, 70.4% for AGIs $25k-50k, 261.9% for AGIs $50k-75k, 452.9% for AGIs $75k-100k, 730.9% for AGIs $100k-200k, 2258.5% for AGIs over 200k)
Earned income credit: $1,911 (reported on 5.7% of returns)
Here:
$1,911
State:
$2,074
(% of AGI for various income ranges: 54.1% for AGIs below $25k, 57.3% for AGIs $25k-50k)
Percentage of individuals using paid preparers for their 2020 taxes: 93.8%
Here:
94%
State:
92%
(% for various income ranges: 92.5% for AGIs below $25k, 93.2% for AGIs $25k-50k, 92.3% for AGIs $50k-75k, 95.2% for AGIs $75k-100k, 93.5% for AGIs $100k-200k, 95.8% for AGIs over 200k)
Averages for the 2012 tax year for zip code 93730, filed in 2013:
Average Adjusted Gross Income (AGI) in 2012: $130,851 (Individual Income Tax Returns)
Here:
$130,851
State:
$72,726
Salary/wage: $107,811 (reported on 81.0% of returns)
Here:
$107,811
State:
$59,079
(% of AGI for various income ranges: 73.0% for AGIs below $25k, 66.1% for AGIs $25k-50k, 68.7% for AGIs $50k-75k, 72.1% for AGIs $75k-100k, 74.9% for AGIs $100k-200k, 61.7% for AGIs over 200k)
Taxable interest for individuals: $2,430 (reported on 60.8% of returns)
This zip code:
$2,430
California:
$2,146
(% of AGI for various income ranges: 2.3% for AGIs below $25k, 1.1% for AGIs $25k-50k, 1.1% for AGIs $50k-75k, 0.8% for AGIs $75k-100k, 0.9% for AGIs $100k-200k, 1.2% for AGIs over 200k)
Ordinary dividends: $7,009 (reported on 33.2% of returns)
Here:
$7,009
State:
$9,308
(% of AGI for various income ranges: 3.4% for AGIs below $25k, 2.1% for AGIs $25k-50k, 2.4% for AGIs $50k-75k, 1.5% for AGIs $75k-100k, 1.4% for AGIs $100k-200k, 1.8% for AGIs over 200k)
Net capital gain/loss in AGI: +$13,184 (reported on 31.9% of returns)
Here:
+$13,184
State:
+$30,460
(% of AGI for various income ranges: 0.4% for AGIs $50k-75k, 0.5% for AGIs $75k-100k, 1.1% for AGIs $100k-200k, 5.3% for AGIs over 200k)
Profit/loss from business: +$37,261 (reported on 20.7% of returns)
Here:
+$37,261
State:
+$17,064
(% of AGI for various income ranges: 10.4% for AGIs below $25k, 7.0% for AGIs $25k-50k, 4.5% for AGIs $50k-75k, 5.0% for AGIs $75k-100k, 5.2% for AGIs $100k-200k, 6.3% for AGIs over 200k)
Taxable individual retirement arrangement distribution: $21,150 (reported on 12.1% of returns)
93730:
$21,150
California:
$19,557
(% of AGI for various income ranges: 4.3% for AGIs below $25k, 3.2% for AGIs $25k-50k, 2.6% for AGIs $50k-75k, 3.0% for AGIs $75k-100k, 2.3% for AGIs $100k-200k, 1.4% for AGIs over 200k)
Self-employment retirement plans: $28,462 (reported on 2.8% of returns)
93730:
$28,462
California:
$24,530
Total itemized deductions: $37,542 (20% of AGI, reported on 61.4% of returns)
Here:
$37,542
State:
$34,004
Here:
19.7% of AGI
State:
22.7% of AGI
(% of AGI for various income ranges: 20.8% for AGIs below $25k, 20.9% for AGIs $25k-50k, 19.7% for AGIs $50k-75k, 18.7% for AGIs $75k-100k, 20.2% for AGIs $100k-200k, 15.7% for AGIs over 200k)
Charity contributions: $4,587 (reported on 53.9% of returns)
Here:
$4,587
State:
$4,659
(% of AGI for various income ranges: 1.2% for AGIs below $25k, 2.3% for AGIs $25k-50k, 2.2% for AGIs $50k-75k, 2.2% for AGIs $75k-100k, 2.1% for AGIs $100k-200k, 1.7% for AGIs over 200k)
Taxes paid: $17,726 (reported on 61.4% of returns)
93730:
$17,726
State:
$14,448
(% of AGI for various income ranges: 4.9% for AGIs below $25k, 5.0% for AGIs $25k-50k, 5.7% for AGIs $50k-75k, 6.2% for AGIs $75k-100k, 8.1% for AGIs $100k-200k, 9.3% for AGIs over 200k)
Earned income credit: $1,974 (reported on 6.7% of returns)
Here:
$1,974
State:
$2,286
(% of AGI for various income ranges: 4.0% for AGIs below $25k, 0.6% for AGIs $25k-50k)
Percentage of individuals using paid preparers for their 2012 taxes: 67.0%
Here:
67%
State:
64%
(% for various income ranges: 57.3% for AGIs below $25k, 60.3% for AGIs $25k-50k, 65.5% for AGIs $50k-75k, 62.3% for AGIs $75k-100k, 71.9% for AGIs $100k-200k, 84.5% for AGIs over 200k)
Household received Food Stamps/SNAP in the past 12 months: 139 Household did not receive Food Stamps/SNAP in the past 12 months: 4,480
Women who had a birth in the past 12 months: 63 (62 now married, 0 unmarried) Women who did not have a birth in the past 12 months: 2,554 (1,426 now married, 1,110 unmarried)
Housing units in zip code 93730 with a mortgage: 2,232 (259 second mortgage, 253 both second mortgage and home equity loan) Median monthly owner costs for units with a mortgage: $2,984 Median monthly owner costs for units without a mortgage: $1,084
Residents with income below the poverty level in 2022:
This zip code:
7.0%
Whole state:
12.2%
Residents with income below 50% of the poverty level in 2022:
This zip code:
2.9%
Whole state:
6.2%
Median number of rooms in houses and condos:
Here:
6.8
State:
6.0
Median number of rooms in apartments:
Here:
4.8
State:
3.9
Notable locations in this zip code not listed on our city pages
Size of family households: 1,777 2-persons, 651 3-persons, 773 4-persons, 322 5-persons, 72 6-persons, 35 7-or-more-persons
Size of nonfamily households: 948 1-person, 102 2-persons, 27 3-persons
2,635 married couples with children.
343 single-parent households (64 men, 279 women).
75.6% of residents of 93730 zip code speak English at home.
6.3% of residents speak Spanish at home (86% very well, 10% well, 2% not well, 2% not at all).
9.6% of residents speak other Indo-European language at home (84% very well, 15% well, 1% not well).
7.2% of residents speak Asian or Pacific Island language at home (84% very well, 14% well, 3% not well).
1.3% of residents speak other language at home (76% very well, 24% well).
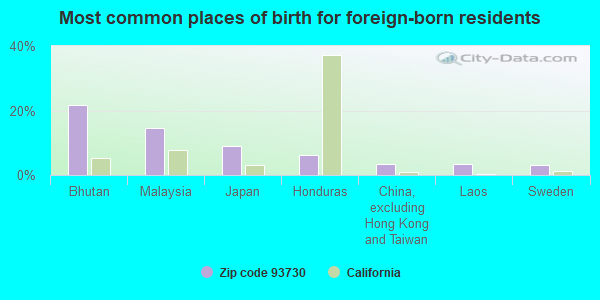
Foreign born population: 1,957 (15.8%) (72.5% of them are naturalized citizens)
This zip code:
15.8%
Whole state:
26.7%
22%Bhutan
15%Malaysia
9%Japan
6%Honduras
3%China, excluding Hong Kong and Taiwan
3%Laos
3%Sweden
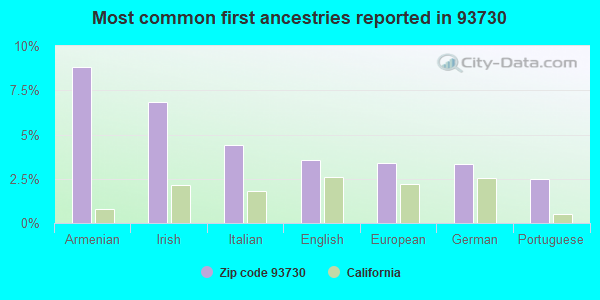
9%Armenian
7%Irish
4%Italian
4%English
3%European
3%German
2%Portuguese
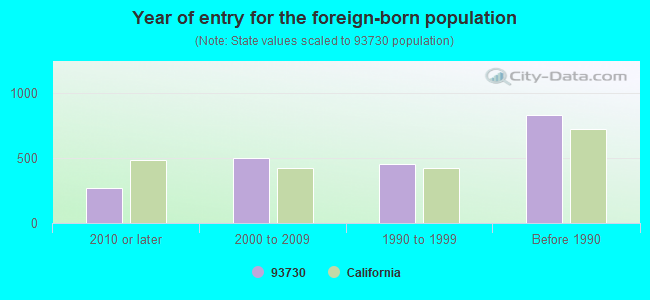
Year of entry for the foreign-born population
2672010 or later
4972000 to 2009
4541990 to 1999
831Before 1990
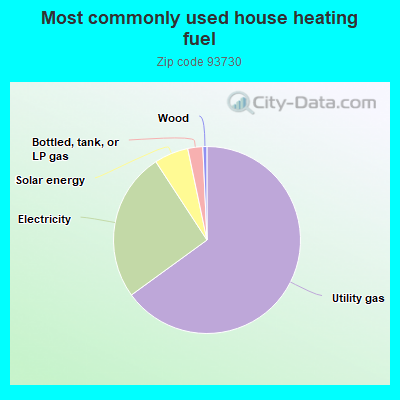
65.0%Utility gas
25.8%Electricity
5.9%Solar energy
2.6%Bottled, tank, or LP gas
0.7%Wood
Place of birth for U.S.-born residents:
This state: 8,570
Northeast: 659
Midwest: 459
South: 295
West: 289
86% of the 93730 zip code residents lived in the same house 1 year ago. Out of people who lived in different houses, 45% moved from this county. Out of people who lived in different houses, 41% moved from different county within same state. Out of people who lived in different houses, 13% moved from different state.
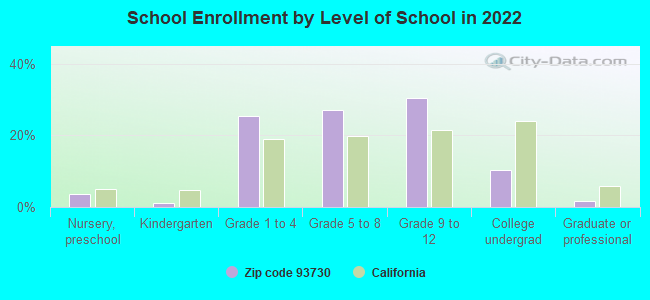
Private vs. public school enrollment:
Students in private schools in grades 1 to 8 (elementary and middle school): 309
Here:
17.8%
California:
10.5%
Students in private schools in grades 9 to 12 (high school): 112
Here:
11.2%
California:
8.5%
Students in private undergraduate colleges: 9
Here:
2.9%
California:
15.9%
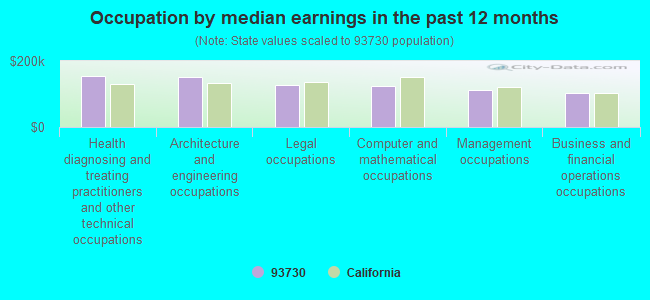
Occupation by median earnings in the past 12 months ($)
154,275Health diagnosing and treating practitioners and other technical occupations
151,425Architecture and engineering occupations
126,800Legal occupations
125,211Computer and mathematical occupations
112,074Management occupations
102,269Business and financial operations occupations
Top industries in this zip code by the number of employees in 2005:
Accommodation and Food Services: Full-Service Restaurants (20-49 employees: 1 establishment)
Health Care and Social Assistance: Offices of Physicians (except Mental Health Specialists) (10-19: 1, 5-9: 1, 1-4: 5)
Construction: New Housing Operative Builders (10-19: 1)
Administrative and Support and Waste Management and Remediation Services: Janitorial Services (10-19: 1)
Construction: Plumbing, Heating, and Air-Conditioning Contractors (5-9: 1)
Finance and Insurance: Other Activities Related to Credit Intermediation (5-9: 1)
Accommodation and Food Services: Limited-Service Restaurants (5-9: 1)
Real Estate and Rental and Leasing: Other Activities Related to Real Estate (1-4: 1)
Fatal accident statistics in 2011:
Fatal accident count: 1
Vehicles involved in fatal accidents: 1
Fatal accidents caused by drunken drivers: 0
Fatalities: 1
Persons involved in fatal accidents: 5
Pedestrians involved in fatal accidents: 1
Most common first names in zip code 93730 among deceased individuals
Name
Count
Lived (average)
James
3
74.0 years
Phyllis
3
88.6 years
Raymond
3
84.3 years
Albert
2
85.5 years
Jennie
2
86.5 years
Charles
2
83.4 years
Helen
2
97.0 years
George
2
78.5 years
Dorothy
2
92.0 years
Harry
2
86.0 years
Most common last names in zip code 93730 among deceased individuals
Last name
Count
Lived (average)
Schneider
3
81.3 years
Anderson
2
92.4 years
Gordon
2
88.5 years
Trujillo
2
90.5 years
Vaughan
2
89.0 years
Businesses in zip code 93730
Nike: 1
Rite Aid: 1
Discuss Fresno, California (CA) on our hugely popular California forum.