Estimated zip code population in 2022: 12,875 Zip code population in 2010: 13,043 Zip code population in 2000: 13,020
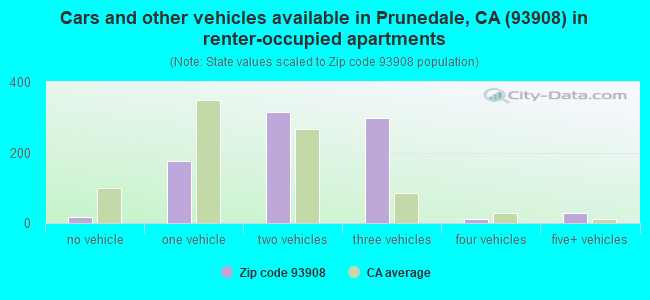
Houses and condos: 4,653 Renter-occupied apartments: 845
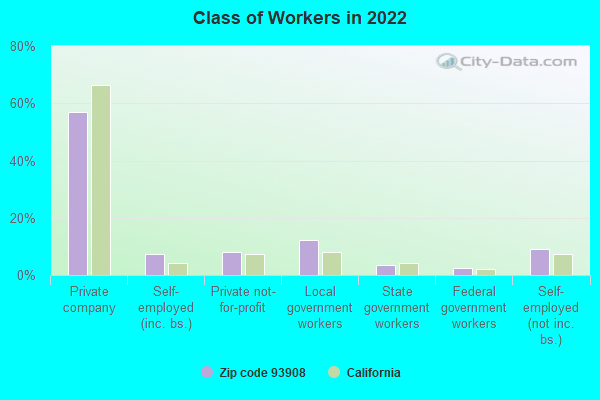
% of renters here:
19%
State:
44%
March 2022 cost of living index in zip code 93908: 105.1 (more than average, U.S. average is 100)
Land area: 214.6 sq. mi. Water area: 2.5 sq. mi.
Population density: 60 people per square mile
(very low).
OSM Map
General Map
Google Map
MSN Map
OSM Map
General Map
Google Map
MSN Map
OSM Map
General Map
Google Map
MSN Map
OSM Map
General Map
Google Map
MSN Map
Please wait while loading the map...
Real estate property taxes paid for housing units in 2022:
This zip code:
0.8% ($8,014)
California:
0.7% ($4,831)
Median real estate property taxes paid for housing units with mortgages in 2022: $8,574 (0.8%) Median real estate property taxes paid for housing units with no mortgage in 2022: $6,960 (0.7%)
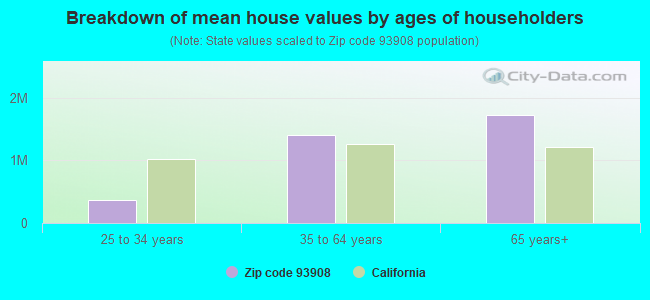
Estimated median house/condo value in 2022: $1,044,695
93908:
$1,044,695
California:
$715,900
According to our research of California and other state lists, there were 12 registered sex offenders living in 93908 zip code as of April 18, 2024. The ratio of all residents to sex offenders in zip code 93908 is 1,013 to 1. The ratio of registered sex offenders to all residents in this zip code is lower than the state average.
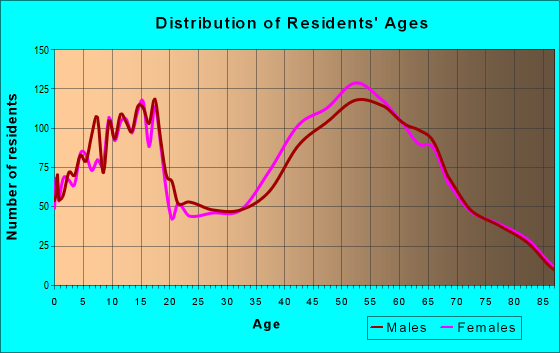
Median resident age:
This zip code:
44.5 years
California median age:
37.9 years
Average household size:
This zip code:
2.8 people
California:
2.8 people
Averages for the 2020 tax year for zip code 93908, filed in 2021:
Average Adjusted Gross Income (AGI) in 2020: $166,546 (Individual Income Tax Returns)
Here:
$166,546
State:
$95,910
Salary/wage: $112,113 (reported on 74.5% of returns)
Here:
$112,113
State:
$77,331
(% of AGI for various income ranges: 1397.6% for AGIs below $25k, 4165.1% for AGIs $25k-50k, 7316.7% for AGIs $50k-75k, 10328.2% for AGIs $75k-100k, 20760.6% for AGIs $100k-200k, 87048.3% for AGIs over 200k)
Taxable interest for individuals: $3,424 (reported on 55.6% of returns)
This zip code:
$3,424
California:
$2,294
(% of AGI for various income ranges: 30.1% for AGIs below $25k, 54.7% for AGIs $25k-50k, 112.5% for AGIs $50k-75k, 201.8% for AGIs $75k-100k, 317.5% for AGIs $100k-200k, 2408.3% for AGIs over 200k)
Ordinary dividends: $18,960 (reported on 38.8% of returns)
Here:
$18,960
State:
$10,949
(% of AGI for various income ranges: 83.4% for AGIs below $25k, 128.6% for AGIs $25k-50k, 266.9% for AGIs $50k-75k, 532.9% for AGIs $75k-100k, 791.0% for AGIs $100k-200k, 10638.0% for AGIs over 200k)
Net capital gain/loss in AGI: +$40,641 (reported on 36.4% of returns)
Here:
+$40,641
State:
+$49,306
(% of AGI for various income ranges: 35.4% for AGIs below $25k, 88.2% for AGIs $25k-50k, 231.1% for AGIs $50k-75k, 355.4% for AGIs $75k-100k, 1120.3% for AGIs $100k-200k, 23623.7% for AGIs over 200k)
Profit/loss from business: +$37,378 (reported on 19.6% of returns)
Here:
+$37,378
State:
+$15,671
(% of AGI for various income ranges: 133.4% for AGIs below $25k, 234.1% for AGIs $25k-50k, 467.2% for AGIs $50k-75k, 569.3% for AGIs $75k-100k, 1705.9% for AGIs $100k-200k, 8425.7% for AGIs over 200k)
Taxable individual retirement arrangement distribution: $29,241 (reported on 13.0% of returns)
93908:
$29,241
California:
$23,505
(% of AGI for various income ranges: 57.2% for AGIs below $25k, 165.9% for AGIs $25k-50k, 391.1% for AGIs $50k-75k, 703.2% for AGIs $75k-100k, 1224.6% for AGIs $100k-200k, 3246.9% for AGIs over 200k)
Self-employed (Keogh) retirement plans: $28,733 (reported on 2.4% of returns)
93908:
$28,733
California:
$30,163
(% of AGI for various income ranges: 143.3% for AGIs $100k-200k, 973.4% for AGIs over 200k)
Total itemized deductions: $41,086 (reported on 30.9% of returns)
Here:
$41,086
State:
$39,517
(% of AGI for various income ranges: 322.2% for AGIs below $25k, 372.0% for AGIs $25k-50k, 1125.8% for AGIs $50k-75k, 2132.9% for AGIs $75k-100k, 3612.5% for AGIs $100k-200k, 12130.3% for AGIs over 200k)
Charity contributions: $10,010 (reported on 26.3% of returns)
Here:
$10,010
State:
$12,598
(% of AGI for various income ranges: 9.9% for AGIs below $25k, 24.1% for AGIs $25k-50k, 94.2% for AGIs $50k-75k, 216.4% for AGIs $75k-100k, 446.5% for AGIs $100k-200k, 3562.9% for AGIs over 200k)
Taxes paid: $9,317 (reported on 30.9% of returns)
93908:
$9,317
State:
$8,807
(% of AGI for various income ranges: 55.8% for AGIs below $25k, 87.3% for AGIs $25k-50k, 246.4% for AGIs $50k-75k, 560.0% for AGIs $75k-100k, 990.6% for AGIs $100k-200k, 2419.1% for AGIs over 200k)
Earned income credit: $1,842 (reported on 5.3% of returns)
Here:
$1,842
State:
$2,074
(% of AGI for various income ranges: 53.4% for AGIs below $25k, 49.0% for AGIs $25k-50k)
Percentage of individuals using paid preparers for their 2020 taxes: 92.6%
Here:
93%
State:
92%
(% for various income ranges: 89.8% for AGIs below $25k, 90.7% for AGIs $25k-50k, 92.3% for AGIs $50k-75k, 93.0% for AGIs $75k-100k, 94.0% for AGIs $100k-200k, 95.0% for AGIs over 200k)
Averages for the 2012 tax year for zip code 93908, filed in 2013:
Average Adjusted Gross Income (AGI) in 2012: $133,796 (Individual Income Tax Returns)
Here:
$133,796
State:
$72,726
Salary/wage: $88,459 (reported on 77.3% of returns)
Here:
$88,459
State:
$59,079
(% of AGI for various income ranges: 73.7% for AGIs below $25k, 71.9% for AGIs $25k-50k, 60.2% for AGIs $50k-75k, 61.5% for AGIs $75k-100k, 65.6% for AGIs $100k-200k, 40.7% for AGIs over 200k)
Taxable interest for individuals: $3,229 (reported on 54.8% of returns)
This zip code:
$3,229
California:
$2,146
(% of AGI for various income ranges: 1.8% for AGIs below $25k, 1.7% for AGIs $25k-50k, 1.5% for AGIs $50k-75k, 1.3% for AGIs $75k-100k, 1.0% for AGIs $100k-200k, 1.4% for AGIs over 200k)
Ordinary dividends: $16,137 (reported on 38.2% of returns)
Here:
$16,137
State:
$9,308
(% of AGI for various income ranges: 4.2% for AGIs below $25k, 2.4% for AGIs $25k-50k, 2.9% for AGIs $50k-75k, 2.7% for AGIs $75k-100k, 2.2% for AGIs $100k-200k, 6.1% for AGIs over 200k)
Net capital gain/loss in AGI: +$26,665 (reported on 34.8% of returns)
Here:
+$26,665
State:
+$30,460
(% of AGI for various income ranges: 0.4% for AGIs $25k-50k, 1.0% for AGIs $50k-75k, 0.5% for AGIs $75k-100k, 1.6% for AGIs $100k-200k, 11.2% for AGIs over 200k)
Profit/loss from business: +$28,894 (reported on 21.2% of returns)
Here:
+$28,894
State:
+$17,064
(% of AGI for various income ranges: 9.6% for AGIs below $25k, 7.0% for AGIs $25k-50k, 7.4% for AGIs $50k-75k, 6.2% for AGIs $75k-100k, 4.4% for AGIs $100k-200k, 3.9% for AGIs over 200k)
Taxable individual retirement arrangement distribution: $25,633 (reported on 14.5% of returns)
93908:
$25,633
California:
$19,557
(% of AGI for various income ranges: 4.5% for AGIs below $25k, 3.4% for AGIs $25k-50k, 5.3% for AGIs $50k-75k, 3.8% for AGIs $75k-100k, 3.3% for AGIs $100k-200k, 2.1% for AGIs over 200k)
Self-employment retirement plans: $21,147 (reported on 2.9% of returns)
93908:
$21,147
California:
$24,530
(% of AGI for various income ranges: 0.8% for AGIs $25k-50k, 0.3% for AGIs $100k-200k, 0.6% for AGIs over 200k)
Total itemized deductions: $43,909 (21% of AGI, reported on 56.1% of returns)
Here:
$43,909
State:
$34,004
Here:
20.7% of AGI
State:
22.7% of AGI
(% of AGI for various income ranges: 23.8% for AGIs below $25k, 18.7% for AGIs $25k-50k, 22.1% for AGIs $50k-75k, 22.1% for AGIs $75k-100k, 21.5% for AGIs $100k-200k, 16.2% for AGIs over 200k)
Charity contributions: $5,708 (reported on 49.9% of returns)
Here:
$5,708
State:
$4,659
(% of AGI for various income ranges: 1.2% for AGIs below $25k, 1.2% for AGIs $25k-50k, 2.0% for AGIs $50k-75k, 1.8% for AGIs $75k-100k, 2.2% for AGIs $100k-200k, 2.2% for AGIs over 200k)
Taxes paid: $20,139 (reported on 56.1% of returns)
93908:
$20,139
State:
$14,448
(% of AGI for various income ranges: 4.9% for AGIs below $25k, 4.2% for AGIs $25k-50k, 5.8% for AGIs $50k-75k, 6.8% for AGIs $75k-100k, 8.1% for AGIs $100k-200k, 9.4% for AGIs over 200k)
Earned income credit: $1,929 (reported on 6.4% of returns)
Here:
$1,929
State:
$2,286
(% of AGI for various income ranges: 3.2% for AGIs below $25k, 0.6% for AGIs $25k-50k)
Percentage of individuals using paid preparers for their 2012 taxes: 68.4%
Here:
68%
State:
64%
(% for various income ranges: 60.3% for AGIs below $25k, 65.9% for AGIs $25k-50k, 71.0% for AGIs $50k-75k, 67.9% for AGIs $75k-100k, 68.8% for AGIs $100k-200k, 82.4% for AGIs over 200k)
Averages for the 2004 tax year for zip code 93908, filed in 2005:
Average Adjusted Gross Income (AGI) in 2004: $105,262 (Individual Income Tax Returns)
Here:
$105,262
State:
$58,600
Salary/wage: $81,928 (reported on 76.4% of returns)
Here:
$81,928
State:
$49,455
(% of AGI for various income ranges: 68.7% for AGIs $10k-25k, 64.4% for AGIs $25k-50k, 65.6% for AGIs $50k-75k, 65.7% for AGIs $75k-100k, 55.9% for AGIs over 100k)
Taxable interest for individuals: $3,960 (reported on 68.4% of returns)
This zip code:
$3,960
California:
$2,365
(% of AGI for various income ranges: 4.4% for AGIs $10k-25k, 2.7% for AGIs $25k-50k, 2.5% for AGIs $50k-75k, 2.4% for AGIs $75k-100k, 2.3% for AGIs over 100k)
Taxable dividends: $6,510 (reported on 47.2% of returns)
Here:
$6,510
State:
$4,746
(% of AGI for various income ranges: 2.9% for AGIs $10k-25k, 2.7% for AGIs $25k-50k, 2.3% for AGIs $50k-75k, 2.1% for AGIs $75k-100k, 3.0% for AGIs over 100k)
Net capital gain/loss: +$20,905 (reported on 41.7% of returns)
Here:
+$20,905
State:
+$23,418
(% of AGI for various income ranges: 0.5% for AGIs $10k-25k, 2.0% for AGIs $25k-50k, 1.5% for AGIs $50k-75k, 2.3% for AGIs $75k-100k, 10.0% for AGIs over 100k)
Profit/loss from business: +$30,647 (reported on 22.0% of returns)
Here:
+$30,647
State:
+$16,826
(% of AGI for various income ranges: 10.7% for AGIs $10k-25k, 9.6% for AGIs $25k-50k, 7.6% for AGIs $50k-75k, 7.3% for AGIs $75k-100k, 5.8% for AGIs over 100k)
IRA payment deduction: $4,072 (reported on 4.8% of returns)
93908:
$4,072
California:
$3,192
(% of AGI for various income ranges: 0.7% for AGIs $10k-25k, 0.4% for AGIs $25k-50k, 0.3% for AGIs $50k-75k, 0.4% for AGIs $75k-100k, 0.1% for AGIs over 100k)
Self-employed pension: $18,387 (reported on 4.2% of returns)
Here:
$18,387
California:
$17,688
(% of AGI for various income ranges: 0.5% for AGIs $25k-50k, 0.2% for AGIs $50k-75k, 0.7% for AGIs $75k-100k, 0.8% for AGIs over 100k)
Total itemized deductions: $38,088 (24% of AGI, reported on 59.9% of returns)
Here:
$38,088
State:
$28,113
Here:
23.7% of AGI
State:
25.3% of AGI
(% of AGI for various income ranges: 23.5% for AGIs $10k-25k, 22.7% for AGIs $25k-50k, 26.7% for AGIs $50k-75k, 28.1% for AGIs $75k-100k, 19.9% for AGIs over 100k)
Charity contributions deductions: $5,261 (3% of AGI, reported on 55.2% of returns)
Here:
$5,261
State:
$3,923
Here:
3.1% of AGI
State:
3.3% of AGI
(% of AGI for various income ranges: 1.3% for AGIs $10k-25k, 1.9% for AGIs $25k-50k, 2.5% for AGIs $50k-75k, 2.3% for AGIs $75k-100k, 2.9% for AGIs over 100k)
Total tax: $21,313 (reported on 83.2% of returns)
93908:
$21,313
State:
$10,761
(% of AGI for various income ranges: 5.4% for AGIs $10k-25k, 7.7% for AGIs $25k-50k, 9.0% for AGIs $50k-75k, 9.7% for AGIs $75k-100k, 18.9% for AGIs over 100k)
Earned income credit: $1,490 (reported on 4.6% of returns)
Here:
$1,490
State:
$1,763
Percentage of individuals using paid preparers for their 2004 taxes: 69.1%
Here:
69%
State:
66%
(% for various income ranges: 59.8% for AGIs below $10k, 64.0% for AGIs $10k-25k, 65.7% for AGIs $25k-50k, 71.4% for AGIs $50k-75k, 71.6% for AGIs $75k-100k, 75.4% for AGIs over 100k)
Likely homosexual households (counted as self-reported same-sex unmarried-partner households)
Lesbian couples: 0.1% of all households
Gay men: 0.0% of all households
Household received Food Stamps/SNAP in the past 12 months: 110 Household did not receive Food Stamps/SNAP in the past 12 months: 4,322
Women who had a birth in the past 12 months: 82 (76 now married, 6 unmarried) Women who did not have a birth in the past 12 months: 2,478 (1,107 now married, 1,365 unmarried)
Housing units in zip code 93908 with a mortgage: 2,399 (236 second mortgage, 189 both second mortgage and home equity loan) Houses without a mortgage: 9
Median monthly owner costs for units with a mortgage: $3,679 Median monthly owner costs for units without a mortgage: $1,123
Residents with income below the poverty level in 2022:
This zip code:
5.1%
Whole state:
12.2%
Residents with income below 50% of the poverty level in 2022:
This zip code:
1.5%
Whole state:
6.2%
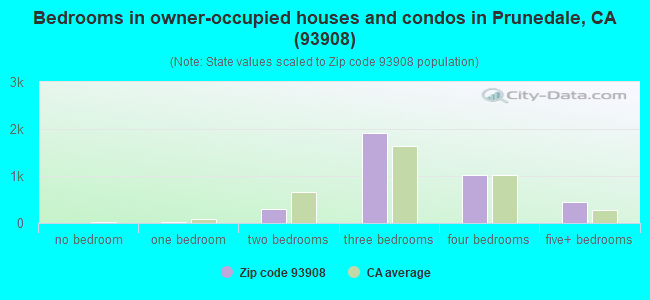
Median number of rooms in houses and condos:
Here:
6.9
State:
6.0
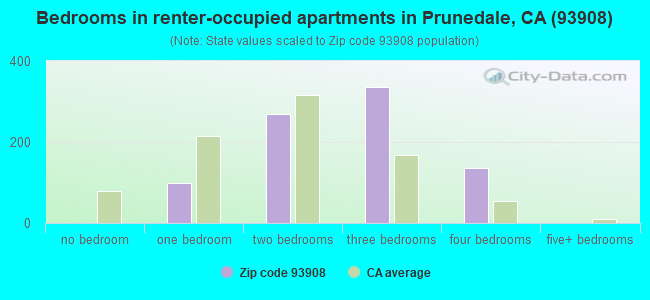
Median number of rooms in apartments:
Here:
5.1
State:
3.9
Notable locations in this zip code not listed on our city pages
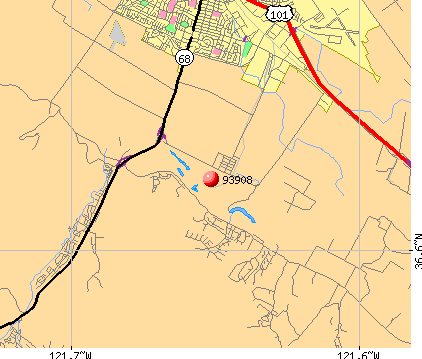
Notable locations in zip code 93908: Camp McCallum (A), Clausens Ranch (B), Watkins Gate (C), Thompson Cabin (D), Morgan Winery (E), Corral de Tierra Country Club (F), Marina Sanitary Landfill (G), Merrill Ranch (H), Marina Gate (I), Thompson Cabin (J), Blanco (K), Lincoln School (L), Jacks Ranger Station (M), Guidotti Ranch (N), Bingamin Ranch (O), Salinas Sewage Treatment Plant (P), Spreckels Volunteer Fire Department (Q), Salinas Rural Fire Protection District Station 2 Laureles Station (R), Salinas Rural Fire Protection District Station 1 Toro Station (S). Display/hide their locations on the map
Creeks: El Toro Creek (A), Harper Creek (B), Limekiln Creek (C), Watson Creek (D), Towne Creek (E), Swamp Creek (F), Quail Creek (G), Chualar Creek (H). Display/hide their locations on the map
Parks in zip code 93908 include: Hilltown Ferry State Historic Landmark (1), Keltron Park (2), Spreckels Memorial Park (3), Toro Regional Park (4), Leguna Seca Recreational Area (5). Display/hide their locations on the map
In group quarters: 74 (-1 institutionalized population)
Size of family households: 1,479 2-persons, 869 3-persons, 579 4-persons, 290 5-persons, 218 6-persons, 111 7-or-more-persons
Size of nonfamily households: 833 1-person, 142 2-persons
2,195 married couples with children.
703 single-parent households (51 men, 652 women).
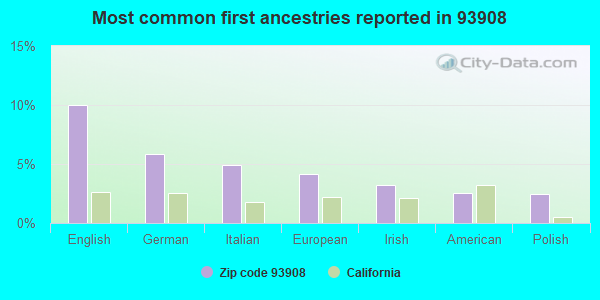
72.3% of residents of 93908 zip code speak English at home.
22.1% of residents speak Spanish at home (66% very well, 9% well, 15% not well, 10% not at all).
1.8% of residents speak other Indo-European language at home (88% very well, 11% well).
3.3% of residents speak Asian or Pacific Island language at home (54% very well, 34% well, 11% not well).
0.3% of residents speak other language at home (100% well).
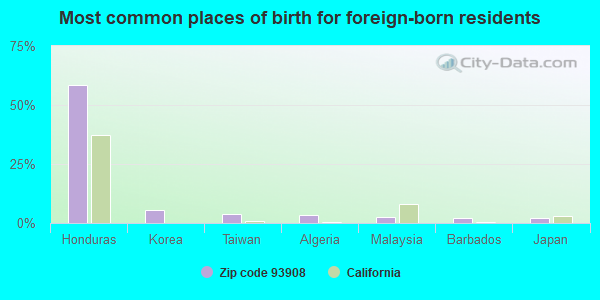
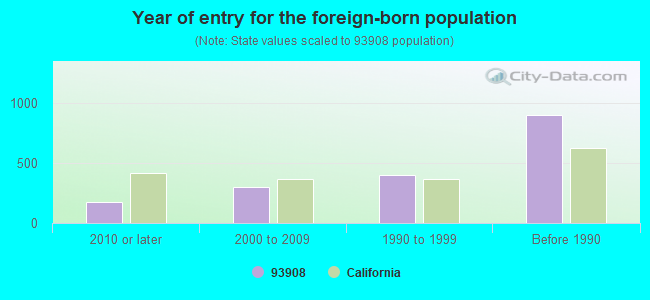
Foreign born population: 1,581 (12.3%) (54.3% of them are naturalized citizens)
Facilities with environmental interests located in this zip code:
7 ELEVEN STORE 14258 (22760 PORTOLA DR in SALINAS, CA) . Federal Facility
STATE MASTER (California - Hazardous Waste Tracking) - HAZARDOU WASTE PROGRAM CRITERIA AND HAZARDOUS AIR POLLUTANT INVENTORY (Inventory of air pollution sources) Small Quantity Generators, between 100 kg and 1000 kg of hazardous waste/month (Resource Conservation and Recovery Act (tracking hazardous waste)) Business SIC classification: GASOLINE SERVICE STATIONS Alternative names: 7-ELEVEN, INC., SOUTHLAND CORP 7 ELEVEN #2233-14258
EBSTONE&SON INC (HIWAYIOI@SPENCERD in SALINAS, CA)
Small Quantity Generators, between 100 kg and 1000 kg of hazardous waste/month (Resource Conservation and Recovery Act (tracking hazardous waste)) - notification Organizations: CRANDALL BRADFORD (CONTACT/OWNER)
CHRISTENSEN FARMS (430 BLANCO RD in SALINAS, CA)
Small Quantity Generators, between 100 kg and 1000 kg of hazardous waste/month (Resource Conservation and Recovery Act (tracking hazardous waste)) - notification Organizations: PAT CHRISTENSEN (CONTACT/OWNER)
JOHN P. CHURCH (2 CORRAL DE TIERRA ROAD in SALINAS, CA)
CRITERIA AND HAZARDOUS AIR POLLUTANT INVENTORY (Inventory of air pollution sources) Business SIC classification: GASOLINE SERVICE STATIONS Alternative names: JOHN P. CHURCH-HWY 68
MONTEREY COUNTY PETROLEUM (100 MONTEREY-SALINAS HWY in SALINAS, CA)
CRITERIA AND HAZARDOUS AIR POLLUTANT INVENTORY (Inventory of air pollution sources) Business SIC classification: GASOLINE SERVICE STATIONS
MUSED MOHSIN (273 RIVER ROAD in SALINAS, CA)
CRITERIA AND HAZARDOUS AIR POLLUTANT INVENTORY (Inventory of air pollution sources) Business SIC classification: GASOLINE SERVICE STATIONS
Housing units lacking complete plumbing facilities: 1.1% Housing units lacking complete kitchen facilities: 1.3%
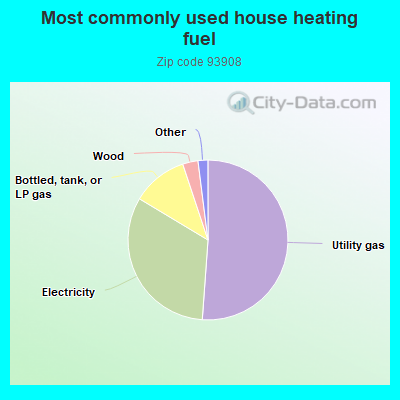
51.2%Utility gas
32.5%Electricity
11.3%Bottled, tank, or LP gas
3.1%Wood
0.9%No fuel used
0.8%Solar energy
Population in 1990: 15,610.
Place of birth for U.S.-born residents:
This state: 8,813
Northeast: 306
Midwest: 704
South: 746
West: 456
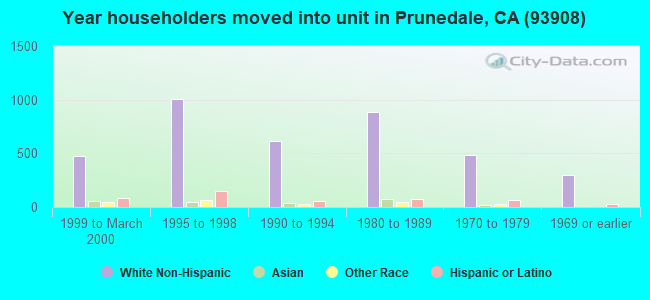
61% of the 93908 zip code residents lived in the same house 5 years ago. Out of people who lived in different houses, 71% lived in this county. Out of people who lived in different counties, 50% lived in California.
93% of the 93908 zip code residents lived in the same house 1 year ago. Out of people who lived in different houses, 66% moved from this county. Out of people who lived in different houses, 25% moved from different county within same state. Out of people who lived in different houses, 8% moved from different state. Out of people who lived in different houses, 2% moved from abroad.
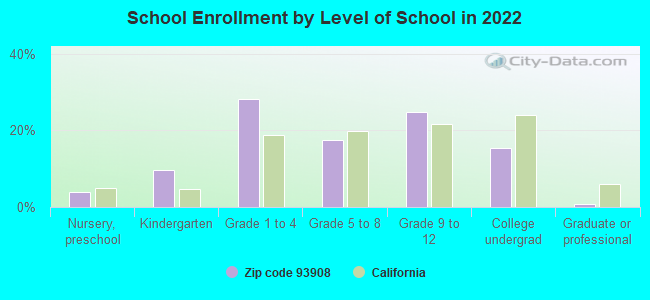
Private vs. public school enrollment:
Students in private schools in grades 1 to 8 (elementary and middle school): 137
Here:
8.6%
California:
10.5%
Students in private schools in grades 9 to 12 (high school): 217
Here:
24.9%
California:
8.5%
Students in private undergraduate colleges: 5
Here:
1.1%
California:
15.9%
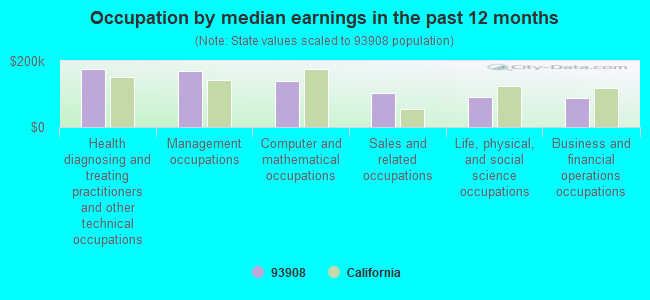
Occupation by median earnings in the past 12 months ($)
174,411Health diagnosing and treating practitioners and other technical occupations
169,478Management occupations
139,108Computer and mathematical occupations
103,726Sales and related occupations
90,827Life, physical, and social science occupations
88,349Business and financial operations occupations
Companies with biggest federal contracts located in this zip code (SALINAS, CA):
E Z M T VALVES COMPANY INC (22260 DAVENRICH ST; small business) : $5,621,123 in 4 contractsfrom 1999 to 2001
$4,992,000 with Defense Logistics Agency for Medical and Surgical Instruments, Equipment, and Supplies. Signed on 1999-10-18. Completion date: 1999-12-02.
$386,937 with Army for Laboratory Equipment and Supplies. Signed on 2000-08-22. Completion date: 2000-10-27.
$198,000 with Food and Drug Administration for Physical Properties Testing and Inspection. Signed on 2000-09-15. Completion date: 2000-11-15.
$44,186 with Army for Laboratory Equipment and Supplies. Signed on 2001-10-25. Completion date: 2001-12-04.
P & M LIGON INC (19040 PORTOLA DR; small business) : $1,379,901 in 59 contractsfrom 1999 to 2005
Contracts for Fruits and Vegetables by Defense Logistics Agency Signed by year:2000: $409,221; 2001: $229,546; 2002: $493,629; 2003: $0; 2004: $146,491; 2005: $71,651; 2006: $0.
Biggest contracts:
$48,950 with Defense Logistics Agency for Fruits and Vegetables. Signed on 2002-03-01. Completion date: 2002-03-01.
$48,836, same as above.Signed on 2001-07-13. Completion date: 2001-07-13.
$39,903, same as above.Signed on 2002-06-19. Completion date: 2002-06-19.
$39,820, same as above.Signed on 2002-06-26. Completion date: 2002-06-26.
TITAN PROCUREMENT LLC (22730 PORTOLA DRIVE; small business) : $584,695 in 19 contractsfrom 2001 to 2002
Contracts for Fruits and Vegetables by Defense Logistics Agency Signed by year:2000: $0; 2001: $58,505; 2002: $526,190; 2003: $0; 2004: $0; 2005: $0; 2006: $0.
Biggest contracts:
$49,780 with Defense Logistics Agency for Fruits and Vegetables. Signed on 2002-03-25. Completion date: 2002-03-25.
$46,110, same as above.Signed on 2002-03-18. Completion date: 2002-03-18.
$33,065, same as above.Signed on 2002-03-04. Completion date: 2002-03-04.
$33,059, same as above.Signed on 2002-02-19. Completion date: 2002-02-19.
ATHENA STRATEGIES, INC (27220 CORTINA WAY; small business) : $576,659 in 5 contractsfrom 2000 to 2001
Contracts for Program Management/Support Services, Logistics Support Services, Program Review/Development Services, Training/Curriculum Development by Army, Navy Signed by year:2000: $384,207; 2001: $192,452; 2002: $0; 2003: $0; 2004: $0; 2005: $0; 2006: $0.
Biggest contracts:
$185,000 with Army for Program Management/Support Services. Taking place in VA. Signed on 2000-12-07. Completion date: 2001-09-28.
$100,000 with Navy for Logistics Support Services. Taking place in VA. Signed on 2000-11-24. Completion date: 2000-12-08.
$99,952 with Navy for Program Review/Development Services. Taking place in VA. Signed on 2001-07-26. Completion date: 2001-09-30.
$99,207 with Army for Training/Curriculum Development. Taking place in VA. Signed on 2000-06-30. Completion date: 2000-10-18.
ALL ADVANTAGE ELECTRIC OF CALI (14 SPRECKLES LANE SUITE, S; small business) : $214,699 in 5 contractsfrom 2000 to 2004
Contracts for Maintenance, Repair or Alteration of Real Property -- Other Utilities, Lease or Rental of Equipment -- Electric Wire, and Power and Distribution Equipment, Maintenance, Repair and Rebuilding of Equipment -- Electric Wire, and Power and Distribution Equipment, ADPE System Configuration by Army Signed by year:2000: $82,855; 2001: $107,604; 2002: $0; 2003: $0; 2004: $24,240; 2005: $0; 2006: $0.
Biggest contracts:
$55,343 with Army for Maintenance, Repair or Alteration of Real Property -- Other Utilities. Signed on 2001-02-05. Completion date: 2001-02-23.
$52,261, same as above.Signed on 2001-09-05. Completion date: 2001-08-31.
$45,590 with Army for Lease or Rental of Equipment -- Electric Wire, and Power and Distribution Equipment. Signed on 2000-09-28. Completion date: 2000-01-31.
$37,265 with Army for Maintenance, Repair and Rebuilding of Equipment -- Electric Wire, and Power and Distribution Equipment. Signed on 2000-06-07. Completion date: 2000-06-15.
ISHIZUE, KENNETH K , M D , A P (12705 CORTE CORDILLERA; small business) : $182,752 in 5 contractsfrom 2000 to 2004
Contracts for Orthopedic Services by Army Signed by year:2000: $45,500; 2001: $0; 2002: $45,500; 2003: $45,500; 2004: $46,252; 2005: $0; 2006: $0.
Biggest contracts:
$46,865 with Army for Orthopedic Services. Signed on 2004-10-04. Completion date: 2005-09-30.
$45,500, same as above.Signed on 2003-10-20. Completion date: 2003-09-30.
$45,500, same as above.Signed on 2002-10-17. Completion date: 2003-09-30.
$45,500, same as above.Signed on 2000-10-18. Completion date: 2001-09-30.
$58,690 with Forest Service for Archeological/Paleontological Studies. Signed on 2003-09-15. Completion date: 2004-09-15.
$58,690, same as above.Signed on 2003-09-15. Completion date: 2004-09-15.
OPBL LABORATORY (27430 VISTA DEL TORO PL; small business)
$44,000 with Navy for Environmental Studies and Assessments. Signed on 2005-07-14. Completion date: 2005-07-15.
CARR MATH SERVICES (12770 OAK GLEN DR; small business)
$33,000 with Navy for Vocational/Technical. Signed on 2005-06-01. Completion date: 2005-09-30.
WILLIAMS, D D EQUIPMENT COMPAN (487 EL CAMINO REAL SOUTH; small business) : $16,253 in 2 contractsfrom 2004 to 2006
$8,972 with Army for Miscellaneous Vehicular Components. Signed on 2004-09-11. Completion date: 2004-09-25.
$7,281 with Army for Maintenance, Repair and Rebuilding of Equipment -- Vehicular Equipment Components. Signed on 2006-02-03. Completion date: 2006-02-15.
Top industries in this zip code by the number of employees in 2005:
2005 - 2018 National Fire Incident Reporting System (NFIRS) incidents
According to the data from the years 2005 - 2018 the average number of fire incidents per year is 41. The highest number of fires - 110 took place in 2007, and the least - 9 in 2006. The data has a rising trend.
When looking into fire subcategories, the most reports belonged to: Outside Fires (49.5%), and Mobile Property/Vehicle Fires (26.4%).
Fire incident types reported to NFIRS in Zip Code 93908
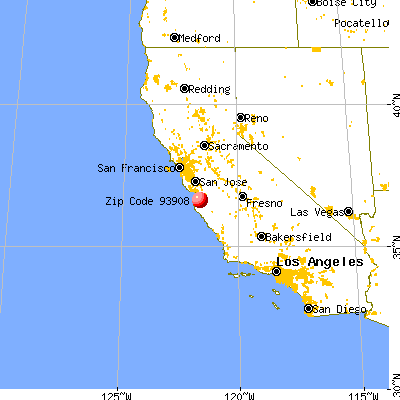


 Nearest zip codes: 93901, 93905, 93962, 93906, 93907, 93933.
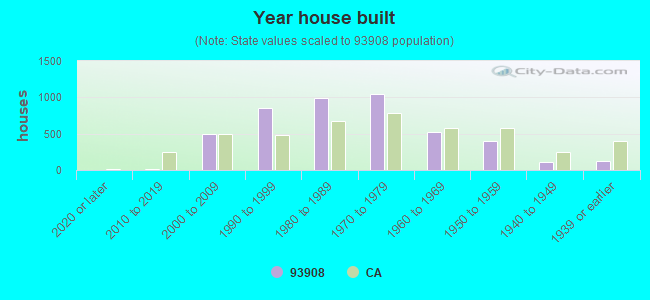


 . Federal Facility
 According to the data from the years 2005 - 2018 the average number of fire incidents per year is 41. The highest number of fires - 110 took place in 2007, and the least - 9 in 2006. The data has a rising trend.
 When looking into fire subcategories, the most reports belonged to: Outside Fires (49.5%), and Mobile Property/Vehicle Fires (26.4%).