Estimated zip code population in 2022: 2,013 Zip code population in 2010: 1,559 Zip code population in 2000: 1,610
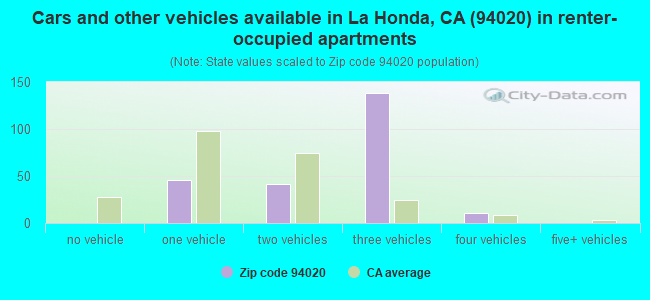
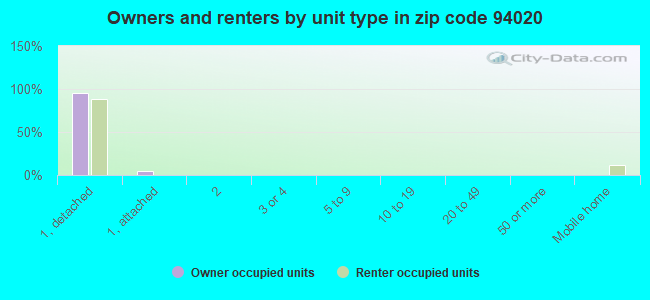
Houses and condos: 1,022 Renter-occupied apartments: 237
% of renters here:
28%
State:
44%
March 2022 cost of living index in zip code 94020: 100.3 (near average, U.S. average is 100)
Land area: 55.8 sq. mi. Water area: 0.0 sq. mi.
Population density: 36 people per square mile
(very low).
OSM Map
General Map
Google Map
MSN Map
OSM Map
General Map
Google Map
MSN Map
OSM Map
General Map
Google Map
MSN Map
OSM Map
General Map
Google Map
MSN Map
Please wait while loading the map...
Real estate property taxes paid for housing units in 2022:
This zip code:
0.8% ($8,802)
California:
0.7% ($4,831)
Median real estate property taxes paid for housing units with mortgages in 2022: $7,917 (0.7%) Median real estate property taxes paid for housing units with no mortgage in 2022: $9,764 (0.9%)
Business Search- 14 Million verified businesses
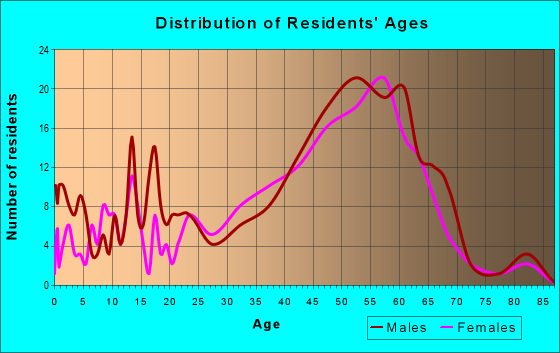
Males: 1,000
(49.7%)
Females: 1,012
(50.3%)
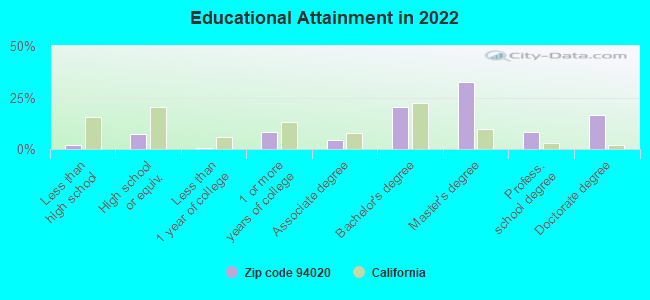
For population 25 years and over in 94020:
High school or higher: 100.4%
Bachelor's degree or higher: 79.6%
Graduate or professional degree: 58.7%
Unemployed: 0.5%
Mean travel time to work (commute): 36.8 minutes
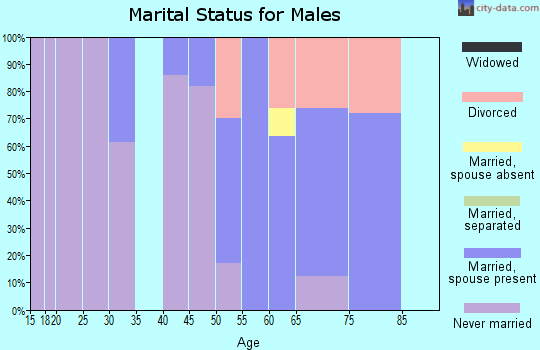
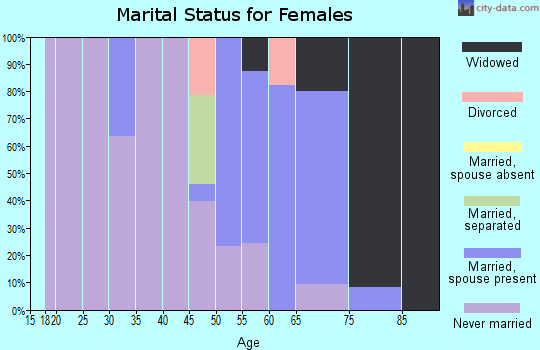
For population 15 years and over in 94020:
Never married: 19.7%
Now married: 72.0%
Separated: 0.0%
Widowed: 0.6%
Divorced: 7.7%
Zip code 94020 compared to state average:
Median household income significantly above state average.
Median house value above state average.
Unemployed percentage significantly below state average.
Black race population percentage significantly below state average.
Hispanic race population percentage significantly below state average.
Median age above state average.
Renting percentage below state average.
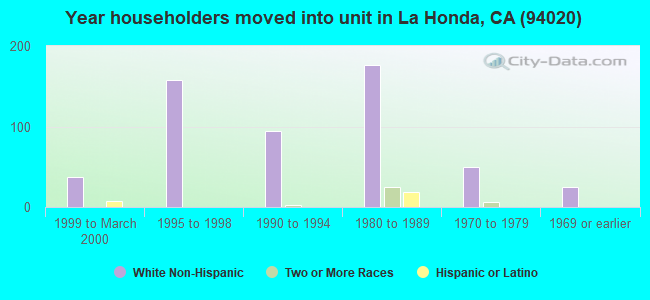
Length of stay since moving in significantly above state average.
House age above state average.
Number of college students below state average.
Percentage of population with a bachelor's degree or higher significantly above state average.
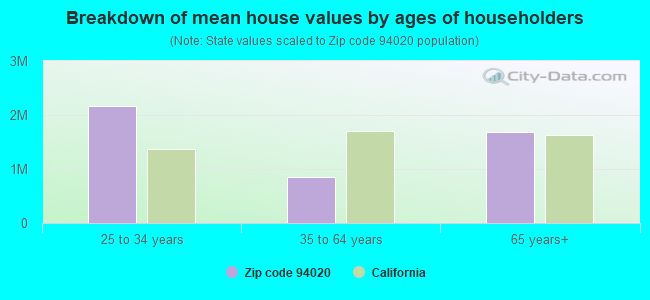
Estimated median house/condo value in 2022: $1,159,035
94020:
$1,159,035
California:
$715,900
According to our research of California and other state lists, there was 1 registered sex offender living in 94020 zip code as of April 17, 2024. The ratio of all residents to sex offenders in zip code 94020 is 1,186 to 1. The ratio of registered sex offenders to all residents in this zip code is lower than the state average.
Median resident age:
This zip code:
45.7 years
California median age:
37.9 years
Average household size:
This zip code:
2.3 people
California:
2.8 people
Averages for the 2020 tax year for zip code 94020, filed in 2021:
Average Adjusted Gross Income (AGI) in 2020: $153,642 (Individual Income Tax Returns)
Here:
$153,642
State:
$95,910
Salary/wage: $136,800 (reported on 75.0% of returns)
Here:
$136,800
State:
$77,331
(% of AGI for various income ranges: 1260.0% for AGIs below $25k, 4038.6% for AGIs $25k-50k, 7462.5% for AGIs $50k-75k, 10702.5% for AGIs $75k-100k, 24143.8% for AGIs $100k-200k, 95624.0% for AGIs over 200k)
Taxable interest for individuals: $1,622 (reported on 52.6% of returns)
This zip code:
$1,622
California:
$2,294
(% of AGI for various income ranges: 36.7% for AGIs below $25k, 57.1% for AGIs $25k-50k, 17.5% for AGIs $50k-75k, 52.5% for AGIs $75k-100k, 248.7% for AGIs $100k-200k, 720.0% for AGIs over 200k)
Ordinary dividends: $11,027 (reported on 39.5% of returns)
Here:
$11,027
State:
$10,949
(% of AGI for various income ranges: 160.0% for AGIs below $25k, 154.3% for AGIs $25k-50k, 230.0% for AGIs $50k-75k, 232.5% for AGIs $75k-100k, 603.8% for AGIs $100k-200k, 4872.0% for AGIs over 200k)
Net capital gain/loss in AGI: +$47,304 (reported on 36.8% of returns)
Here:
+$47,304
State:
+$49,306
(% of AGI for various income ranges: 16.7% for AGIs below $25k, 48.6% for AGIs $25k-50k, 215.0% for AGIs $50k-75k, 490.0% for AGIs $75k-100k, 1266.2% for AGIs $100k-200k, 23812.0% for AGIs over 200k)
Profit/loss from business: +$19,424 (reported on 22.4% of returns)
Here:
+$19,424
State:
+$15,671
(% of AGI for various income ranges: 730.0% for AGIs below $25k, 2095.0% for AGIs $50k-75k, 1090.0% for AGIs $100k-200k, 2308.0% for AGIs over 200k)
Taxable individual retirement arrangement distribution: $27,036 (reported on 14.5% of returns)
94020:
$27,036
California:
$23,505
(% of AGI for various income ranges: 2372.5% for AGIs $50k-75k, 1748.8% for AGIs $100k-200k, 1252.0% for AGIs over 200k)
Total itemized deductions: $39,005 (reported on 25.0% of returns)
Here:
$39,005
State:
$39,517
(% of AGI for various income ranges: 938.6% for AGIs $25k-50k, 1495.0% for AGIs $75k-100k, 2390.0% for AGIs $100k-200k, 8488.0% for AGIs over 200k)
Charity contributions: $7,520 (reported on 19.7% of returns)
Here:
$7,520
State:
$12,598
(% of AGI for various income ranges: 92.5% for AGIs $50k-75k, 201.3% for AGIs $100k-200k, 1860.0% for AGIs over 200k)
Taxes paid: $9,284 (reported on 25.0% of returns)
94020:
$9,284
State:
$8,807
(% of AGI for various income ranges: 217.1% for AGIs $25k-50k, 382.5% for AGIs $75k-100k, 786.2% for AGIs $100k-200k, 1660.0% for AGIs over 200k)
Earned income credit: $667 (reported on 3.9% of returns)
Here:
$667
State:
$2,074
(% of AGI for various income ranges: 33.3% for AGIs below $25k)
Percentage of individuals using paid preparers for their 2020 taxes: 89.5%
Here:
89%
State:
92%
(% for various income ranges: 85.7% for AGIs below $25k, 83.3% for AGIs $25k-50k, 87.5% for AGIs $50k-75k, 75.0% for AGIs $75k-100k, 95.0% for AGIs $100k-200k, 100.0% for AGIs over 200k)
Averages for the 2012 tax year for zip code 94020, filed in 2013:
Average Adjusted Gross Income (AGI) in 2012: $104,405 (Individual Income Tax Returns)
Here:
$104,405
State:
$72,726
Salary/wage: $89,038 (reported on 77.2% of returns)
Here:
$89,038
State:
$59,079
(% of AGI for various income ranges: 68.4% for AGIs below $25k, 67.7% for AGIs $25k-50k, 68.4% for AGIs $50k-75k, 72.9% for AGIs $75k-100k, 73.8% for AGIs $100k-200k, 58.2% for AGIs over 200k)
Taxable interest for individuals: $1,071 (reported on 53.2% of returns)
This zip code:
$1,071
California:
$2,146
(% of AGI for various income ranges: 0.6% for AGIs below $25k, 0.9% for AGIs $25k-50k, 0.6% for AGIs $50k-75k, 0.5% for AGIs $75k-100k, 0.7% for AGIs $100k-200k, 0.4% for AGIs over 200k)
Ordinary dividends: $8,120 (reported on 38.0% of returns)
Here:
$8,120
State:
$9,308
(% of AGI for various income ranges: 4.8% for AGIs below $25k, 2.3% for AGIs $25k-50k, 2.9% for AGIs $50k-75k, 1.6% for AGIs $75k-100k, 2.7% for AGIs $100k-200k, 3.4% for AGIs over 200k)
Net capital gain/loss in AGI: +$27,922 (reported on 29.1% of returns)
Here:
+$27,922
State:
+$30,460
(% of AGI for various income ranges: 2.3% for AGIs $100k-200k, 16.3% for AGIs over 200k)
Profit/loss from business: +$23,005 (reported on 27.8% of returns)
Here:
+$23,005
State:
+$17,064
(% of AGI for various income ranges: 13.3% for AGIs below $25k, 15.3% for AGIs $25k-50k, 9.8% for AGIs $50k-75k, 3.1% for AGIs $75k-100k, 4.8% for AGIs $100k-200k, 5.3% for AGIs over 200k)
Taxable individual retirement arrangement distribution: $19,989 (reported on 11.4% of returns)
94020:
$19,989
California:
$19,557
(% of AGI for various income ranges: 13.0% for AGIs below $25k, 6.9% for AGIs $50k-75k, 4.4% for AGIs $100k-200k)
Self-employment retirement plans: $20,550 (reported on 2.5% of returns)
94020:
$20,550
California:
$24,530
Total itemized deductions: $34,798 (22% of AGI, reported on 53.2% of returns)
Here:
$34,798
State:
$34,004
Here:
21.8% of AGI
State:
22.7% of AGI
(% of AGI for various income ranges: 19.2% for AGIs $25k-50k, 16.6% for AGIs $50k-75k, 18.3% for AGIs $75k-100k, 18.8% for AGIs $100k-200k, 18.0% for AGIs over 200k)
Charity contributions: $2,681 (reported on 39.2% of returns)
Here:
$2,681
State:
$4,659
(% of AGI for various income ranges: 0.5% for AGIs $25k-50k, 0.6% for AGIs $50k-75k, 0.9% for AGIs $75k-100k, 0.8% for AGIs $100k-200k, 1.4% for AGIs over 200k)
Taxes paid: $15,405 (reported on 53.2% of returns)
94020:
$15,405
State:
$14,448
(% of AGI for various income ranges: 4.3% for AGIs $25k-50k, 4.4% for AGIs $50k-75k, 6.4% for AGIs $75k-100k, 8.3% for AGIs $100k-200k, 9.5% for AGIs over 200k)
Earned income credit: $1,700 (reported on 6.3% of returns)
Here:
$1,700
State:
$2,286
(% of AGI for various income ranges: 3.8% for AGIs below $25k)
Percentage of individuals using paid preparers for their 2012 taxes: 54.4%
Here:
54%
State:
64%
(% for various income ranges: 36.8% for AGIs below $25k, 57.1% for AGIs $25k-50k, 54.5% for AGIs $50k-75k, 55.6% for AGIs $75k-100k, 58.8% for AGIs $100k-200k, 77.8% for AGIs over 200k)
Averages for the 2004 tax year for zip code 94020, filed in 2005:
Average Adjusted Gross Income (AGI) in 2004: $95,447 (Individual Income Tax Returns)
Here:
$95,447
State:
$58,600
Salary/wage: $82,943 (reported on 79.3% of returns)
Here:
$82,943
State:
$49,455
(% of AGI for various income ranges: 86.1% for AGIs below $10k, 69.2% for AGIs $10k-25k, 75.2% for AGIs $25k-50k, 82.6% for AGIs $50k-75k, 77.3% for AGIs $75k-100k, 65.1% for AGIs over 100k)
Taxable interest for individuals: $1,385 (reported on 58.8% of returns)
This zip code:
$1,385
California:
$2,365
(% of AGI for various income ranges: 11.1% for AGIs below $10k, 2.0% for AGIs $10k-25k, 1.3% for AGIs $25k-50k, 0.8% for AGIs $50k-75k, 0.8% for AGIs $75k-100k, 0.7% for AGIs over 100k)
Taxable dividends: $4,278 (reported on 42.1% of returns)
Here:
$4,278
State:
$4,746
(% of AGI for various income ranges: 11.5% for AGIs below $10k, 4.5% for AGIs $10k-25k, 2.6% for AGIs $25k-50k, 1.2% for AGIs $50k-75k, 0.8% for AGIs $75k-100k, 1.9% for AGIs over 100k)
Net capital gain/loss: +$25,327 (reported on 33.0% of returns)
Here:
+$25,327
State:
+$23,418
(% of AGI for various income ranges: -11.1% for AGIs below $10k, 1.5% for AGIs $10k-25k, 0.7% for AGIs $25k-50k, 0.1% for AGIs $50k-75k, -0.1% for AGIs $75k-100k, 12.5% for AGIs over 100k)
Profit/loss from business: +$18,692 (reported on 29.1% of returns)
Here:
+$18,692
State:
+$16,826
(% of AGI for various income ranges: 21.7% for AGIs below $10k, 19.9% for AGIs $10k-25k, 6.9% for AGIs $25k-50k, 8.0% for AGIs $50k-75k, 4.4% for AGIs $75k-100k, 4.9% for AGIs over 100k)
IRA payment deduction: $3,000 (reported on 4.2% of returns)
94020:
$3,000
California:
$3,192
Self-employed pension: $19,484 (reported on 4.0% of returns)
Here:
$19,484
California:
$17,688
Total itemized deductions: $32,423 (21% of AGI, reported on 54.1% of returns)
Here:
$32,423
State:
$28,113
Here:
21.5% of AGI
State:
25.3% of AGI
(% of AGI for various income ranges: 76.2% for AGIs below $10k, 17.7% for AGIs $10k-25k, 19.1% for AGIs $25k-50k, 25.4% for AGIs $50k-75k, 23.0% for AGIs $75k-100k, 16.3% for AGIs over 100k)
Charity contributions deductions: $2,382 (1% of AGI, reported on 45.9% of returns)
Here:
$2,382
State:
$3,923
Here:
1.5% of AGI
State:
3.3% of AGI
(% of AGI for various income ranges: 5.0% for AGIs below $10k, 0.6% for AGIs $25k-50k, 1.6% for AGIs $50k-75k, 1.3% for AGIs $75k-100k, 1.1% for AGIs over 100k)
Total tax: $19,153 (reported on 87.4% of returns)
94020:
$19,153
State:
$10,761
(% of AGI for various income ranges: 7.1% for AGIs below $10k, 7.4% for AGIs $10k-25k, 9.2% for AGIs $25k-50k, 10.7% for AGIs $50k-75k, 11.4% for AGIs $75k-100k, 20.7% for AGIs over 100k)
Earned income credit: $930 (reported on 5.6% of returns)
Here:
$930
State:
$1,763
Percentage of individuals using paid preparers for their 2004 taxes: 54.1%
Here:
54%
State:
66%
(% for various income ranges: 48.7% for AGIs below $10k, 40.8% for AGIs $10k-25k, 47.9% for AGIs $25k-50k, 52.6% for AGIs $50k-75k, 58.8% for AGIs $75k-100k, 66.7% for AGIs over 100k)
Likely homosexual households (counted as self-reported same-sex unmarried-partner households)
Lesbian couples: 0.0% of all households
Gay men: 1.6% of all households
Household received Food Stamps/SNAP in the past 12 months: 32 Household did not receive Food Stamps/SNAP in the past 12 months: 809
Women who did not have a birth in the past 12 months: 424 (325 now married, 92 unmarried)
Housing units in zip code 94020 with a mortgage: 410 (44 second mortgage, 45 both second mortgage and home equity loan) Residents with income below the poverty level in 2022:
This zip code:
3.2%
Whole state:
12.2%
Residents with income below 50% of the poverty level in 2022:
This zip code:
2.1%
Whole state:
6.2%
Median number of rooms in houses and condos:
Here:
5.5
State:
6.0
Median number of rooms in apartments:
Here:
3.8
State:
3.9
Notable locations in this zip code not listed on our city pages
Notable locations in zip code 94020: Burns Ranch (A), Camp Pomponio (B), San Francisco Camp (C), Page Mill (D), Horseshoe Ranch (E), Circle Group Camp (F), Tarwater Trail Camp (G), Tanoak Picnic Area (H), Slate Creek Trail Camp (I), Ravine Group Camp (J), Point Group Camp (K), Madrone Picnic Area (L), Huckleberry Picnic Area (M), Hillside Group Camp (N), Big Dipper Ranch (O), Bowman Ranch (P), Portola State Park Office and Visitors Center (Q), La Honda Fire Brigade (R). Display/hide their locations on the map
Creeks: Carriger Creek (A), Evans Creek (B), Fall Creek (C), Harrington Creek (D), Iverson Creek (E), Keyston Creek (F), La Honda Creek (G), Lambert Creek (H), Langley Creek (I). Display/hide their locations on the map
Parks in zip code 94020 include: Portola Redwoods State Park (1), Heritage Grove Redwood Preserve (2), Russian Ridge Open Space Preserve (3), Skyline Ridge Open Space Preserve (4), La Honda Store State Historic Landmark (5), McDonald Park (6). Display/hide their locations on the map
In group quarters: 7 (-1 institutionalized population)
Size of family households: 246 2-persons, 187 3-persons, 35 4-persons, 31 5-persons, 31 6-persons, 8 7-or-more-persons
Size of nonfamily households: 251 1-person, 73 2-persons
306 married couples with children.
0 single-parent households ().
78.6% of residents of 94020 zip code speak English at home.
2.8% of residents speak Spanish at home (6% very well, 36% well, 42% not well, 17% not at all).
17.5% of residents speak other Indo-European language at home (100% very well).
1.5% of residents speak Asian or Pacific Island language at home (100% very well).
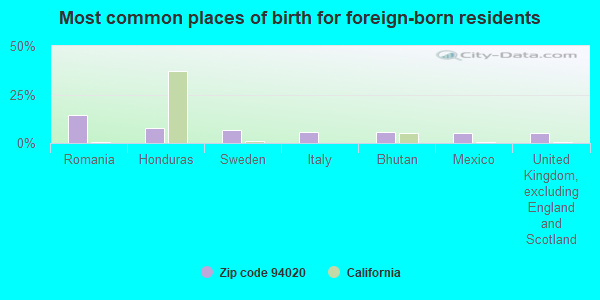
Foreign born population: 415 (20.6%) (53.6% of them are naturalized citizens)
This zip code:
20.6%
Whole state:
26.7%
14%Romania
8%Honduras
7%Sweden
6%Italy
6%Bhutan
5%Mexico
5%United Kingdom, excluding England and Scotland
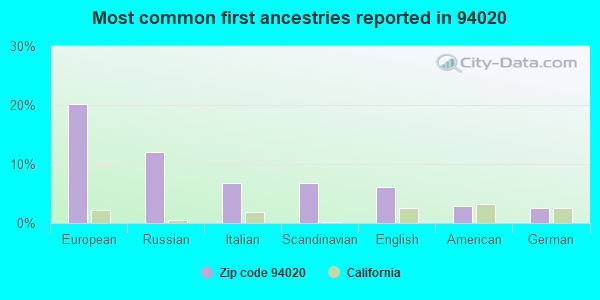
20%European
12%Russian
7%Italian
7%Scandinavian
6%English
3%American
3%German
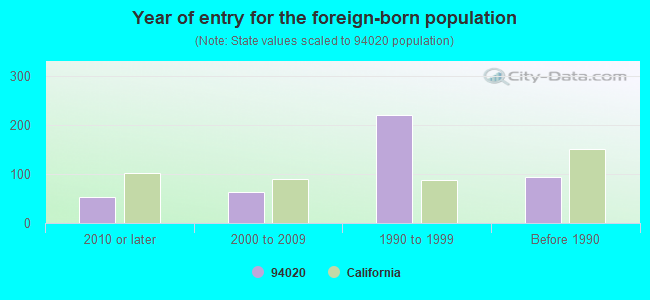
Year of entry for the foreign-born population
522010 or later
632000 to 2009
2201990 to 1999
94Before 1990
Facilities with environmental interests located in this zip code:
LA HONDA ELEMENTARY (SEARS RANCH ROAD in LA HONDA, CA)
(National Center for Education Statistics) - STATE ID-6044077 Organizations: LA HONDA-PESCADERO UNIFIED (SCHOOL DISTRICT)
LA HONDA (CUESTA REAL DR .5 MI E WOODLAN in LA HONDA, CA)
CRITERIA AND HAZARDOUS AIR POLLUTANT INVENTORY (Inventory of air pollution sources) Business SIC classification: REFUSE SYSTEMS Business NAICS classification: SOLID WASTE LANDFILL.
Housing units lacking complete kitchen facilities: 2.6%
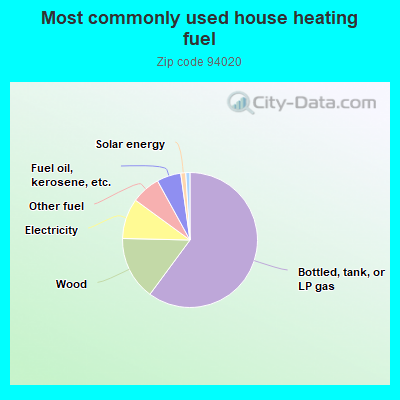
60.3%Bottled, tank, or LP gas
15.3%Wood
9.7%Electricity
7.0%Other fuel
5.8%Fuel oil, kerosene, etc.
1.2%Solar energy
1.0%Utility gas
Population in 1990: 1,557. Population change in the 1990s: +53 (+3.4%).
Place of birth for U.S.-born residents:
This state: 1,072
Northeast: 238
Midwest: 156
South: 48
West: 52
67% of the 94020 zip code residents lived in the same house 5 years ago. Out of people who lived in different houses, 60% lived in this county. Out of people who lived in different counties, 50% lived in California.
94% of the 94020 zip code residents lived in the same house 1 year ago. Out of people who lived in different houses, 58% moved from this county. Out of people who lived in different houses, 43% moved from different county within same state.
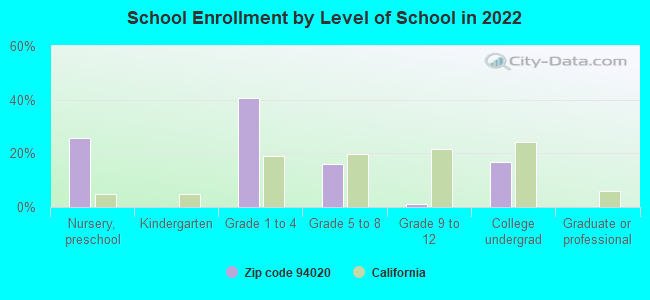
Private vs. public school enrollment:
Students in private schools in grades 1 to 8 (elementary and middle school): 49
Here:
31.6%
California:
10.5%
Students in private schools in grades 9 to 12 (high school):
Here:
0.0%
California:
8.5%
Students in private undergraduate colleges:
Here:
0.0%
California:
15.9%
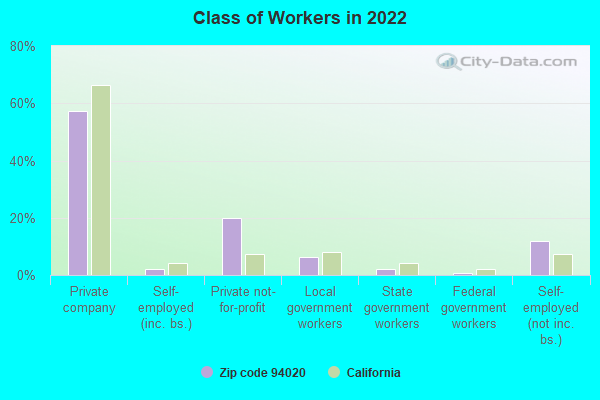
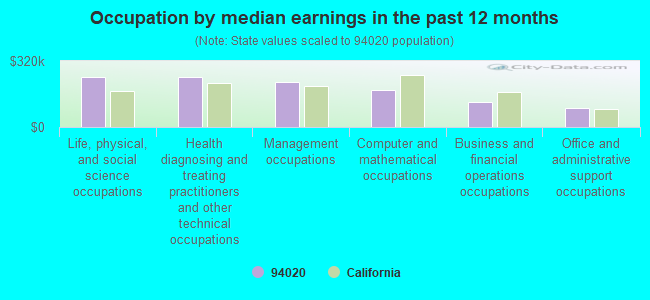
Occupation by median earnings in the past 12 months ($)
242,578Life, physical, and social science occupations
241,865Health diagnosing and treating practitioners and other technical occupations
216,818Management occupations
180,826Computer and mathematical occupations
123,540Business and financial operations occupations
94,399Office and administrative support occupations
Companies with federal contracts located in this zip code:
LAURA LYNN ZINK TORRESAN (36 LAGUNA DR in LA HONDA, CA; small business) : $110,000 in 7 contractsfrom 1999 to 2001
Contracts for Programming Services by Geological Survey Signed by year:2000: $65,000; 2001: $11,000; 2002: $0; 2003: $0; 2004: $0; 2005: $0; 2006: $0.
Biggest contracts:
$38,000 with Geological Survey for Programming Services. Signed on 2000-11-15. Completion date: 2001-09-15.
$34,000, same as above.Signed on 1999-11-15. Completion date: 2001-09-15.
$21,000, same as above.Signed on 2000-10-15. Completion date: 2001-09-15.
$15,000, same as above.Signed on 2001-01-15. Completion date: 2001-09-15.
J TAYLOR PERRON (HC 2 BOX 117D in LA HONDA, CA; small business) : $20,000 in 4 contractsin 2000
$9,000 with Geological Survey for Seismological Studies. Signed on 2000-04-15. Completion date: 2000-08-15.
$7,000, same as above.Signed on 2000-01-15. Completion date: 2000-08-15.
$3,000, same as above.Signed on 2000-04-15. Completion date: 2000-08-15.
$1,000, same as above.Signed on 2000-08-15. Completion date: 2000-08-15.
FAILSAFE TESTING (400 WOODLAND VISTA in LA HONDA, CA; small business) : $0 in 2 contractsin 2005
$4,250 with Navy for Inspection Services (including commercial testing and lab services, except medical/dental) -- Miscellaneous. Signed on 2005-01-24. Completion date: 2005-01-24.
-$4,250, same as above.Signed on 2005-05-26. Completion date: 2005-01-24.
Top industries in this zip code by the number of employees in 2005:
Other Services (except Public Administration): Civic and Social Organizations (20-49 employees: 1 establishment)
Administrative and Support and Waste Management and Remediation Services: Landscaping Services (10-19: 1, 1-4: 1)
Construction: New Single-Family Housing Construction (except Operative Builders) (5-9: 1, 1-4: 1)
Construction: Site Preparation Contractors (5-9: 1, 1-4: 1)
Construction: Residential Remodelers (5-9: 1)
Other Services (except Public Administration): Other Similar Organizations (except Business, Professional, Labor, and Political Organizations) (5-9: 1)
Professional, Scientific, and Technical Services: Veterinary Services (1-4: 2)
People in group quarters in 2010:
12 people in correctional facilities intended for juveniles
12 people in workers' group living quarters and job corps centers
People in group quarters in 2000:
82 people in local jails and other confinement facilities (including police lockups)
40 people in training schools for juvenile delinquents
13 people in other noninstitutional group quarters
3 people in unknown juvenile institutions
Fatal accident statistics in 2013:
Fatal accident count: 1
Vehicles involved in fatal accidents: 1
Fatal accidents caused by drunken drivers: 1
Fatalities: 1
Persons involved in fatal accidents: 3
Pedestrians involved in fatal accidents: 0
Fatal accident statistics in 2012:
Fatal accident count: 2
Vehicles involved in fatal accidents: 3
Fatal accidents caused by drunken drivers: 1
Fatalities: 2
Persons involved in fatal accidents: 4
Pedestrians involved in fatal accidents: 0
Home Mortgage Disclosure Act Aggregated Statistics For Year 2009 (Based on 2 partial tracts)
A) FHA, FSA/RHS & VA Home Purchase Loans
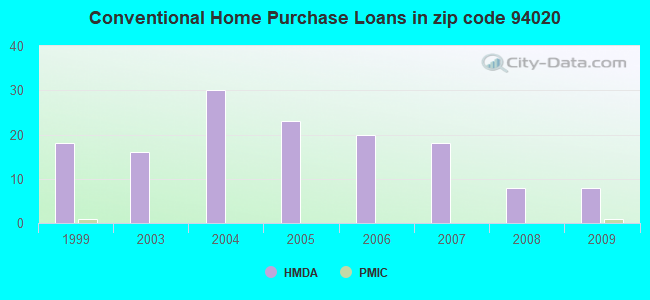
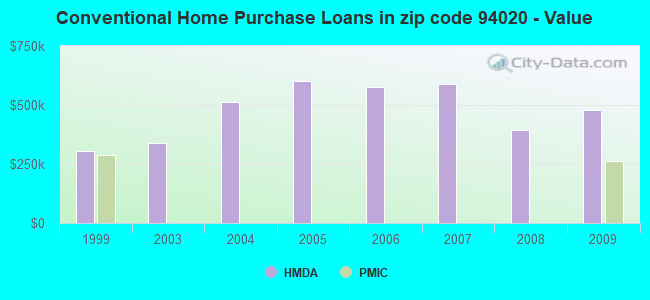
B) Conventional Home Purchase Loans
C) Refinancings
D) Home Improvement Loans
F) Non-occupant Loans on < 5 Family Dwellings (A B C & D)
Number
Average Value
Number
Average Value
Number
Average Value
Number
Average Value
Number
Average Value
LOANS ORIGINATED
1
$363,300
8
$479,621
63
$401,121
3
$278,183
5
$442,914
APPLICATIONS APPROVED, NOT ACCEPTED
0
$0
2
$390,030
10
$420,131
0
$0
1
$57,090
APPLICATIONS DENIED
0
$0
3
$1,228,127
21
$535,311
1
$51,900
3
$577,820
APPLICATIONS WITHDRAWN
1
$136,500
1
$422,990
9
$497,202
0
$0
1
$432,850
FILES CLOSED FOR INCOMPLETENESS
0
$0
1
$731,270
4
$483,448
1
$103,800
0
$0
Aggregated Statistics For Year 2008 (Based on 2 partial tracts)
A) FHA, FSA/RHS & VA Home Purchase Loans
B) Conventional Home Purchase Loans
C) Refinancings
D) Home Improvement Loans
F) Non-occupant Loans on < 5 Family Dwellings (A B C & D)
G) Loans On Manufactured Home Dwelling (A B C & D)
Number
Average Value
Number
Average Value
Number
Average Value
Number
Average Value
Number
Average Value
Number
Average Value
LOANS ORIGINATED
1
$257,940
8
$395,868
20
$459,574
3
$253,790
3
$525,400
1
$15,050
APPLICATIONS APPROVED, NOT ACCEPTED
0
$0
2
$285,450
3
$419,353
0
$0
0
$0
0
$0
APPLICATIONS DENIED
0
$0
6
$365,203
15
$610,690
2
$269,360
0
$0
1
$50,860
APPLICATIONS WITHDRAWN
1
$255,870
1
$428,180
4
$404,950
0
$0
1
$249,120
0
$0
FILES CLOSED FOR INCOMPLETENESS
0
$0
1
$725,040
4
$778,110
1
$168,680
0
$0
0
$0
Aggregated Statistics For Year 2007 (Based on 2 partial tracts)
B) Conventional Home Purchase Loans
C) Refinancings
D) Home Improvement Loans
E) Loans on Dwellings For 5+ Families
F) Non-occupant Loans on < 5 Family Dwellings (A B C & D)
G) Loans On Manufactured Home Dwelling (A B C & D)
Number
Average Value
Number
Average Value
Number
Average Value
Number
Average Value
Number
Average Value
Number
Average Value
LOANS ORIGINATED
18
$588,373
47
$576,543
4
$429,602
1
$493,050
9
$524,479
0
$0
APPLICATIONS APPROVED, NOT ACCEPTED
5
$700,546
10
$733,814
1
$258,460
0
$0
2
$405,340
1
$110,030
APPLICATIONS DENIED
10
$551,957
18
$687,733
3
$345,480
0
$0
2
$426,620
0
$0
APPLICATIONS WITHDRAWN
3
$822,787
10
$679,579
2
$433,105
0
$0
2
$278,185
0
$0
FILES CLOSED FOR INCOMPLETENESS
2
$496,425
3
$457,587
0
$0
0
$0
1
$506,030
0
$0
Aggregated Statistics For Year 2006 (Based on 2 partial tracts)
B) Conventional Home Purchase Loans
C) Refinancings
D) Home Improvement Loans
E) Loans on Dwellings For 5+ Families
F) Non-occupant Loans on < 5 Family Dwellings (A B C & D)
G) Loans On Manufactured Home Dwelling (A B C & D)
Number
Average Value
Number
Average Value
Number
Average Value
Number
Average Value
Number
Average Value
Number
Average Value
LOANS ORIGINATED
20
$578,166
50
$574,408
11
$341,361
1
$285,450
9
$639,234
1
$516,400
APPLICATIONS APPROVED, NOT ACCEPTED
6
$571,073
13
$602,279
1
$537,680
0
$0
2
$664,840
0
$0
APPLICATIONS DENIED
14
$591,141
22
$633,864
4
$341,892
0
$0
3
$525,400
0
$0
APPLICATIONS WITHDRAWN
2
$1,150,365
12
$556,844
2
$291,160
0
$0
1
$472,290
0
$0
FILES CLOSED FOR INCOMPLETENESS
0
$0
2
$283,375
0
$0
0
$0
0
$0
0
$0
Aggregated Statistics For Year 2005 (Based on 2 partial tracts)
B) Conventional Home Purchase Loans
C) Refinancings
D) Home Improvement Loans
F) Non-occupant Loans on < 5 Family Dwellings (A B C & D)
G) Loans On Manufactured Home Dwelling (A B C & D)
Number
Average Value
Number
Average Value
Number
Average Value
Number
Average Value
Number
Average Value
LOANS ORIGINATED
23
$599,806
56
$578,388
6
$329,047
6
$659,130
0
$0
APPLICATIONS APPROVED, NOT ACCEPTED
4
$589,585
9
$602,848
0
$0
0
$0
0
$0
APPLICATIONS DENIED
7
$453,383
18
$489,994
6
$353,353
1
$778,500
3
$676,430
APPLICATIONS WITHDRAWN
3
$433,367
13
$446,061
2
$288,825
2
$468,400
1
$394,440
FILES CLOSED FOR INCOMPLETENESS
1
$634,220
6
$533,358
0
$0
0
$0
0
$0
Aggregated Statistics For Year 2004 (Based on 2 partial tracts)
B) Conventional Home Purchase Loans
C) Refinancings
D) Home Improvement Loans
E) Loans on Dwellings For 5+ Families
F) Non-occupant Loans on < 5 Family Dwellings (A B C & D)
G) Loans On Manufactured Home Dwelling (A B C & D)
Number
Average Value
Number
Average Value
Number
Average Value
Number
Average Value
Number
Average Value
Number
Average Value
LOANS ORIGINATED
30
$514,156
82
$445,511
5
$281,920
1
$472,290
8
$404,301
1
$71,100
APPLICATIONS APPROVED, NOT ACCEPTED
5
$226,180
16
$463,694
3
$317,457
0
$0
1
$29,580
0
$0
APPLICATIONS DENIED
13
$629,467
28
$459,185
4
$381,075
0
$0
3
$509,313
0
$0
APPLICATIONS WITHDRAWN
7
$435,516
27
$457,758
1
$132,350
0
$0
2
$379,910
1
$188,400
FILES CLOSED FOR INCOMPLETENESS
1
$236,150
5
$450,596
1
$155,700
0
$0
1
$391,850
0
$0
Aggregated Statistics For Year 2003 (Based on 2 partial tracts)
A) FHA, FSA/RHS & VA Home Purchase Loans
B) Conventional Home Purchase Loans
C) Refinancings
D) Home Improvement Loans
F) Non-occupant Loans on < 5 Family Dwellings (A B C & D)
Number
Average Value
Number
Average Value
Number
Average Value
Number
Average Value
Number
Average Value
LOANS ORIGINATED
1
$118,330
16
$337,837
157
$368,520
2
$45,670
10
$307,404
APPLICATIONS APPROVED, NOT ACCEPTED
0
$0
4
$526,655
26
$368,310
2
$18,685
2
$463,985
APPLICATIONS DENIED
0
$0
7
$562,967
40
$472,588
2
$35,030
3
$233,897
APPLICATIONS WITHDRAWN
0
$0
5
$308,494
37
$367,929
0
$0
5
$235,834
FILES CLOSED FOR INCOMPLETENESS
0
$0
1
$103,800
7
$361,447
0
$0
1
$237,700
Aggregated Statistics For Year 1999 (Based on 1 partial tract)
B) Conventional Home Purchase Loans
C) Refinancings
D) Home Improvement Loans
F) Non-occupant Loans on < 5 Family Dwellings (A B C & D)
Detailed PMIC statistics for the following Tracts:6138.00
2006 - 2018 National Fire Incident Reporting System (NFIRS) incidents
According to the data from the years 2006 - 2018 the average number of fires per year is 12. The highest number of reported fire incidents - 20 took place in 2008, and the least - 2 in 2006. The data has an increasing trend.
When looking into fire subcategories, the most incidents belonged to: Outside Fires (61.0%), and Structure Fires (22.1%).
Fire incident types reported to NFIRS in Zip Code 94020


 Nearest zip codes: 94021, 94060, 94028, 94304, 94022, 94074.
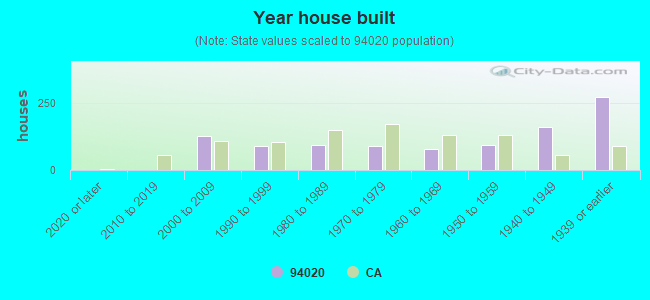


 According to the data from the years 2006 - 2018 the average number of fires per year is 12. The highest number of reported fire incidents - 20 took place in 2008, and the least - 2 in 2006. The data has an increasing trend.
 When looking into fire subcategories, the most incidents belonged to: Outside Fires (61.0%), and Structure Fires (22.1%).