Estimated zip code population in 2022: 15,095 Zip code population in 2010: 13,292 Zip code population in 2000: 13,471
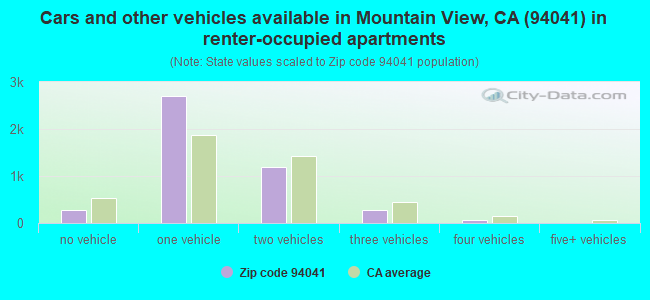
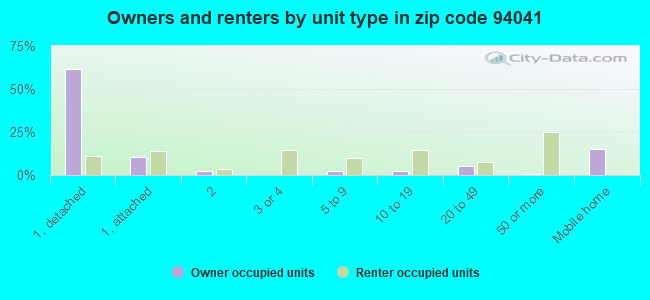
Houses and condos: 7,358 Renter-occupied apartments: 4,460
% of renters here:
68%
State:
44%
March 2022 cost of living index in zip code 94041: 128.7 (high, U.S. average is 100)
Land area: 1.5 sq. mi. Water area: 0.0 sq. mi.
Population density: 9,864 people per square mile
(high).
OSM Map
General Map
Google Map
MSN Map
OSM Map
General Map
Google Map
MSN Map
OSM Map
General Map
Google Map
MSN Map
OSM Map
General Map
Google Map
MSN Map
Please wait while loading the map...
Real estate property taxes paid for housing units in 2022:
This zip code:
0.5% ($10,056)
California:
0.7% ($4,831)
Median real estate property taxes paid for housing units with mortgages in 2022: $10,330 (0.5%) Median real estate property taxes paid for housing units with no mortgage in 2022: $4,874 (0.3%)
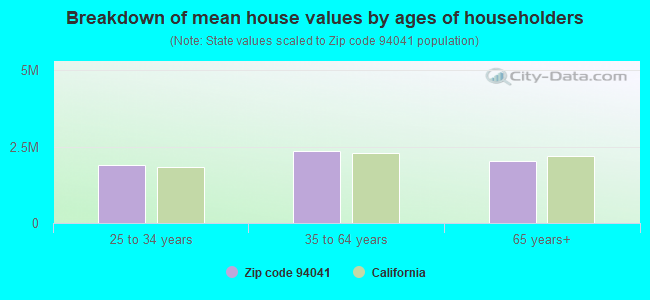
Estimated median house/condo value in 2022: $2,171,698
94041:
$2,171,698
California:
$715,900
According to our research of California and other state lists, there were 12 registered sex offenders living in 94041 zip code as of April 23, 2024. The ratio of all residents to sex offenders in zip code 94041 is 1,197 to 1. The ratio of registered sex offenders to all residents in this zip code is lower than the state average.
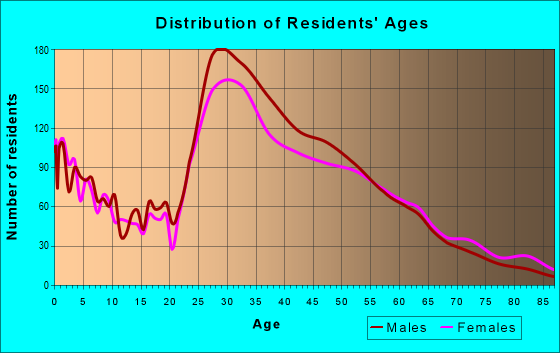
Median resident age:
This zip code:
34.8 years
California median age:
37.9 years
Average household size:
This zip code:
2.3 people
California:
2.8 people
Averages for the 2020 tax year for zip code 94041, filed in 2021:
Average Adjusted Gross Income (AGI) in 2020: $282,396 (Individual Income Tax Returns)
Here:
$282,396
State:
$95,910
Salary/wage: $211,299 (reported on 84.9% of returns)
Here:
$211,299
State:
$77,331
(% of AGI for various income ranges: 1247.5% for AGIs below $25k, 4418.6% for AGIs $25k-50k, 7828.3% for AGIs $50k-75k, 11309.2% for AGIs $75k-100k, 22996.2% for AGIs $100k-200k, 190176.8% for AGIs over 200k)
Taxable interest for individuals: $6,801 (reported on 51.2% of returns)
This zip code:
$6,801
California:
$2,294
(% of AGI for various income ranges: 28.1% for AGIs below $25k, 50.8% for AGIs $25k-50k, 69.6% for AGIs $50k-75k, 120.5% for AGIs $75k-100k, 182.9% for AGIs $100k-200k, 4250.9% for AGIs over 200k)
Ordinary dividends: $38,254 (reported on 48.2% of returns)
Here:
$38,254
State:
$10,949
(% of AGI for various income ranges: 76.8% for AGIs below $25k, 133.4% for AGIs $25k-50k, 176.9% for AGIs $50k-75k, 295.7% for AGIs $75k-100k, 612.5% for AGIs $100k-200k, 23658.6% for AGIs over 200k)
Net capital gain/loss in AGI: +$53,752 (reported on 47.6% of returns)
Here:
+$53,752
State:
+$49,306
(% of AGI for various income ranges: 37.3% for AGIs below $25k, 102.2% for AGIs $25k-50k, 185.0% for AGIs $50k-75k, 307.8% for AGIs $75k-100k, 947.2% for AGIs $100k-200k, 32948.8% for AGIs over 200k)
Profit/loss from business: +$22,723 (reported on 16.0% of returns)
Here:
+$22,723
State:
+$15,671
(% of AGI for various income ranges: 410.2% for AGIs below $25k, 327.3% for AGIs $25k-50k, 344.8% for AGIs $50k-75k, 381.6% for AGIs $75k-100k, 602.4% for AGIs $100k-200k, 2669.6% for AGIs over 200k)
Taxable individual retirement arrangement distribution: $29,068 (reported on 7.3% of returns)
94041:
$29,068
California:
$23,505
(% of AGI for various income ranges: 61.1% for AGIs below $25k, 129.7% for AGIs $25k-50k, 271.5% for AGIs $50k-75k, 260.5% for AGIs $75k-100k, 701.5% for AGIs $100k-200k, 1253.8% for AGIs over 200k)
Self-employed (Keogh) retirement plans: $32,277 (reported on 1.7% of returns)
94041:
$32,277
California:
$30,163
(% of AGI for various income ranges: 79.6% for AGIs $100k-200k, 635.5% for AGIs over 200k)
Total itemized deductions: $196,168 (reported on 17.7% of returns)
Here:
$196,168
State:
$39,517
(% of AGI for various income ranges: 127.6% for AGIs below $25k, 200.2% for AGIs $25k-50k, 318.3% for AGIs $50k-75k, 522.7% for AGIs $75k-100k, 997.0% for AGIs $100k-200k, 44841.6% for AGIs over 200k)
Charity contributions: $167,444 (reported on 14.8% of returns)
Here:
$167,444
State:
$12,598
(% of AGI for various income ranges: 22.7% for AGIs $25k-50k, 40.6% for AGIs $50k-75k, 73.8% for AGIs $75k-100k, 179.1% for AGIs $100k-200k, 33418.2% for AGIs over 200k)
Taxes paid: $9,369 (reported on 17.7% of returns)
94041:
$9,369
State:
$8,807
(% of AGI for various income ranges: 28.1% for AGIs below $25k, 52.5% for AGIs $25k-50k, 81.3% for AGIs $50k-75k, 154.6% for AGIs $75k-100k, 318.4% for AGIs $100k-200k, 1531.6% for AGIs over 200k)
Earned income credit: $1,491 (reported on 4.2% of returns)
Here:
$1,491
State:
$2,074
(% of AGI for various income ranges: 42.5% for AGIs below $25k, 32.7% for AGIs $25k-50k)
Percentage of individuals using paid preparers for their 2020 taxes: 92.9%
Here:
93%
State:
92%
(% for various income ranges: 87.4% for AGIs below $25k, 91.3% for AGIs $25k-50k, 94.2% for AGIs $50k-75k, 91.7% for AGIs $75k-100k, 94.8% for AGIs $100k-200k, 95.0% for AGIs over 200k)
Averages for the 2012 tax year for zip code 94041, filed in 2013:
Average Adjusted Gross Income (AGI) in 2012: $134,857 (Individual Income Tax Returns)
Here:
$134,857
State:
$72,726
Salary/wage: $120,831 (reported on 85.9% of returns)
Here:
$120,831
State:
$59,079
(% of AGI for various income ranges: 73.0% for AGIs below $25k, 81.5% for AGIs $25k-50k, 81.1% for AGIs $50k-75k, 84.4% for AGIs $75k-100k, 87.4% for AGIs $100k-200k, 71.7% for AGIs over 200k)
Taxable interest for individuals: $1,453 (reported on 50.6% of returns)
This zip code:
$1,453
California:
$2,146
(% of AGI for various income ranges: 1.8% for AGIs below $25k, 1.0% for AGIs $25k-50k, 0.7% for AGIs $50k-75k, 0.6% for AGIs $75k-100k, 0.5% for AGIs $100k-200k, 0.5% for AGIs over 200k)
Ordinary dividends: $8,520 (reported on 37.6% of returns)
Here:
$8,520
State:
$9,308
(% of AGI for various income ranges: 3.1% for AGIs below $25k, 2.3% for AGIs $25k-50k, 1.6% for AGIs $50k-75k, 2.0% for AGIs $75k-100k, 1.5% for AGIs $100k-200k, 2.8% for AGIs over 200k)
Net capital gain/loss in AGI: +$34,681 (reported on 35.9% of returns)
Here:
+$34,681
State:
+$30,460
(% of AGI for various income ranges: 0.3% for AGIs below $25k, 0.4% for AGIs $25k-50k, 0.3% for AGIs $50k-75k, 0.8% for AGIs $75k-100k, 1.4% for AGIs $100k-200k, 15.0% for AGIs over 200k)
Profit/loss from business: +$26,031 (reported on 16.9% of returns)
Here:
+$26,031
State:
+$17,064
(% of AGI for various income ranges: 13.0% for AGIs below $25k, 6.1% for AGIs $25k-50k, 4.8% for AGIs $50k-75k, 3.4% for AGIs $75k-100k, 3.5% for AGIs $100k-200k, 2.4% for AGIs over 200k)
Taxable individual retirement arrangement distribution: $20,234 (reported on 8.4% of returns)
94041:
$20,234
California:
$19,557
(% of AGI for various income ranges: 3.6% for AGIs below $25k, 2.7% for AGIs $25k-50k, 3.2% for AGIs $50k-75k, 1.5% for AGIs $75k-100k, 1.7% for AGIs $100k-200k, 0.7% for AGIs over 200k)
Self-employment retirement plans: $22,893 (reported on 1.9% of returns)
94041:
$22,893
California:
$24,530
(% of AGI for various income ranges: 0.6% for AGIs $50k-75k, 0.4% for AGIs $100k-200k, 0.4% for AGIs over 200k)
Total itemized deductions: $37,068 (15% of AGI, reported on 46.2% of returns)
Here:
$37,068
State:
$34,004
Here:
15.5% of AGI
State:
22.7% of AGI
(% of AGI for various income ranges: 11.3% for AGIs below $25k, 7.6% for AGIs $25k-50k, 7.8% for AGIs $50k-75k, 11.0% for AGIs $75k-100k, 13.8% for AGIs $100k-200k, 13.5% for AGIs over 200k)
Charity contributions: $3,964 (reported on 33.2% of returns)
Here:
$3,964
State:
$4,659
(% of AGI for various income ranges: 0.5% for AGIs below $25k, 0.6% for AGIs $25k-50k, 0.7% for AGIs $50k-75k, 0.9% for AGIs $75k-100k, 1.0% for AGIs $100k-200k, 1.1% for AGIs over 200k)
Taxes paid: $22,780 (reported on 46.1% of returns)
94041:
$22,780
State:
$14,448
(% of AGI for various income ranges: 2.1% for AGIs below $25k, 1.8% for AGIs $25k-50k, 2.7% for AGIs $50k-75k, 5.2% for AGIs $75k-100k, 7.7% for AGIs $100k-200k, 9.3% for AGIs over 200k)
Earned income credit: $1,609 (reported on 6.2% of returns)
Here:
$1,609
State:
$2,286
(% of AGI for various income ranges: 2.7% for AGIs below $25k, 0.3% for AGIs $25k-50k)
Percentage of individuals using paid preparers for their 2012 taxes: 47.2%
Here:
47%
State:
64%
(% for various income ranges: 53.4% for AGIs below $25k, 49.3% for AGIs $25k-50k, 45.2% for AGIs $50k-75k, 38.0% for AGIs $75k-100k, 40.0% for AGIs $100k-200k, 52.5% for AGIs over 200k)
Averages for the 2004 tax year for zip code 94041, filed in 2005:
Average Adjusted Gross Income (AGI) in 2004: $96,667 (Individual Income Tax Returns)
Here:
$96,667
State:
$58,600
Salary/wage: $74,454 (reported on 86.9% of returns)
Here:
$74,454
State:
$49,455
(% of AGI for various income ranges: 77.9% for AGIs below $10k, 77.4% for AGIs $10k-25k, 85.0% for AGIs $25k-50k, 87.4% for AGIs $50k-75k, 89.6% for AGIs $75k-100k, 58.1% for AGIs over 100k)
Taxable interest for individuals: $1,621 (reported on 53.8% of returns)
This zip code:
$1,621
California:
$2,365
(% of AGI for various income ranges: 6.6% for AGIs below $10k, 2.8% for AGIs $10k-25k, 1.3% for AGIs $25k-50k, 1.4% for AGIs $50k-75k, 0.9% for AGIs $75k-100k, 0.7% for AGIs over 100k)
Taxable dividends: $3,489 (reported on 34.9% of returns)
Here:
$3,489
State:
$4,746
(% of AGI for various income ranges: 4.7% for AGIs below $10k, 2.1% for AGIs $10k-25k, 1.2% for AGIs $25k-50k, 1.3% for AGIs $50k-75k, 0.8% for AGIs $75k-100k, 1.3% for AGIs over 100k)
Net capital gain/loss: +$56,693 (reported on 33.9% of returns)
Here:
+$56,693
State:
+$23,418
(% of AGI for various income ranges: -3.7% for AGIs below $10k, 0.8% for AGIs $10k-25k, 0.6% for AGIs $25k-50k, 1.1% for AGIs $50k-75k, 1.0% for AGIs $75k-100k, 28.6% for AGIs over 100k)
Profit/loss from business: +$21,099 (reported on 14.6% of returns)
Here:
+$21,099
State:
+$16,826
(% of AGI for various income ranges: 15.4% for AGIs below $10k, 7.4% for AGIs $10k-25k, 4.5% for AGIs $25k-50k, 3.5% for AGIs $50k-75k, 3.0% for AGIs $75k-100k, 2.7% for AGIs over 100k)
IRA payment deduction: $3,159 (reported on 3.2% of returns)
94041:
$3,159
California:
$3,192
(% of AGI for various income ranges: 0.4% for AGIs $10k-25k, 0.4% for AGIs $25k-50k, 0.2% for AGIs $50k-75k, 0.2% for AGIs $75k-100k, 0.0% for AGIs over 100k)
Self-employed pension: $17,246 (reported on 1.8% of returns)
Here:
$17,246
California:
$17,688
Total itemized deductions: $28,170 (16% of AGI, reported on 42.4% of returns)
Here:
$28,170
State:
$28,113
Here:
16.2% of AGI
State:
25.3% of AGI
(% of AGI for various income ranges: 23.1% for AGIs below $10k, 8.1% for AGIs $10k-25k, 7.7% for AGIs $25k-50k, 10.6% for AGIs $50k-75k, 13.1% for AGIs $75k-100k, 13.2% for AGIs over 100k)
Charity contributions deductions: $3,633 (2% of AGI, reported on 34.1% of returns)
Here:
$3,633
State:
$3,923
Here:
2.0% of AGI
State:
3.3% of AGI
(% of AGI for various income ranges: 0.7% for AGIs below $10k, 0.6% for AGIs $10k-25k, 0.9% for AGIs $25k-50k, 1.0% for AGIs $50k-75k, 1.1% for AGIs $75k-100k, 1.4% for AGIs over 100k)
Total tax: $18,724 (reported on 85.2% of returns)
94041:
$18,724
State:
$10,761
(% of AGI for various income ranges: 3.9% for AGIs below $10k, 4.8% for AGIs $10k-25k, 8.9% for AGIs $25k-50k, 12.8% for AGIs $50k-75k, 14.6% for AGIs $75k-100k, 18.9% for AGIs over 100k)
Earned income credit: $1,221 (reported on 5.3% of returns)
Here:
$1,221
State:
$1,763
Percentage of individuals using paid preparers for their 2004 taxes: 48.4%
Here:
48%
State:
66%
(% for various income ranges: 44.2% for AGIs below $10k, 60.2% for AGIs $10k-25k, 50.5% for AGIs $25k-50k, 44.7% for AGIs $50k-75k, 39.2% for AGIs $75k-100k, 46.6% for AGIs over 100k)
Likely homosexual households (counted as self-reported same-sex unmarried-partner households)
Lesbian couples: 0.0% of all households
Gay men: 0.1% of all households
Household received Food Stamps/SNAP in the past 12 months: 296 Household did not receive Food Stamps/SNAP in the past 12 months: 6,168
Women who had a birth in the past 12 months: 118 (117 now married, 0 unmarried) Women who did not have a birth in the past 12 months: 3,768 (1,901 now married, 1,850 unmarried)
Housing units in zip code 94041 with a mortgage: 1,254 (158 second mortgage, 147 both second mortgage and home equity loan) Houses without a mortgage: 23
Median monthly owner costs for units with a mortgage: $3,876 Median monthly owner costs for units without a mortgage: $1,231
Residents with income below the poverty level in 2022:
This zip code:
7.3%
Whole state:
12.2%
Residents with income below 50% of the poverty level in 2022:
This zip code:
4.8%
Whole state:
6.2%
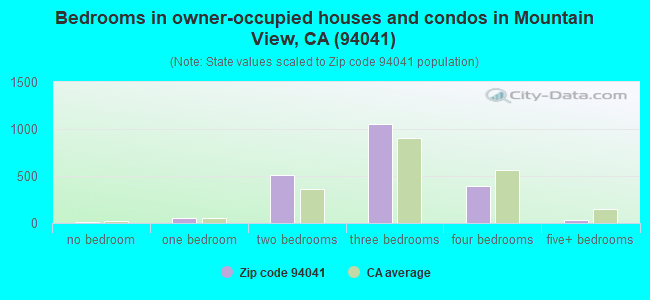
Median number of rooms in houses and condos:
Here:
5.6
State:
6.0
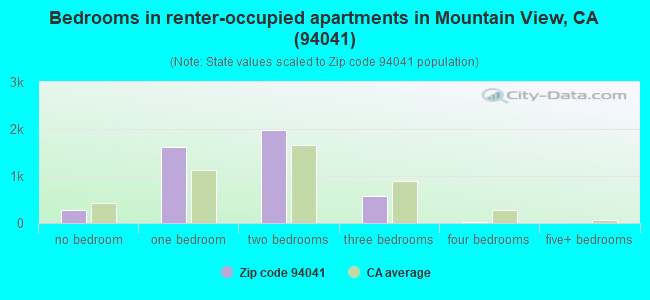
Median number of rooms in apartments:
Here:
3.6
State:
3.9
Notable locations in this zip code not listed on our city pages
Churches in zip code 94041 include: Mountain View Chinese Christian Church (A), Valley Bible Fellowship Church (B), First Church of Christ Scientist (C), Saint Joseph Roman Catholic Church (D), Seventh Day Adventist Church (E), Trinity United Methodist Church (F). Display/hide their locations on the map
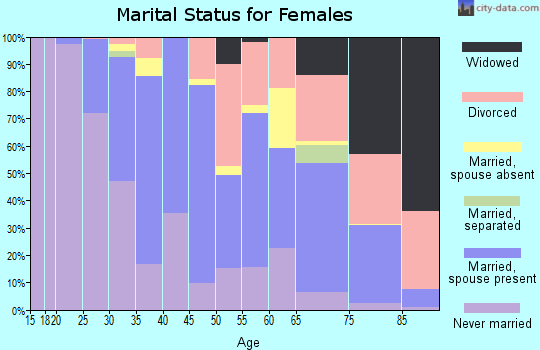
2,074 married couples with children.
832 single-parent households (238 men, 594 women).
50.1% of residents of 94041 zip code speak English at home.
21.6% of residents speak Spanish at home (60% very well, 20% well, 13% not well, 7% not at all).
10.5% of residents speak other Indo-European language at home (82% very well, 14% well, 2% not well, 2% not at all).
16.6% of residents speak Asian or Pacific Island language at home (70% very well, 25% well, 5% not well).
1.1% of residents speak other language at home (65% very well, 35% well).
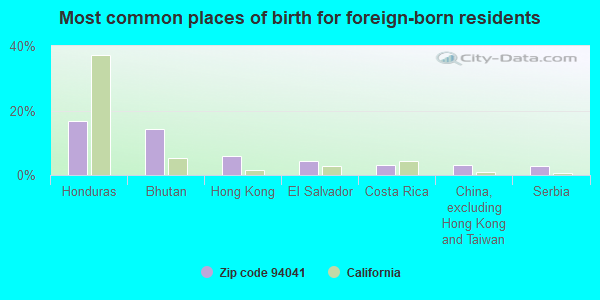
Foreign born population: 5,714 (37.9%) (40.1% of them are naturalized citizens)
Major facilities with environmental interests located in this zip code:
JASCO CHEMICAL CORPORATION (1710 VILLA STREET in MOUNTAIN VIEW, CA)
SUPERFUND NPL (Superfund database) (Integrated Compliance Information System) - ICIS-09-2000-0198, FORMAL ENFORCEMENT ACTION COMPLIANCE ACTIVITY (Tracking inspections of insecticide, fungicide, and rodenticide, and toxic substances) Small Quantity Generators, between 100 kg and 1000 kg of hazardous waste/month (Resource Conservation and Recovery Act (tracking hazardous waste)) TRI REPORTER (Tracking of toxic chemicals releasing facilities) Business SIC classification: PAINTS, VARNISHES, LACQUERS, ENAMELS, AND ALLIED PRODUCTS Business NAICS classification: ALL OTHER MISCELLANEOUS CHEMICAL PRODUCT AND PREPARATION MANUFACTURING.
FORTES AUTO BODY & FRAME (365 VILLA STREET in MOUNTAIN VIEW, CA)
STATE MASTER (California - Hazardous Waste Tracking) - HAZARDOU WASTE PROGRAM CRITERIA AND HAZARDOUS AIR POLLUTANT INVENTORY (Inventory of air pollution sources) Small Quantity Generators, between 100 kg and 1000 kg of hazardous waste/month (Resource Conservation and Recovery Act (tracking hazardous waste)) - notification Business SIC classification: TOP, BODY, AND UPHOLSTERY REPAIR SHOPS AND PAINT SHOPS Business NAICS classification: ALL OTHER AUTOMOTIVE REPAIR AND MAINTENANCE. Organizations: JERRY FOREST (CONTACT/OWNER)
Alternative names: FORTES AUTO BODY FRAME
EUROPEAN AUTO WORKS (239 W EVELYN AVE in MOUNTAIN VIEW, CA)
STATE MASTER (California - Hazardous Waste Tracking) - HAZARDOU WASTE PROGRAM Small Quantity Generators, between 100 kg and 1000 kg of hazardous waste/month (Resource Conservation and Recovery Act (tracking hazardous waste)) - notification Business NAICS classification: GENERAL AUTOMOTIVE REPAIR. Organizations: RALPH FOGLEIN (CONTACT/OWNER)
EVELYN AUTO BODY INC (151 E EVELYN AVENUE in MOUNTAIN VIEW, CA)
STATE MASTER (California - Hazardous Waste Tracking) - HAZARDOU WASTE PROGRAM CRITERIA AND HAZARDOUS AIR POLLUTANT INVENTORY (Inventory of air pollution sources) Small Quantity Generators, between 100 kg and 1000 kg of hazardous waste/month (Resource Conservation and Recovery Act (tracking hazardous waste)) Business SIC classification: TOP, BODY, AND UPHOLSTERY REPAIR SHOPS AND PAINT SHOPS Business NAICS classification: AUTOMOTIVE BODY, PAINT, AND INTERIOR REPAIR AND MAINTENANCE.
KAISER MT VIEW MEDL OFS BLDG (555 CASTRO ST in MOUNTAIN VIEW, CA)
STATE MASTER (California - Hazardous Waste Tracking) - HAZARDOU WASTE PROGRAM Small Quantity Generators, between 100 kg and 1000 kg of hazardous waste/month (Resource Conservation and Recovery Act (tracking hazardous waste)) - notification Organizations: KAISER FOUNDATION HOSPITALS (CONTACT/OWNER)
Alternative names: KAISER PERMANENTE
B D BIOSCIENCE CLONTECH (1025 TERRA BELLA AVE in MOUNTAIN VIEW, CA)
STATE MASTER (California - Hazardous Waste Tracking) - HAZARDOU WASTE PROGRAM Small Quantity Generators, between 100 kg and 1000 kg of hazardous waste/month (Resource Conservation and Recovery Act (tracking hazardous waste)) - notification Organizations: TERRA BELLA INVESTMENT (CONTACT/OWNER)
LANDELS (EDITH) ELEMENTARY (115 DANA ST. in MOUNTAIN VIEW, CA)
(National Center for Education Statistics) - STATE ID-6047963 Organizations: MOUNTAIN VIEW-WHISMAN ELEMENTARY (SCHOOL DISTRICT)
EVELYN MOUNTAIN VIEW LLC (161 EAST EVELYN AVENUE in MOUNTAIN VIEW, CA)
CRITERIA AND HAZARDOUS AIR POLLUTANT INVENTORY (Inventory of air pollution sources) HAZARDOUS WASTE BIENNIAL REPORTER (Resource Conservation and Recovery Act (tracking hazardous waste)) (Resource Conservation and Recovery Act (tracking hazardous waste)) Business SIC classification: ELECTRONIC COMPONENTS Organizations: SOUTH BAY DEVELOPMENT (CONTACT/OWNER)
Alternative names: EVELYN MTN VIEW L L C, TOBAR INDUSTRIES
HEWLETT PACKARD COMPANY (301 E EVELYN AVENUE in MOUNTAIN VIEW, CA)
CRITERIA AND HAZARDOUS AIR POLLUTANT INVENTORY (Inventory of air pollution sources) (Resource Conservation and Recovery Act (tracking hazardous waste)) Business SIC classification: SEMICONDUCTORS AND RELATED DEVICES
NORTH'S BODY SHOP (83A PIONEER WAY in MOUNTAIN VIEW, CA)
CRITERIA AND HAZARDOUS AIR POLLUTANT INVENTORY (Inventory of air pollution sources) Small Quantity Generators, between 100 kg and 1000 kg of hazardous waste/month (Resource Conservation and Recovery Act (tracking hazardous waste)) - notification Business SIC classification: TOP, BODY, AND UPHOLSTERY REPAIR SHOPS AND PAINT SHOPS Business NAICS classification: OFFICE FURNITURE (EXCEPT WOOD) MANUFACTURING. Organizations: CINDY NORTH (CONTACT/OWNER)
EL GATO PAINTING (57 E EVELYN AVE in MOUNTAIN VIEW, CA)
Small Quantity Generators, between 100 kg and 1000 kg of hazardous waste/month (Resource Conservation and Recovery Act (tracking hazardous waste)) - notification Organizations: BYRON M JOHNSTON (CONTACT/OWNER)
LITTON APPLIED TECHNOLOGY (645 CLYDE AVENUE in MOUNTAIN VIEW, CA)
Small Quantity Generators, between 100 kg and 1000 kg of hazardous waste/month (Resource Conservation and Recovery Act (tracking hazardous waste)) - notification Organizations: PRUDENTIAL (CONTACT/OWNER)
M2 COLLISION CENTER (177 EAST EVELYN AVENUE in MOUNTAIN VIEW, CA)
CRITERIA AND HAZARDOUS AIR POLLUTANT INVENTORY (Inventory of air pollution sources) Small Quantity Generators, between 100 kg and 1000 kg of hazardous waste/month (Resource Conservation and Recovery Act (tracking hazardous waste)) - notification Business SIC classification: TOP, BODY, AND UPHOLSTERY REPAIR SHOPS AND PAINT SHOPS Organizations: ADAM PIPER (CONTACT/OWNER)
Alternative names: FCC AUTO BODY INCORPORATED, FCC AUTOBODY
Housing units lacking complete plumbing facilities: 0.1% Housing units lacking complete kitchen facilities: 0.4%
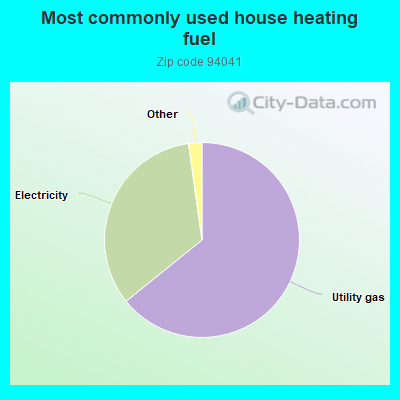
64.2%Utility gas
33.6%Electricity
0.8%No fuel used
0.7%Bottled, tank, or LP gas
0.6%Solar energy
Population in 1990: 13,438. Population change in the 1990s: +33 (+0.2%).
Place of birth for U.S.-born residents:
This state: 5,662
Northeast: 1,455
Midwest: 831
South: 455
West: 703
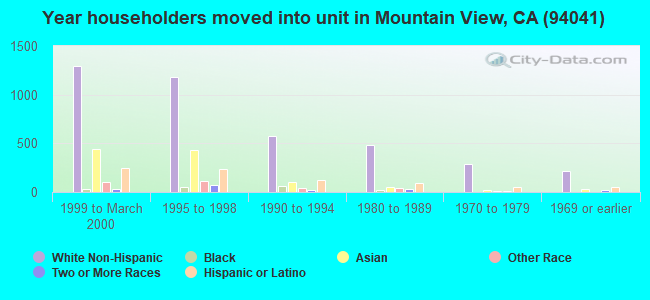
45% of the 94041 zip code residents lived in the same house 5 years ago. Out of people who lived in different houses, 50% lived in this county. Out of people who lived in different counties, 50% lived in California.
83% of the 94041 zip code residents lived in the same house 1 year ago. Out of people who lived in different houses, 36% moved from this county. Out of people who lived in different houses, 24% moved from different county within same state. Out of people who lived in different houses, 29% moved from different state. Out of people who lived in different houses, 12% moved from abroad.
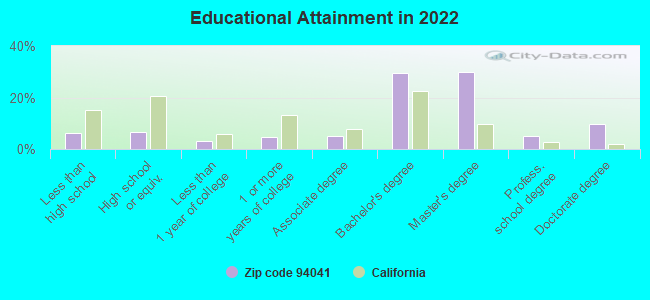
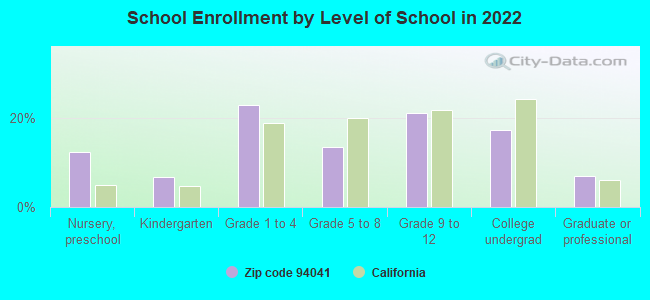
Private vs. public school enrollment:
Students in private schools in grades 1 to 8 (elementary and middle school): 208
Here:
18.2%
California:
10.5%
Students in private schools in grades 9 to 12 (high school): 136
Here:
20.8%
California:
8.5%
Students in private undergraduate colleges: 69
Here:
13.0%
California:
15.9%
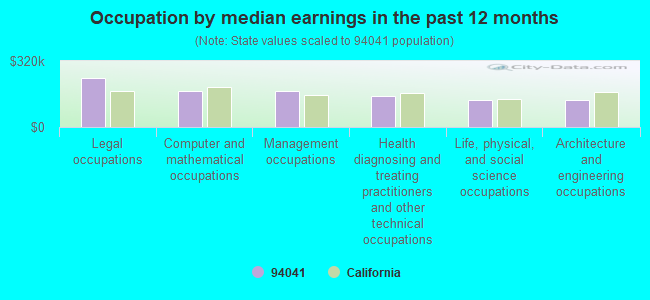
Occupation by median earnings in the past 12 months ($)
237,352Legal occupations
176,478Computer and mathematical occupations
172,464Management occupations
151,597Health diagnosing and treating practitioners and other technical occupations
131,871Life, physical, and social science occupations
131,174Architecture and engineering occupations
Companies with biggest federal contracts located in this zip code (MOUNTAIN VIEW, CA):
ACUITUS INC (650 CASTRO ST STE 280; small business) : $5,500,000 in 5 contractsfrom 2003 to 2005
Contracts for Other Defense -- Applied Research and Exploratory Development (R&D) by Navy Signed by year:2000: $0; 2001: $0; 2002: $0; 2003: $2,800,000; 2004: $0; 2005: $2,700,000; 2006: $0.
Biggest contracts:
$2,200,000 with Navy for Other Defense -- Applied Research and Exploratory Development (R&D). Signed on 2005-01-24. Completion date: 2006-10-30.
$2,000,000, same as above.Signed on 2003-12-10. Completion date: 2004-12-31.
$800,000, same as above.Signed on 2003-06-02. Completion date: 2004-12-31.
$500,000, same as above.Signed on 2005-12-20. Completion date: 2006-09-30.
LUMINESCENT TECHNOLOGIES, INC (650 CASTRO STREET; small business) : $848,950 in 4 contractsfrom 2003 to 2006
$450,000 with Army for Other Defense -- Applied Research and Exploratory Development (R&D). Signed on 2004-09-22. Completion date: 2006-10-30.
$260,000, same as above.Signed on 2006-02-01. Completion date: 2007-12-31.
$98,950, same as above.Signed on 2003-06-09. Completion date: 2004-01-05.
$40,000, same as above.Signed on 2004-03-25. Completion date: 2004-01-05.
CYTYC SURGICAL PRODUCTS (CYTYC SURGICAL PRODUCTS) : $790,226 in 110 contractsfrom 2003 to 2006
Contracts for Medical and Surgical Instruments, Equipment, and Supplies, Hospital Furniture, Equipment, Utensils, and Supplies, X-Ray Equipment and Supplies: Medical, Dental, Veterinary by Army, Navy, Air Force, Department of Veterans Affairs, and others Signed by year:2000: $0; 2001: $0; 2002: $0; 2003: $56,347; 2004: $186,692; 2005: $290,708; 2006: $256,479.
Biggest contracts:
$58,100 with Army for Medical and Surgical Instruments, Equipment, and Supplies. Taking place in TX. Signed on 2006-05-08. Completion date: 2007-05-07.
$36,600 with Army for Medical and Surgical Instruments, Equipment, and Supplies. Taking place in DC. Signed on 2006-06-02. Completion date: 2006-08-15.
$31,600 with Army for Medical and Surgical Instruments, Equipment, and Supplies. Taking place in KY. Signed on 2004-11-02. Completion date: 2005-09-30.
$29,431 with Army for Medical and Surgical Instruments, Equipment, and Supplies. Signed on 2005-10-31. Completion date: 2005-10-31.
INTELLISYS GROUP (140 EAST DANA STREET; small business) : $602,164 in 7 contractsfrom 2000 to 2001
Contracts for Miscellaneous Communication Equipment, Sound Recording and Reproducing Equipment, ADP Input/Output and Storage Devices, Installation of Equipment -- Communication, Detection, and Coherent Radiation Equipment, and moreby U.S. Army Corps of Engineers - civil program financing only, Air Force, Army, Navy, and others Signed by year:2000: $848,474; 2001: -$246,310; 2002: $0; 2003: $0; 2004: $0; 2005: $0; 2006: $0.
Biggest contracts:
$474,415 with U.S. Army Corps of Engineers - civil program financing only for Miscellaneous Communication Equipment. Taking place in TX. Signed on 2000-04-26. Completion date: 2000-05-31.
$170,310 with Air Force for Sound Recording and Reproducing Equipment. Signed on 2000-09-29. Completion date: 2000-09-29.
$81,923 with Army for ADP Input/Output and Storage Devices. Taking place in TX. Signed on 2000-09-29. Completion date: 2000-11-03.
$76,000 with Air Force for Installation of Equipment -- Communication, Detection, and Coherent Radiation Equipment. Signed on 2000-09-30. Completion date: 2000-09-30.
TUFAN, INC (82 PIONEER WAY) : $486,450 in 4 contractsfrom 2000 to 2004
$132,700 with Air Force for Other ADP and Telecommunications Services (includes data storage on tapes, compact disks, etc.). Taking place in OH. Signed on 2002-10-25. Completion date: 2002-09-30.
$125,000, same as above.Signed on 2001-11-05. Completion date: 2002-09-30.
$125,000, same as above.Signed on 2000-12-20. Completion date: 2001-09-30.
$103,750 with Air Force for ADP Software. Signed on 2004-02-05. Completion date: 2005-01-31.
QUANTUM VISION, INC (188 SOUTH WHISMAN ROAD; small business)
$249,985 with Air Force for Other Research and Development -- Management and Support (R&D). Signed on 2001-08-02. Completion date: 2002-05-01.
QUOVA, INC (333 W EVELYN AVE; small business) : $212,200 in 3 contractsfrom 2003 to 2004
$81,200 with Offices, Boards and Divisions (includes Attorney General, Deputy Attorney General, etc.) for Expert Witness. Signed on 2003-09-01. Completion date: 2004-06-30.
$80,000 with Navy for ADP Software. Taking place in DC. Signed on 2004-08-19. Completion date: 2005-08-18.
$51,000, same as above.Signed on 2004-05-26. Completion date: 2005-05-26.
GALE ASSOCIATES INC (444 CASTRO STREET, SUITE 3) : $174,785 in 18 contractsfrom 2000 to 2003
Contracts for Architect - Engineer Services (including landscaping, interior layout, and designing), Other Special Studies and Analyses by Navy Signed by year:2000: $158,403; 2001: -$20,405; 2002: -$6,252; 2003: $43,039; 2004: $0; 2005: $0; 2006: $0.
Biggest contracts:
$100,224 with Navy for Architect - Engineer Services (including landscaping, interior layout, and designing). Signed on 2000-04-20. Completion date: 2001-02-07.
$83,175, same as above.Signed on 2000-04-21. Completion date: 2001-04-21.
$25,825 with Navy for Other Special Studies and Analyses. Signed on 2003-04-02. Completion date: 2003-07-15.
$19,978, same as above.Signed on 2003-05-22. Completion date: 2003-07-15.
CENTURION SALES CO, INC (320 MOUNTAIN VIEW AVE; small business) : $160,856 in 4 contractsfrom 2002 to 2005
$133,980 with Army for Athletic and Sporting Equipment. Signed on 2005-09-29. Completion date: 2005-12-08.
$12,906, same as above.Signed on 2005-05-13. Completion date: 2005-06-02.
$12,475, same as above.Signed on 2002-11-21. Completion date: 2002-12-31.
$1,495, same as above.Signed on 2005-07-20. Completion date: 2005-07-31.
INTEGRATION ASSOCIATES INCORPO (110 PIONEER WAY UNIT L; small business)
$110,000 with Department of Defense for Switches. Signed on 2000-12-04. Completion date: 2001-04-10.
Top industries in this zip code by the number of employees in 2005:
Administrative and Support and Waste Management and Remediation Services: Temporary Help Services (100-249: 1, 50-99: 1, 20-49: 2, 1-4: 4)
Professional, Scientific, and Technical Services: Research and Development in the Physical, Engineering, and Life Sciences (50-99: 1, 20-49: 3, 10-19: 4, 1-4: 3)
2006 - 2016 National Fire Incident Reporting System (NFIRS) incidents
According to the data from the years 2006 - 2016 the average number of fire incidents per year is 67. The highest number of fire incidents - 119 took place in 2008, and the least - 0 in 2013. The data has an increasing trend.
When looking into fire subcategories, the most incidents belonged to: Outside Fires (42.5%), and Structure Fires (32.2%).
Fire incident types reported to NFIRS in Zip Code 94041


 Nearest zip codes: 94040, 94043, 94024, 94087, 94086, 94085.
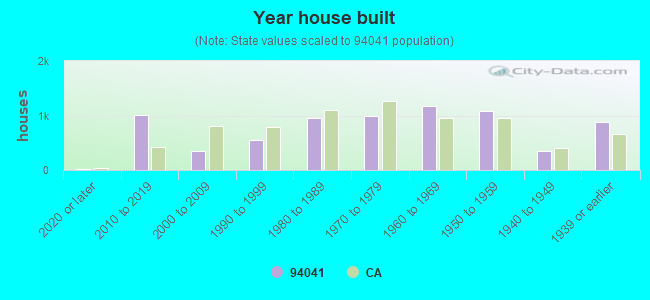


 According to the data from the years 2006 - 2016 the average number of fire incidents per year is 67. The highest number of fire incidents - 119 took place in 2008, and the least - 0 in 2013. The data has an increasing trend.
 When looking into fire subcategories, the most incidents belonged to: Outside Fires (42.5%), and Structure Fires (32.2%).