Estimated zip code population in 2022: 27,989 Zip code population in 2010: 27,184 Zip code population in 2000: 26,891
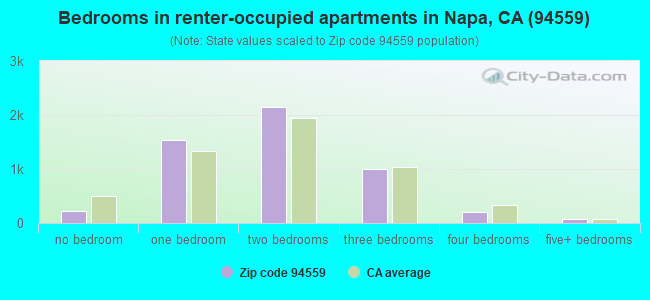
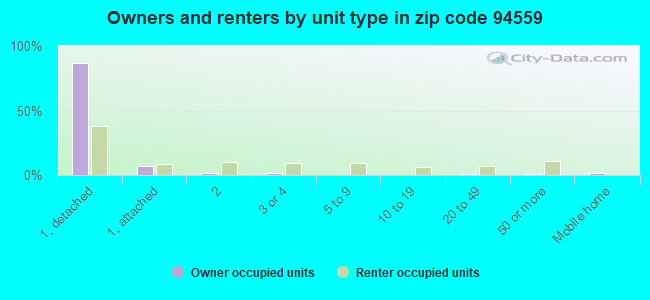
Houses and condos: 11,594 Renter-occupied apartments: 5,206
% of renters here:
50%
State:
44%
March 2022 cost of living index in zip code 94559: 119.6 (more than average, U.S. average is 100)
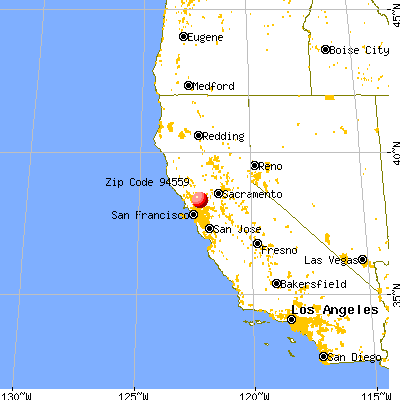
Land area: 36.7 sq. mi. Water area: 2.2 sq. mi.
Population density: 764 people per square mile
(low).
OSM Map
General Map
Google Map
MSN Map
OSM Map
General Map
Google Map
MSN Map
OSM Map
General Map
Google Map
MSN Map
OSM Map
General Map
Google Map
MSN Map
Please wait while loading the map...
Real estate property taxes paid for housing units in 2022:
This zip code:
0.7% ($5,756)
California:
0.7% ($4,831)
Median real estate property taxes paid for housing units with mortgages in 2022: $6,629 (0.8%) Median real estate property taxes paid for housing units with no mortgage in 2022: $4,508 (0.5%)
Estimated median house/condo value in 2022: $858,906
94559:
$858,906
California:
$715,900
According to our research of California and other state lists, there were 15 registered sex offenders living in 94559 zip code as of April 19, 2024. The ratio of all residents to sex offenders in zip code 94559 is 1,917 to 1. The ratio of registered sex offenders to all residents in this zip code is much lower than the state average.
Median resident age:
This zip code:
39.3 years
California median age:
37.9 years
Average household size:
This zip code:
2.6 people
California:
2.8 people
Averages for the 2020 tax year for zip code 94559, filed in 2021:
Average Adjusted Gross Income (AGI) in 2020: $90,913 (Individual Income Tax Returns)
Here:
$90,913
State:
$95,910
Salary/wage: $69,723 (reported on 80.7% of returns)
Here:
$69,723
State:
$77,331
(% of AGI for various income ranges: 1460.7% for AGIs below $25k, 4527.8% for AGIs $25k-50k, 7453.2% for AGIs $50k-75k, 10794.2% for AGIs $75k-100k, 19865.4% for AGIs $100k-200k, 95631.9% for AGIs over 200k)
Taxable interest for individuals: $2,017 (reported on 35.9% of returns)
This zip code:
$2,017
California:
$2,294
(% of AGI for various income ranges: 23.5% for AGIs below $25k, 23.8% for AGIs $25k-50k, 56.2% for AGIs $50k-75k, 112.8% for AGIs $75k-100k, 222.3% for AGIs $100k-200k, 1881.9% for AGIs over 200k)
Ordinary dividends: $15,572 (reported on 22.1% of returns)
Here:
$15,572
State:
$10,949
(% of AGI for various income ranges: 47.4% for AGIs below $25k, 64.2% for AGIs $25k-50k, 129.0% for AGIs $50k-75k, 225.3% for AGIs $75k-100k, 628.4% for AGIs $100k-200k, 13078.9% for AGIs over 200k)
Net capital gain/loss in AGI: +$36,327 (reported on 21.0% of returns)
Here:
+$36,327
State:
+$49,306
(% of AGI for various income ranges: 14.9% for AGIs below $25k, 46.8% for AGIs $25k-50k, 128.5% for AGIs $50k-75k, 374.5% for AGIs $75k-100k, 803.8% for AGIs $100k-200k, 33837.4% for AGIs over 200k)
Profit/loss from business: +$28,870 (reported on 17.8% of returns)
Here:
+$28,870
State:
+$15,671
(% of AGI for various income ranges: 185.0% for AGIs below $25k, 248.0% for AGIs $25k-50k, 364.2% for AGIs $50k-75k, 510.0% for AGIs $75k-100k, 1654.1% for AGIs $100k-200k, 13463.7% for AGIs over 200k)
Taxable individual retirement arrangement distribution: $24,857 (reported on 8.5% of returns)
94559:
$24,857
California:
$23,505
(% of AGI for various income ranges: 49.1% for AGIs below $25k, 67.4% for AGIs $25k-50k, 172.4% for AGIs $50k-75k, 407.2% for AGIs $75k-100k, 1070.0% for AGIs $100k-200k, 3815.2% for AGIs over 200k)
Self-employed (Keogh) retirement plans: $26,855 (reported on 1.4% of returns)
94559:
$26,855
California:
$30,163
(% of AGI for various income ranges: 10.6% for AGIs below $25k, 22.6% for AGIs $50k-75k, 100.5% for AGIs $100k-200k, 1418.5% for AGIs over 200k)
Total itemized deductions: $35,722 (reported on 16.2% of returns)
Here:
$35,722
State:
$39,517
(% of AGI for various income ranges: 175.2% for AGIs below $25k, 216.1% for AGIs $25k-50k, 522.2% for AGIs $50k-75k, 1135.2% for AGIs $75k-100k, 2296.8% for AGIs $100k-200k, 11839.6% for AGIs over 200k)
Charity contributions: $7,529 (reported on 12.3% of returns)
Here:
$7,529
State:
$12,598
(% of AGI for various income ranges: 6.6% for AGIs below $25k, 10.3% for AGIs $25k-50k, 37.8% for AGIs $50k-75k, 77.0% for AGIs $75k-100k, 276.5% for AGIs $100k-200k, 3140.0% for AGIs over 200k)
Taxes paid: $8,645 (reported on 16.2% of returns)
94559:
$8,645
State:
$8,807
(% of AGI for various income ranges: 27.6% for AGIs below $25k, 47.7% for AGIs $25k-50k, 127.6% for AGIs $50k-75k, 328.0% for AGIs $75k-100k, 655.5% for AGIs $100k-200k, 2463.0% for AGIs over 200k)
Earned income credit: $1,685 (reported on 9.5% of returns)
Here:
$1,685
State:
$2,074
(% of AGI for various income ranges: 63.1% for AGIs below $25k, 46.8% for AGIs $25k-50k, 1.1% for AGIs $50k-75k)
Percentage of individuals using paid preparers for their 2020 taxes: 91.0%
Here:
91%
State:
92%
(% for various income ranges: 88.8% for AGIs below $25k, 89.2% for AGIs $25k-50k, 91.0% for AGIs $50k-75k, 92.4% for AGIs $75k-100k, 93.2% for AGIs $100k-200k, 96.6% for AGIs over 200k)
Averages for the 2012 tax year for zip code 94559, filed in 2013:
Average Adjusted Gross Income (AGI) in 2012: $60,352 (Individual Income Tax Returns)
Here:
$60,352
State:
$72,726
Salary/wage: $50,733 (reported on 82.4% of returns)
Here:
$50,733
State:
$59,079
(% of AGI for various income ranges: 78.6% for AGIs below $25k, 80.1% for AGIs $25k-50k, 74.5% for AGIs $50k-75k, 70.8% for AGIs $75k-100k, 69.0% for AGIs $100k-200k, 55.0% for AGIs over 200k)
Taxable interest for individuals: $1,560 (reported on 35.4% of returns)
This zip code:
$1,560
California:
$2,146
(% of AGI for various income ranges: 1.0% for AGIs below $25k, 0.7% for AGIs $25k-50k, 0.7% for AGIs $50k-75k, 0.7% for AGIs $75k-100k, 0.8% for AGIs $100k-200k, 1.4% for AGIs over 200k)
Ordinary dividends: $6,826 (reported on 19.3% of returns)
Here:
$6,826
State:
$9,308
(% of AGI for various income ranges: 1.7% for AGIs below $25k, 1.0% for AGIs $25k-50k, 1.8% for AGIs $50k-75k, 1.9% for AGIs $75k-100k, 1.9% for AGIs $100k-200k, 3.9% for AGIs over 200k)
Net capital gain/loss in AGI: +$16,044 (reported on 16.0% of returns)
Here:
+$16,044
State:
+$30,460
(% of AGI for various income ranges: 1.0% for AGIs $50k-75k, 1.2% for AGIs $75k-100k, 1.3% for AGIs $100k-200k, 15.4% for AGIs over 200k)
Profit/loss from business: +$20,818 (reported on 16.5% of returns)
Here:
+$20,818
State:
+$17,064
(% of AGI for various income ranges: 8.6% for AGIs below $25k, 4.4% for AGIs $25k-50k, 4.3% for AGIs $50k-75k, 6.3% for AGIs $75k-100k, 5.7% for AGIs $100k-200k, 6.2% for AGIs over 200k)
Taxable individual retirement arrangement distribution: $17,151 (reported on 8.6% of returns)
94559:
$17,151
California:
$19,557
(% of AGI for various income ranges: 2.4% for AGIs below $25k, 1.4% for AGIs $25k-50k, 2.5% for AGIs $50k-75k, 3.1% for AGIs $75k-100k, 3.1% for AGIs $100k-200k, 2.1% for AGIs over 200k)
Self-employment retirement plans: $15,736 (reported on 1.1% of returns)
94559:
$15,736
California:
$24,530
(% of AGI for various income ranges: 0.4% for AGIs $50k-75k, 0.4% for AGIs $100k-200k, 0.5% for AGIs over 200k)
Total itemized deductions: $29,413 (25% of AGI, reported on 32.5% of returns)
Here:
$29,413
State:
$34,004
Here:
25.2% of AGI
State:
22.7% of AGI
(% of AGI for various income ranges: 12.4% for AGIs below $25k, 8.7% for AGIs $25k-50k, 15.2% for AGIs $50k-75k, 18.3% for AGIs $75k-100k, 19.0% for AGIs $100k-200k, 17.8% for AGIs over 200k)
Charity contributions: $3,009 (reported on 25.9% of returns)
Here:
$3,009
State:
$4,659
(% of AGI for various income ranges: 0.4% for AGIs below $25k, 0.6% for AGIs $25k-50k, 1.0% for AGIs $50k-75k, 1.4% for AGIs $75k-100k, 1.5% for AGIs $100k-200k, 1.9% for AGIs over 200k)
Taxes paid: $11,209 (reported on 32.4% of returns)
94559:
$11,209
State:
$14,448
(% of AGI for various income ranges: 2.3% for AGIs below $25k, 1.9% for AGIs $25k-50k, 4.1% for AGIs $50k-75k, 5.8% for AGIs $75k-100k, 7.3% for AGIs $100k-200k, 10.0% for AGIs over 200k)
Earned income credit: $1,940 (reported on 12.6% of returns)
Here:
$1,940
State:
$2,286
(% of AGI for various income ranges: 3.8% for AGIs below $25k, 0.7% for AGIs $25k-50k)
Percentage of individuals using paid preparers for their 2012 taxes: 57.6%
Here:
58%
State:
64%
(% for various income ranges: 51.5% for AGIs below $25k, 55.8% for AGIs $25k-50k, 62.0% for AGIs $50k-75k, 63.0% for AGIs $75k-100k, 65.5% for AGIs $100k-200k, 74.5% for AGIs over 200k)
Averages for the 2004 tax year for zip code 94559, filed in 2005:
Average Adjusted Gross Income (AGI) in 2004: $50,083 (Individual Income Tax Returns)
Here:
$50,083
State:
$58,600
Salary/wage: $43,388 (reported on 81.5% of returns)
Here:
$43,388
State:
$49,455
(% of AGI for various income ranges: 155.2% for AGIs below $10k, 75.3% for AGIs $10k-25k, 80.4% for AGIs $25k-50k, 76.9% for AGIs $50k-75k, 76.6% for AGIs $75k-100k, 57.3% for AGIs over 100k)
Taxable interest for individuals: $2,017 (reported on 45.3% of returns)
This zip code:
$2,017
California:
$2,365
(% of AGI for various income ranges: 11.6% for AGIs below $10k, 2.0% for AGIs $10k-25k, 1.6% for AGIs $25k-50k, 1.4% for AGIs $50k-75k, 1.7% for AGIs $75k-100k, 1.9% for AGIs over 100k)
Taxable dividends: $4,039 (reported on 24.2% of returns)
Here:
$4,039
State:
$4,746
(% of AGI for various income ranges: 10.8% for AGIs below $10k, 1.8% for AGIs $10k-25k, 1.2% for AGIs $25k-50k, 1.3% for AGIs $50k-75k, 1.5% for AGIs $75k-100k, 2.7% for AGIs over 100k)
Net capital gain/loss: +$12,628 (reported on 20.5% of returns)
Here:
+$12,628
State:
+$23,418
(% of AGI for various income ranges: -0.2% for AGIs below $10k, 0.2% for AGIs $10k-25k, 0.5% for AGIs $25k-50k, 0.9% for AGIs $50k-75k, 1.9% for AGIs $75k-100k, 12.1% for AGIs over 100k)
Profit/loss from business: +$18,395 (reported on 16.0% of returns)
Here:
+$18,395
State:
+$16,826
(% of AGI for various income ranges: -7.7% for AGIs below $10k, 7.3% for AGIs $10k-25k, 3.4% for AGIs $25k-50k, 5.0% for AGIs $50k-75k, 5.8% for AGIs $75k-100k, 7.7% for AGIs over 100k)
IRA payment deduction: $3,073 (reported on 2.4% of returns)
94559:
$3,073
California:
$3,192
(% of AGI for various income ranges: 0.2% for AGIs $10k-25k, 0.1% for AGIs $25k-50k, 0.2% for AGIs $50k-75k, 0.2% for AGIs $75k-100k, 0.1% for AGIs over 100k)
Self-employed pension: $13,074 (reported on 1.8% of returns)
Here:
$13,074
California:
$17,688
(% of AGI for various income ranges: 0.1% for AGIs $10k-25k, 0.1% for AGIs $25k-50k, 0.3% for AGIs $50k-75k, 0.5% for AGIs $75k-100k, 0.8% for AGIs over 100k)
Total itemized deductions: $24,036 (27% of AGI, reported on 36.5% of returns)
Here:
$24,036
State:
$28,113
Here:
26.7% of AGI
State:
25.3% of AGI
(% of AGI for various income ranges: 43.3% for AGIs below $10k, 13.1% for AGIs $10k-25k, 13.6% for AGIs $25k-50k, 18.4% for AGIs $50k-75k, 21.1% for AGIs $75k-100k, 18.4% for AGIs over 100k)
Charity contributions deductions: $2,581 (3% of AGI, reported on 31.5% of returns)
Here:
$2,581
State:
$3,923
Here:
2.7% of AGI
State:
3.3% of AGI
(% of AGI for various income ranges: 1.6% for AGIs below $10k, 0.7% for AGIs $10k-25k, 0.9% for AGIs $25k-50k, 1.4% for AGIs $50k-75k, 1.9% for AGIs $75k-100k, 2.2% for AGIs over 100k)
Total tax: $7,769 (reported on 77.0% of returns)
94559:
$7,769
State:
$10,761
(% of AGI for various income ranges: 5.7% for AGIs below $10k, 4.4% for AGIs $10k-25k, 7.0% for AGIs $25k-50k, 9.6% for AGIs $50k-75k, 10.9% for AGIs $75k-100k, 17.9% for AGIs over 100k)
Earned income credit: $1,542 (reported on 11.5% of returns)
Here:
$1,542
State:
$1,763
Percentage of individuals using paid preparers for their 2004 taxes: 61.4%
Here:
61%
State:
66%
(% for various income ranges: 53.3% for AGIs below $10k, 59.9% for AGIs $10k-25k, 59.0% for AGIs $25k-50k, 66.4% for AGIs $50k-75k, 65.2% for AGIs $75k-100k, 73.8% for AGIs over 100k)
Likely homosexual households (counted as self-reported same-sex unmarried-partner households)
Lesbian couples: 0.2% of all households
Gay men: 0.1% of all households
Household received Food Stamps/SNAP in the past 12 months: 885 Household did not receive Food Stamps/SNAP in the past 12 months: 9,512
Women who had a birth in the past 12 months: 261 (155 now married, 106 unmarried) Women who did not have a birth in the past 12 months: 6,459 (2,584 now married, 3,873 unmarried)
Housing units in zip code 94559 with a mortgage: 3,503 (465 second mortgage, 5 home equity loan, 347 both second mortgage and home equity loan) Houses without a mortgage: 56
Median monthly owner costs for units with a mortgage: $2,691 Median monthly owner costs for units without a mortgage: $818
Residents with income below the poverty level in 2022:
This zip code:
8.6%
Whole state:
12.2%
Residents with income below 50% of the poverty level in 2022:
This zip code:
5.8%
Whole state:
6.2%
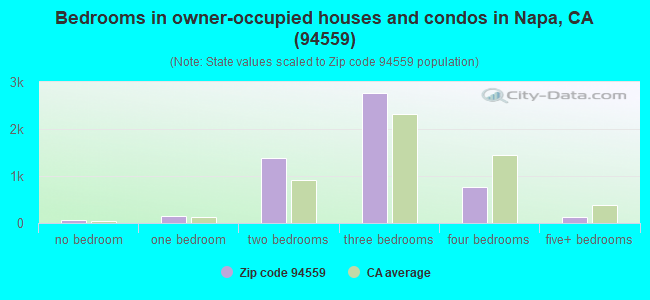
Median number of rooms in houses and condos:
Here:
5.7
State:
6.0
Median number of rooms in apartments:
Here:
4.0
State:
3.9
Notable locations in this zip code not listed on our city pages
Notable locations in zip code 94559: Lachman Club (A), Juarez Old Adobe (B), Camp Coombs (C), Bouchard Vineyards (D), Acacia Winery (E), Lisbon Winery (F), Mont Saint John Cellars (G), West End Land Club (H), Napa City Fire Department Station 1 (I), Napa County Hall of Justice (J), Napa City-County Library (K), Manassee Mansion (L), Noyes Mansion (M), Napa Opera House (N), Napa Law Center (O), Napa County Law Library (P), Napa County Courthouse (Q), Holden Mansion (R), Goodman Library (S), Churchill Manor (T). Display/hide their locations on the map
Shopping Centers: Napa Retail Center Shopping Center (1), Riverpark Shopping Center (2), Napa Town Center Shopping Center (3), Coombs-Imola Shopping Center (4). Display/hide their locations on the map
Churches in zip code 94559 include: First Presbyterian Church (A), First United Methodist Church (B), Advent Christian Church (C), Congregation Beth Sholom (D), First Baptist Church (E), First Church of Christ Scientist (F), Grace Baptist Church (G), Lutheran Church of the Redeemer (H), Saint John the Baptist Roman Catholic Church (I). Display/hide their locations on the map
Streams, rivers, and creeks: Carneros Creek (A), Fagan Slough (B), Huichica Creek (C), Kreuse Creek (D), Murphy Creek (E), Napa Creek (F), Suscol Creek (G), Spencer Creek (H). Display/hide their locations on the map
Parks in zip code 94559 include: South Park (1), Fuller Park (2), Camille Park (3), Shurtleff Park (4), Fairview Park (5), Napa Valley Exposition (6). Display/hide their locations on the map
3,593 married couples with children.
1,508 single-parent households (533 men, 975 women).
61.8% of residents of 94559 zip code speak English at home.
34.2% of residents speak Spanish at home (52% very well, 21% well, 18% not well, 9% not at all).
2.8% of residents speak other Indo-European language at home (76% very well, 22% well, 2% not well, 1% not at all).
0.9% of residents speak Asian or Pacific Island language at home (58% very well, 32% well, 10% not well).
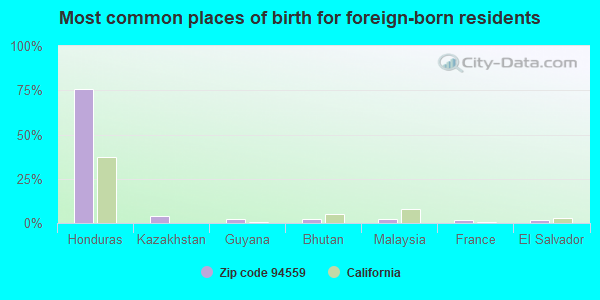
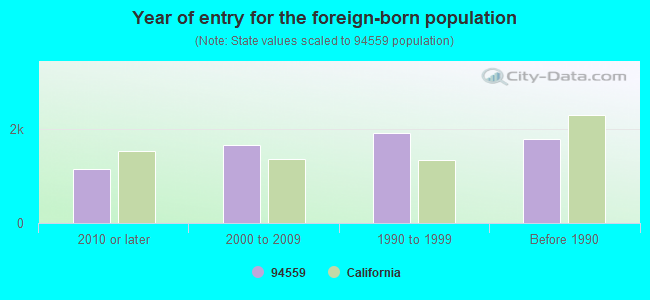
Foreign born population: 6,067 (21.7%) (44.6% of them are naturalized citizens)
Major facilities with environmental interests located in this zip code:
CHEVRON STATION NO 94820 (800 W IMOLA AVE in NAPA, CA)
STATE MASTER (California - Hazardous Waste Tracking) - HAZARDOU WASTE PROGRAM HAZARDOUS WASTE BIENNIAL REPORTER (Resource Conservation and Recovery Act (tracking hazardous waste)) Large Quantity Generators, more that 1000 kg of hazardous waste/month (Resource Conservation and Recovery Act (tracking hazardous waste)) Small Quantity Generators, between 100 kg and 1000 kg of hazardous waste/month (Resource Conservation and Recovery Act (tracking hazardous waste)) - notification Organizations: CHEVRON PRODUCTS CO (CONTACT/OWNER)
Alternative names: CHEVRON NO 94820
JIMMY VASSER V S AUTOMOTIVE (583 SOSCOL AVE in NAPA, CA)
STATE MASTER (California - Hazardous Waste Tracking) - HAZARDOU WASTE PROGRAM Small Quantity Generators, between 100 kg and 1000 kg of hazardous waste/month (Resource Conservation and Recovery Act (tracking hazardous waste)) - notification Organizations: ED BOZARTH (CONTACT/OWNER)
Alternative names: VS AUTOMOTIVE INC
MAIERS GARAGE (360 TAYLOR in NAPA, CA)
STATE MASTER (California - Hazardous Waste Tracking) - HAZARDOU WASTE PROGRAM Small Quantity Generators, between 100 kg and 1000 kg of hazardous waste/month (Resource Conservation and Recovery Act (tracking hazardous waste)) - notification Business NAICS classification: GENERAL AUTOMOTIVE REPAIR. Organizations: BARTHEL ROBERT (CONTACT/OWNER)
MCM JOBES (1824 YAJOME ST in NAPA, CA)
STATE MASTER (California - Hazardous Waste Tracking) - HAZARDOU WASTE PROGRAM Small Quantity Generators, between 100 kg and 1000 kg of hazardous waste/month (Resource Conservation and Recovery Act (tracking hazardous waste)) - notification Organizations: MCCARTH DUANE & GREG (CONTACT/OWNER)
Alternative names: MCM JOBES REPAIR INC
ALTA HEIGHTS ELEMENTARY SCHOOL (15 MONTECITO BLVD in NAPA, CA)
(Geographic Names Information System) (National Center for Education Statistics) - STATE ID-6026769 Organizations: NAPA VALLEY UNIFIED (SCHOOL DISTRICT)
NAPA VALLEY RAILROAD (800 8TH ST in NAPA, CA)
STATE MASTER (California - Hazardous Waste Tracking) - HAZARDOU WASTE PROGRAM Small Quantity Generators, between 100 kg and 1000 kg of hazardous waste/month (Resource Conservation and Recovery Act (tracking hazardous waste)) - notification Organizations: NAPA VALLEY WINE TRAIN INC (CONTACT/OWNER)
ALTERNATIVE/OPPORTUNITY (2121 IMOLA AVE. in NAPA, CA)
(National Center for Education Statistics) - STATE ID-2830107 Organizations: NAPA CO. OFFICE OF EDUCATION (SCHOOL DISTRICT)
JUVENILE HALL (2121 IMOLA AVE. in NAPA, CA)
(National Center for Education Statistics) - STATE ID-2830073 Organizations: NAPA CO. OFFICE OF EDUCATION (SCHOOL DISTRICT)
NAPA VALLEY CHARTER (575 THIRD ST. in NAPA, CA)
(National Center for Education Statistics) - STATE ID-6118152 Organizations: TWIN RIDGES ELEMENTARY (SCHOOL DISTRICT)
NEW TECHNOLOGY HIGH (ALT) (920 YOUNT ST. in NAPA, CA)
(National Center for Education Statistics) - STATE ID-2830115 Organizations: NAPA VALLEY UNIFIED (SCHOOL DISTRICT)
CARNEROS ELEMENTARY (1680 LOS CARNEROS AVE. in NAPA, CA)
(National Center for Education Statistics) - STATE ID-6026801 Organizations: NAPA VALLEY UNIFIED (SCHOOL DISTRICT)
FIDELS AUTO BODY INC CARSTAR (1162 JORDAN LN STE A in NAPA, CA)
GREENBERGS REPAIR SHOP (796 SOSCOL AVE in NAPA, CA)
Small Quantity Generators, between 100 kg and 1000 kg of hazardous waste/month (Resource Conservation and Recovery Act (tracking hazardous waste)) - notification Organizations: JOHN GREENBERG (CONTACT/OWNER)
Housing units lacking complete plumbing facilities: 1.0% Housing units lacking complete kitchen facilities: 2.2%
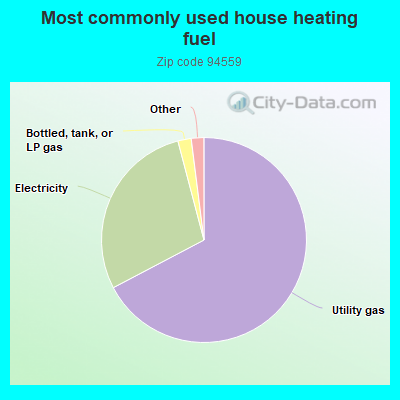
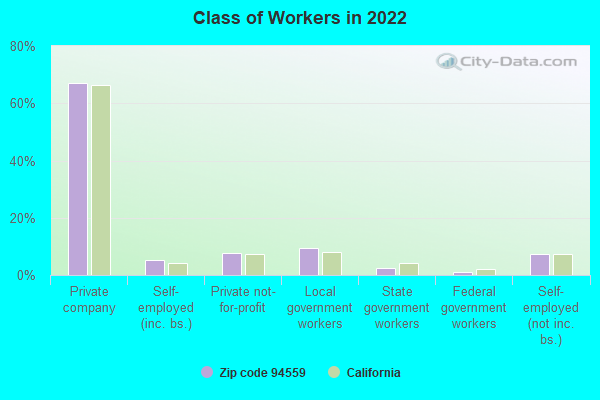
67.3%Utility gas
28.6%Electricity
2.1%Bottled, tank, or LP gas
0.7%Wood
0.6%Solar energy
0.6%No fuel used
Population in 1990: 23,606. Population change in the 1990s: +3,285 (+13.9%).
Place of birth for U.S.-born residents:
This state: 16,579
Northeast: 1,443
Midwest: 1,404
South: 902
West: 1,047
50% of the 94559 zip code residents lived in the same house 5 years ago. Out of people who lived in different houses, 66% lived in this county. Out of people who lived in different counties, 50% lived in California.
88% of the 94559 zip code residents lived in the same house 1 year ago. Out of people who lived in different houses, 51% moved from this county. Out of people who lived in different houses, 37% moved from different county within same state. Out of people who lived in different houses, 11% moved from different state. Out of people who lived in different houses, 0% moved from abroad.
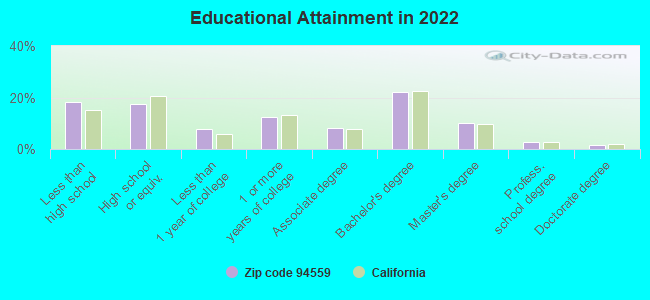
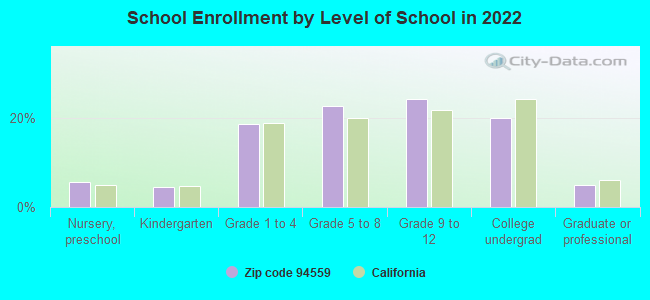
Private vs. public school enrollment:
Students in private schools in grades 1 to 8 (elementary and middle school): 334
Here:
12.4%
California:
10.5%
Students in private schools in grades 9 to 12 (high school): 167
Here:
10.6%
California:
8.5%
Students in private undergraduate colleges: 222
Here:
17.0%
California:
15.9%
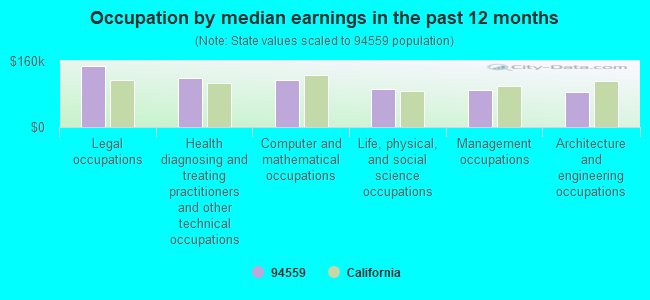
Occupation by median earnings in the past 12 months ($)
147,355Legal occupations
119,507Health diagnosing and treating practitioners and other technical occupations
113,364Computer and mathematical occupations
91,168Life, physical, and social science occupations
88,557Management occupations
85,716Architecture and engineering occupations
Companies with federal contracts located in this zip code (NAPA, CA):
STATISTICAL SIGNAL PROCESSING, (1909 JEFFERSON ST; small business) : $1,483,826 in 12 contractsfrom 2000 to 2004
Contracts for Defense Electronics and Communication Equipment -- Applied Research and Exploratory Development (R&D), Other Defense -- Advanced Development (R&D), Defense Electronics and Communication Equipment -- Basic Research (R&D) by Army, Department of Defense Signed by year:2000: $70,000; 2001: $413,634; 2002: $826,518; 2003: $0; 2004: $173,674; 2005: $0; 2006: $0.
Biggest contracts:
$354,140 with Army for Defense Electronics and Communication Equipment -- Applied Research and Exploratory Development (R&D). Signed on 2002-08-13. Completion date: 2004-03-15.
$275,860, same as above.Signed on 2002-03-11. Completion date: 2004-03-15.
$173,634 with Department of Defense for Other Defense -- Advanced Development (R&D). Signed on 2001-06-21. Completion date: 2003-02-20.
$150,000, same as above.Signed on 2002-05-03. Completion date: 2003-02-20.
SKY+ LTD (1098 JORDAN LANE; small business) : $849,409 in 4 contractsfrom 2002 to 2004
$451,364 with Army for Other Research and Development -- Management and Support (R&D). Signed on 2003-11-06. Completion date: 2005-12-11.
$278,562, same as above.Signed on 2004-07-22. Completion date: 2005-12-11.
$69,932, same as above.Signed on 2002-12-18. Completion date: 2003-07-02.
$49,551, same as above.Signed on 2003-07-14. Completion date: 2003-07-02.
CHARLES D HERSEY (424 MONTGOMERY ST; small business) : $719,221 in 9 contractsfrom 1999 to 2005
Contracts for Other Medical Services, Radiology Services by Air Force Signed by year:2000: $89,335; 2001: $93,808; 2002: $98,509; 2003: $103,438; 2004: $108,618; 2005: $144,477; 2006: $0.
Biggest contracts:
$150,177 with Air Force for Other Medical Services. Signed on 2005-11-01. Completion date: 2006-09-30.
$108,618 with Air Force for Radiology Services. Signed on 2004-10-01. Completion date: 2005-09-30.
$103,438, same as above.Signed on 2003-10-01. Completion date: 2005-09-30.
$98,509, same as above.Signed on 2002-10-01. Completion date: 2003-09-30.
SONOMA RESEARCH COMPANY (101 S COOMBS ST STE L; small business)
$144,442 with Navy for Defense Ships -- Applied Research and Exploratory Development (R&D). Signed on 2000-05-12. Completion date: 2001-04-21.
BRC ENGINEERING (1089 4TH AVE; small business) : $71,020 in 3 contractsfrom 2004 to 2006
$54,515 with Air Force for Radio and Television Communication Equipment, Airborne. Signed on 2004-12-16. Completion date: 2005-02-18.
$11,970 with Army for Laboratory Equipment and Supplies. Signed on 2006-05-31. Completion date: 2006-06-30.
$4,535 with Army for Electrical and Electronic Properties Measuring and Testing Instruments. Signed on 2006-03-02. Completion date: 2006-03-21.
SPITERI BROTHERS INC (1601 ACTION AVE; small business) : $36,710 in 3 contractsfrom 2001 to 2002
$24,650 with Air Force for Maintenance, Repair or Alteration of Real Property -- Recreational Buildings. Signed on 2002-09-30. Completion date: 2002-10-18.
$10,660, same as above.Signed on 2001-02-06. Completion date: 2001-03-06.
$1,400, same as above.Signed on 2001-02-28. Completion date: 2001-02-28.
Top industries in this zip code by the number of employees in 2005:
2005 - 2018 National Fire Incident Reporting System (NFIRS) incidents
According to the data from the years 2005 - 2018 the average number of fire incidents per year is 10. The highest number of reported fire incidents - 24 took place in 2017, and the least - 3 in 2005. The data has an increasing trend.
When looking into fire subcategories, the most reports belonged to: Outside Fires (63.4%), and Structure Fires (22.1%).
Fire incident types reported to NFIRS in Zip Code 94559


 Nearest zip codes: 94503, 94589, 94590, 95476, 94592, 94591.


 According to the data from the years 2005 - 2018 the average number of fire incidents per year is 10. The highest number of reported fire incidents - 24 took place in 2017, and the least - 3 in 2005. The data has an increasing trend.
 When looking into fire subcategories, the most reports belonged to: Outside Fires (63.4%), and Structure Fires (22.1%).