Estimated zip code population in 2022: 26,793 Zip code population in 2010: 23,299 Zip code population in 2000: 24,501
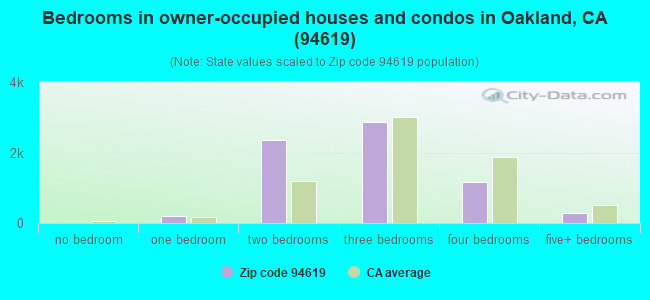
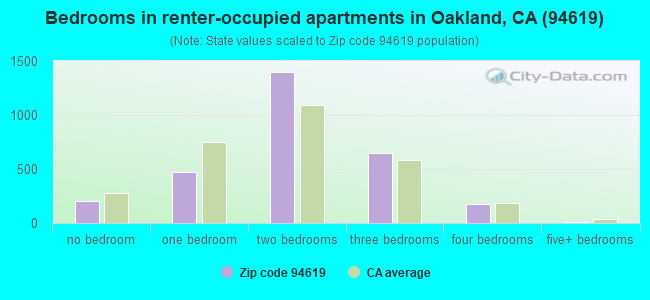
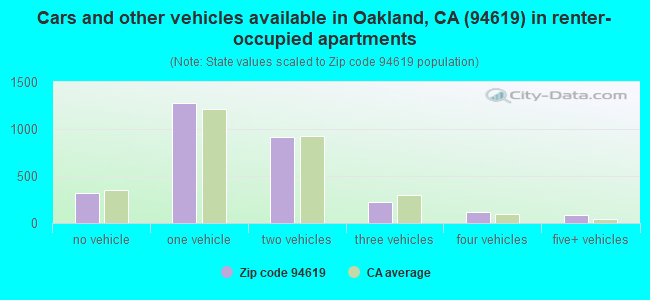
Houses and condos: 10,357 Renter-occupied apartments: 2,926
% of renters here:
30%
State:
44%
March 2022 cost of living index in zip code 94619: 118.2 (more than average, U.S. average is 100)
Land area: 15.7 sq. mi. Water area: 1.4 sq. mi.
Population density: 1,712 people per square mile
(low).
OSM Map
General Map
Google Map
MSN Map
OSM Map
General Map
Google Map
MSN Map
OSM Map
General Map
Google Map
MSN Map
OSM Map
General Map
Google Map
MSN Map
Please wait while loading the map...
Real estate property taxes paid for housing units in 2022:
This zip code:
0.9% ($8,374)
California:
0.7% ($4,831)
Median real estate property taxes paid for housing units with mortgages in 2022: $9,347 (0.9%) Median real estate property taxes paid for housing units with no mortgage in 2022: $4,967 (0.5%)
Business Search- 14 Million verified businesses
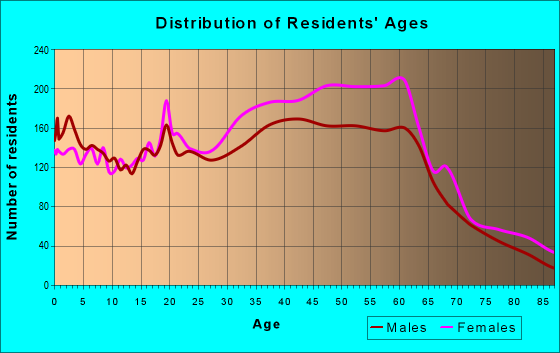
Males: 12,999
(48.5%)
Females: 13,794
(51.5%)
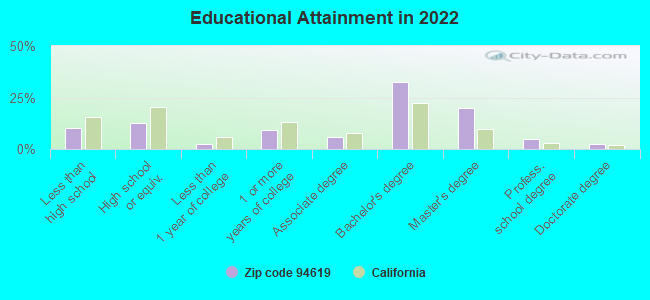
For population 25 years and over in 94619:
High school or higher: 91.1%
Bachelor's degree or higher: 60.3%
Graduate or professional degree: 27.5%
Unemployed: 4.1%
Mean travel time to work (commute): 32.0 minutes
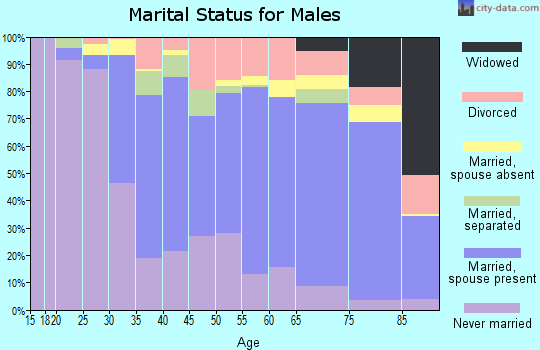
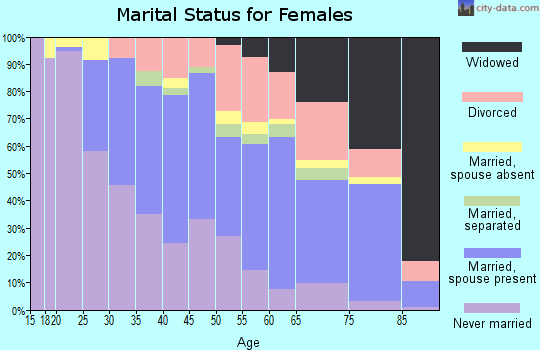
For population 15 years and over in 94619:
Never married: 34.2%
Now married: 52.4%
Separated: 1.9%
Widowed: 4.4%
Divorced: 7.2%
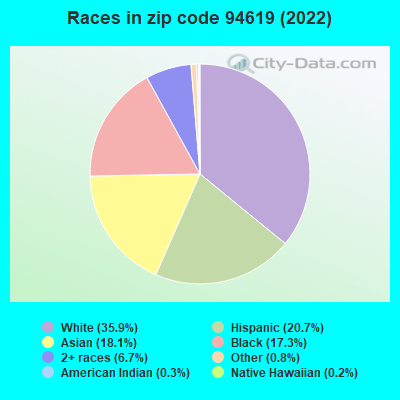
Zip code 94619 compared to state average:
Black race population percentage significantly above state average.
Hispanic race population percentage below state average.
Length of stay since moving in significantly above state average.
House age above state average.
Percentage of population with a bachelor's degree or higher above state average.
Averages for the 2020 tax year for zip code 94619, filed in 2021:
Average Adjusted Gross Income (AGI) in 2020: $113,882 (Individual Income Tax Returns)
Here:
$113,882
State:
$95,910
Salary/wage: $99,207 (reported on 78.9% of returns)
Here:
$99,207
State:
$77,331
(% of AGI for various income ranges: 1129.2% for AGIs below $25k, 3970.3% for AGIs $25k-50k, 7500.3% for AGIs $50k-75k, 10601.5% for AGIs $75k-100k, 20254.8% for AGIs $100k-200k, 105954.7% for AGIs over 200k)
Taxable interest for individuals: $1,320 (reported on 43.3% of returns)
This zip code:
$1,320
California:
$2,294
(% of AGI for various income ranges: 23.7% for AGIs below $25k, 32.2% for AGIs $25k-50k, 42.7% for AGIs $50k-75k, 77.2% for AGIs $75k-100k, 167.0% for AGIs $100k-200k, 680.7% for AGIs over 200k)
Ordinary dividends: $8,565 (reported on 28.8% of returns)
Here:
$8,565
State:
$10,949
(% of AGI for various income ranges: 41.4% for AGIs below $25k, 64.4% for AGIs $25k-50k, 114.7% for AGIs $50k-75k, 215.5% for AGIs $75k-100k, 462.5% for AGIs $100k-200k, 4532.2% for AGIs over 200k)
Net capital gain/loss in AGI: +$32,004 (reported on 26.9% of returns)
Here:
+$32,004
State:
+$49,306
(% of AGI for various income ranges: 25.8% for AGIs below $25k, 69.2% for AGIs $25k-50k, 103.1% for AGIs $50k-75k, 223.2% for AGIs $75k-100k, 662.4% for AGIs $100k-200k, 21235.6% for AGIs over 200k)
Profit/loss from business: +$19,692 (reported on 22.0% of returns)
Here:
+$19,692
State:
+$15,671
(% of AGI for various income ranges: 214.6% for AGIs below $25k, 314.2% for AGIs $25k-50k, 358.7% for AGIs $50k-75k, 514.5% for AGIs $75k-100k, 1106.3% for AGIs $100k-200k, 5268.9% for AGIs over 200k)
Taxable individual retirement arrangement distribution: $22,634 (reported on 8.4% of returns)
94619:
$22,634
California:
$23,505
(% of AGI for various income ranges: 45.6% for AGIs below $25k, 100.0% for AGIs $25k-50k, 168.5% for AGIs $50k-75k, 348.6% for AGIs $75k-100k, 598.8% for AGIs $100k-200k, 2090.2% for AGIs over 200k)
Self-employed (Keogh) retirement plans: $25,214 (reported on 1.7% of returns)
94619:
$25,214
California:
$30,163
(% of AGI for various income ranges: 40.8% for AGIs $50k-75k, 98.5% for AGIs $100k-200k, 785.1% for AGIs over 200k)
Total itemized deductions: $37,229 (reported on 23.9% of returns)
Here:
$37,229
State:
$39,517
(% of AGI for various income ranges: 156.1% for AGIs below $25k, 350.2% for AGIs $25k-50k, 658.0% for AGIs $50k-75k, 1257.5% for AGIs $75k-100k, 2492.0% for AGIs $100k-200k, 12186.4% for AGIs over 200k)
Charity contributions: $7,544 (reported on 19.5% of returns)
Here:
$7,544
State:
$12,598
(% of AGI for various income ranges: 10.3% for AGIs below $25k, 38.3% for AGIs $25k-50k, 75.0% for AGIs $50k-75k, 137.9% for AGIs $75k-100k, 347.1% for AGIs $100k-200k, 2518.9% for AGIs over 200k)
Taxes paid: $9,181 (reported on 23.7% of returns)
94619:
$9,181
State:
$8,807
(% of AGI for various income ranges: 41.4% for AGIs below $25k, 88.3% for AGIs $25k-50k, 182.8% for AGIs $50k-75k, 430.0% for AGIs $75k-100k, 798.4% for AGIs $100k-200k, 2172.4% for AGIs over 200k)
Earned income credit: $1,869 (reported on 10.2% of returns)
Here:
$1,869
State:
$2,074
(% of AGI for various income ranges: 88.9% for AGIs below $25k, 57.1% for AGIs $25k-50k)
Percentage of individuals using paid preparers for their 2020 taxes: 90.5%
Here:
90%
State:
92%
(% for various income ranges: 87.7% for AGIs below $25k, 89.5% for AGIs $25k-50k, 90.1% for AGIs $50k-75k, 90.9% for AGIs $75k-100k, 92.2% for AGIs $100k-200k, 94.0% for AGIs over 200k)
Averages for the 2012 tax year for zip code 94619, filed in 2013:
Average Adjusted Gross Income (AGI) in 2012: $75,556 (Individual Income Tax Returns)
Here:
$75,556
State:
$72,726
Salary/wage: $65,696 (reported on 80.0% of returns)
Here:
$65,696
State:
$59,079
(% of AGI for various income ranges: 69.9% for AGIs below $25k, 77.7% for AGIs $25k-50k, 74.3% for AGIs $50k-75k, 72.5% for AGIs $75k-100k, 75.2% for AGIs $100k-200k, 59.2% for AGIs over 200k)
Taxable interest for individuals: $1,591 (reported on 41.6% of returns)
This zip code:
$1,591
California:
$2,146
(% of AGI for various income ranges: 0.9% for AGIs below $25k, 0.6% for AGIs $25k-50k, 0.7% for AGIs $50k-75k, 0.9% for AGIs $75k-100k, 0.6% for AGIs $100k-200k, 1.2% for AGIs over 200k)
Ordinary dividends: $8,106 (reported on 24.2% of returns)
Here:
$8,106
State:
$9,308
(% of AGI for various income ranges: 1.6% for AGIs below $25k, 1.2% for AGIs $25k-50k, 1.2% for AGIs $50k-75k, 1.5% for AGIs $75k-100k, 1.8% for AGIs $100k-200k, 4.8% for AGIs over 200k)
Net capital gain/loss in AGI: +$11,878 (reported on 20.1% of returns)
Here:
+$11,878
State:
+$30,460
(% of AGI for various income ranges: 0.3% for AGIs $50k-75k, 0.7% for AGIs $75k-100k, 1.0% for AGIs $100k-200k, 8.6% for AGIs over 200k)
Profit/loss from business: +$19,167 (reported on 21.8% of returns)
Here:
+$19,167
State:
+$17,064
(% of AGI for various income ranges: 14.3% for AGIs below $25k, 6.7% for AGIs $25k-50k, 4.5% for AGIs $50k-75k, 5.8% for AGIs $75k-100k, 5.3% for AGIs $100k-200k, 4.2% for AGIs over 200k)
Taxable individual retirement arrangement distribution: $17,353 (reported on 8.7% of returns)
94619:
$17,353
California:
$19,557
(% of AGI for various income ranges: 2.2% for AGIs below $25k, 1.7% for AGIs $25k-50k, 1.8% for AGIs $50k-75k, 2.5% for AGIs $75k-100k, 2.2% for AGIs $100k-200k, 1.8% for AGIs over 200k)
Self-employment retirement plans: $17,532 (reported on 1.8% of returns)
94619:
$17,532
California:
$24,530
(% of AGI for various income ranges: 0.3% for AGIs $25k-50k, 0.4% for AGIs $75k-100k, 0.4% for AGIs $100k-200k, 0.7% for AGIs over 200k)
Total itemized deductions: $31,075 (24% of AGI, reported on 43.6% of returns)
Here:
$31,075
State:
$34,004
Here:
23.5% of AGI
State:
22.7% of AGI
(% of AGI for various income ranges: 14.1% for AGIs below $25k, 12.8% for AGIs $25k-50k, 17.4% for AGIs $50k-75k, 19.7% for AGIs $75k-100k, 20.7% for AGIs $100k-200k, 17.6% for AGIs over 200k)
Charity contributions: $3,609 (reported on 35.6% of returns)
Here:
$3,609
State:
$4,659
(% of AGI for various income ranges: 0.7% for AGIs below $25k, 1.1% for AGIs $25k-50k, 1.7% for AGIs $50k-75k, 1.8% for AGIs $75k-100k, 1.7% for AGIs $100k-200k, 2.0% for AGIs over 200k)
Taxes paid: $13,646 (reported on 43.5% of returns)
94619:
$13,646
State:
$14,448
(% of AGI for various income ranges: 3.6% for AGIs below $25k, 3.5% for AGIs $25k-50k, 5.6% for AGIs $50k-75k, 7.5% for AGIs $75k-100k, 9.0% for AGIs $100k-200k, 10.0% for AGIs over 200k)
Earned income credit: $2,063 (reported on 14.9% of returns)
Here:
$2,063
State:
$2,286
(% of AGI for various income ranges: 5.9% for AGIs below $25k, 0.8% for AGIs $25k-50k)
Percentage of individuals using paid preparers for their 2012 taxes: 54.9%
Here:
55%
State:
64%
(% for various income ranges: 49.6% for AGIs below $25k, 53.5% for AGIs $25k-50k, 55.6% for AGIs $50k-75k, 60.7% for AGIs $75k-100k, 59.0% for AGIs $100k-200k, 67.6% for AGIs over 200k)
Averages for the 2004 tax year for zip code 94619, filed in 2005:
Average Adjusted Gross Income (AGI) in 2004: $61,263 (Individual Income Tax Returns)
Here:
$61,263
State:
$58,600
Salary/wage: $52,930 (reported on 81.4% of returns)
Here:
$52,930
State:
$49,455
(% of AGI for various income ranges: 167.8% for AGIs below $10k, 70.0% for AGIs $10k-25k, 81.2% for AGIs $25k-50k, 79.6% for AGIs $50k-75k, 79.0% for AGIs $75k-100k, 60.8% for AGIs over 100k)
Taxable interest for individuals: $2,033 (reported on 51.9% of returns)
This zip code:
$2,033
California:
$2,365
(% of AGI for various income ranges: 10.9% for AGIs below $10k, 2.6% for AGIs $10k-25k, 1.3% for AGIs $25k-50k, 1.4% for AGIs $50k-75k, 1.5% for AGIs $75k-100k, 1.8% for AGIs over 100k)
Taxable dividends: $4,298 (reported on 28.0% of returns)
Here:
$4,298
State:
$4,746
(% of AGI for various income ranges: 7.5% for AGIs below $10k, 1.6% for AGIs $10k-25k, 0.9% for AGIs $25k-50k, 1.1% for AGIs $50k-75k, 1.5% for AGIs $75k-100k, 2.6% for AGIs over 100k)
Net capital gain/loss: +$17,472 (reported on 23.7% of returns)
Here:
+$17,472
State:
+$23,418
(% of AGI for various income ranges: -0.3% for AGIs below $10k, 0.1% for AGIs $10k-25k, 0.1% for AGIs $25k-50k, 0.6% for AGIs $50k-75k, 2.1% for AGIs $75k-100k, 12.7% for AGIs over 100k)
Profit/loss from business: +$17,811 (reported on 19.5% of returns)
Here:
+$17,811
State:
+$16,826
(% of AGI for various income ranges: 14.3% for AGIs below $10k, 10.4% for AGIs $10k-25k, 6.1% for AGIs $25k-50k, 5.3% for AGIs $50k-75k, 4.6% for AGIs $75k-100k, 5.3% for AGIs over 100k)
IRA payment deduction: $3,130 (reported on 3.3% of returns)
94619:
$3,130
California:
$3,192
(% of AGI for various income ranges: 0.8% for AGIs below $10k, 0.3% for AGIs $10k-25k, 0.4% for AGIs $25k-50k, 0.2% for AGIs $50k-75k, 0.2% for AGIs $75k-100k, 0.1% for AGIs over 100k)
Self-employed pension: $15,258 (reported on 2.4% of returns)
Here:
$15,258
California:
$17,688
(% of AGI for various income ranges: 0.2% for AGIs $10k-25k, 0.3% for AGIs $25k-50k, 0.5% for AGIs $50k-75k, 0.5% for AGIs $75k-100k, 0.8% for AGIs over 100k)
Total itemized deductions: $27,261 (26% of AGI, reported on 45.4% of returns)
Here:
$27,261
State:
$28,113
Here:
26.4% of AGI
State:
25.3% of AGI
(% of AGI for various income ranges: 38.6% for AGIs below $10k, 16.2% for AGIs $10k-25k, 16.7% for AGIs $25k-50k, 22.3% for AGIs $50k-75k, 24.3% for AGIs $75k-100k, 19.8% for AGIs over 100k)
Charity contributions deductions: $3,711 (3% of AGI, reported on 39.8% of returns)
Here:
$3,711
State:
$3,923
Here:
3.4% of AGI
State:
3.3% of AGI
(% of AGI for various income ranges: 1.9% for AGIs below $10k, 1.3% for AGIs $10k-25k, 1.8% for AGIs $25k-50k, 2.1% for AGIs $50k-75k, 2.2% for AGIs $75k-100k, 2.9% for AGIs over 100k)
Total tax: $10,394 (reported on 80.3% of returns)
94619:
$10,394
State:
$10,761
(% of AGI for various income ranges: 9.1% for AGIs below $10k, 4.9% for AGIs $10k-25k, 7.7% for AGIs $25k-50k, 10.3% for AGIs $50k-75k, 11.3% for AGIs $75k-100k, 18.1% for AGIs over 100k)
Earned income credit: $1,621 (reported on 13.0% of returns)
Here:
$1,621
State:
$1,763
Percentage of individuals using paid preparers for their 2004 taxes: 60.6%
Here:
61%
State:
66%
(% for various income ranges: 54.1% for AGIs below $10k, 62.2% for AGIs $10k-25k, 59.0% for AGIs $25k-50k, 61.4% for AGIs $50k-75k, 60.9% for AGIs $75k-100k, 66.8% for AGIs over 100k)
Likely homosexual households (counted as self-reported same-sex unmarried-partner households)
Lesbian couples: 0.4% of all households
Gay men: 0.3% of all households
Household received Food Stamps/SNAP in the past 12 months: 822 Household did not receive Food Stamps/SNAP in the past 12 months: 8,877
Women who had a birth in the past 12 months: 516 (436 now married, 78 unmarried) Women who did not have a birth in the past 12 months: 6,018 (2,642 now married, 3,364 unmarried)
Housing units in zip code 94619 with a mortgage: 4,988 (566 second mortgage, 494 both second mortgage and home equity loan) Houses without a mortgage: 132
Median monthly owner costs for units with a mortgage: $3,344 Median monthly owner costs for units without a mortgage: $963
Residents with income below the poverty level in 2022:
This zip code:
5.1%
Whole state:
12.2%
Residents with income below 50% of the poverty level in 2022:
This zip code:
2.1%
Whole state:
6.2%
Median number of rooms in houses and condos:
Here:
5.8
State:
6.0
Median number of rooms in apartments:
Here:
4.1
State:
3.9
Notable locations in this zip code not listed on our city pages
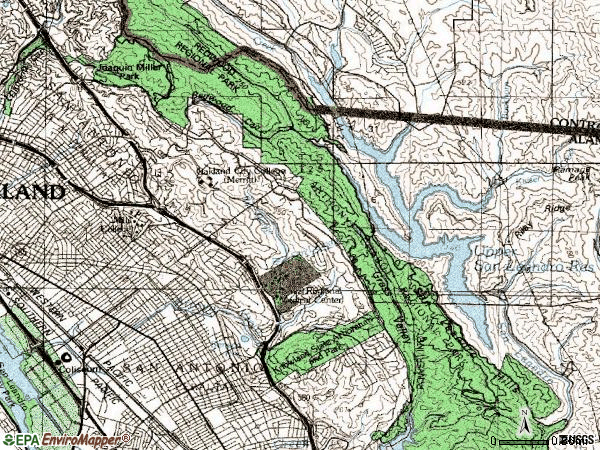
Notable locations in zip code 94619: Chabot Observatory (A), East Bay Regional Park District Ambulance Station 2 (B), Oakland Fire Department Station 21 (C), Oakland Fire Department Station 17 (D). Display/hide their locations on the map
Churches in zip code 94619 include: Laurel Methodist Church (A), Ninth Church of Christ Scientist (B), Pilgrim Lutheran Church (C), Saint Andrews Episcopal Church (D), Victory Temple Full Gospel Church (E), Saint Lawrence O'Toole Roman Catholic Church (F), Allendale Community Pentecostal Holiness Church (G), The Church of Jesus Christ of Latter Day Saints (H), Faith American Lutheran Church (I). Display/hide their locations on the map
Parks in zip code 94619 include: Redwood Regional Park (1), Brookdale Park (2), Chabot Regional Park (3), Maxwell Park (4), Pinto Ranch Recreation Area (5), Allendale Recreation Center (6), McCrea Memorial Park (7), Redwood Heights Recreation Center (8), Leona Heights Park (9). Display/hide their locations on the map
4,087 married couples with children.
1,067 single-parent households (266 men, 801 women).
68.0% of residents of 94619 zip code speak English at home.
12.5% of residents speak Spanish at home (70% very well, 15% well, 7% not well, 8% not at all).
4.0% of residents speak other Indo-European language at home (76% very well, 20% well, 4% not at all).
12.4% of residents speak Asian or Pacific Island language at home (49% very well, 24% well, 17% not well, 9% not at all).
2.8% of residents speak other language at home (15% very well, 10% well, 35% not well, 40% not at all).
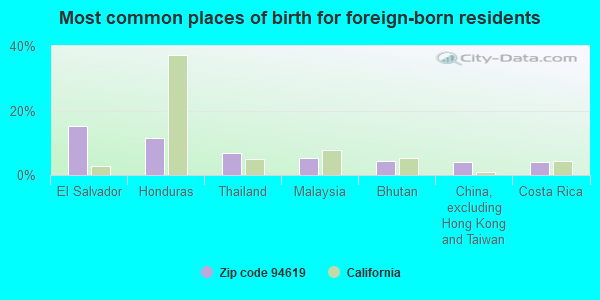
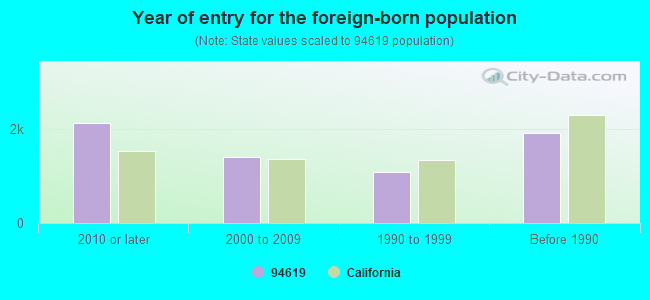
Foreign born population: 5,586 (20.9%) (55.1% of them are naturalized citizens)
Facilities with environmental interests located in this zip code:
MARSHALL TRUCKING (3001 HIGH ST STE B in OAKLAND, CA)
STATE MASTER (California - Hazardous Waste Tracking) - HAZARDOU WASTE PROGRAM TRANSPORTER (Resource Conservation and Recovery Act (tracking hazardous waste)) - notification Organizations: JEWEL MARSHALL (CONTACT/OWNER)
CHEVRON STATION NO 98341 (3530 MACARTHUR BLVD in OAKLAND, CA)
STATE MASTER (California - Hazardous Waste Tracking) - HAZARDOU WASTE PROGRAM Small Quantity Generators, between 100 kg and 1000 kg of hazardous waste/month (Resource Conservation and Recovery Act (tracking hazardous waste)) - notification Organizations: CHEVRON PRODUCTS CO (CONTACT/OWNER)
ALLENDALE ELEMENTARY (3670 PENNIMAN AVE. in OAKLAND, CA)
(National Center for Education Statistics) - STATE ID-6001630 Organizations: OAKLAND UNIFIED (SCHOOL DISTRICT)
AMERICAN INDIAN PUBLIC CHARTER (3637 MCGEE AVE. in OAKLAND, CA)
(National Center for Education Statistics) - STATE ID-6113807 Organizations: OAKLAND UNIFIED (SCHOOL DISTRICT)
LAUREL ELEMENTARY (3750 BROWN AVE. in OAKLAND, CA)
(National Center for Education Statistics) - STATE ID-6001994 Organizations: OAKLAND UNIFIED (SCHOOL DISTRICT)
MAXWELL PARK ELEMENTARY (4730 FLEMING AVE. in OAKLAND, CA)
(National Center for Education Statistics) - STATE ID-6002067 Organizations: OAKLAND UNIFIED (SCHOOL DISTRICT)
MUNCK (CARL B.) ELEMENTARY (11900 CAMPUS DR. in OAKLAND, CA)
(National Center for Education Statistics) - STATE ID-6001697 Organizations: OAKLAND UNIFIED (SCHOOL DISTRICT)
L&N AUTO REPAIR (3450 35TH AVE in OAKLAND, CA)
Small Quantity Generators, between 100 kg and 1000 kg of hazardous waste/month (Resource Conservation and Recovery Act (tracking hazardous waste)) Small Quantity Generators, between 100 kg and 1000 kg of hazardous waste/month (Resource Conservation and Recovery Act (tracking hazardous waste)) Alternative names: TEXACO SERVICE STATION
GOLDEN GATE ACADEMY (3800 MOUNTAIN BLVD in OAKLAND, CA)
Small Quantity Generators, between 100 kg and 1000 kg of hazardous waste/month (Resource Conservation and Recovery Act (tracking hazardous waste)) - notification Organizations: SEVENTH DAY ADVENTIST (CONTACT/OWNER)
GOLDEN EMPIRE PROPERTIES C/O C (3055 35TH STREET in OAKLAND, CA)
CRITERIA AND HAZARDOUS AIR POLLUTANT INVENTORY (Inventory of air pollution sources) Business SIC classification: REFUSE SYSTEMS
LEONA HEIGHTS SULPHUR MINE (END OF MCDONNELL AVE NEAR in OAKLAND, CA)
SUPERFUND (Superfund database)
LIN CUBING CO/JIM LIN (6241 RIDGEMONT DR in OAKLAND, CA)
COMPLIANCE ACTIVITY (Tracking inspections of insecticide, fungicide, and rodenticide, and toxic substances)
MARQUARDT PROPERTY MANAGEMENT (4164 MACARTHUR BLVD in OAKLAND, CA)
COMPLIANCE ACTIVITY (Tracking inspections of insecticide, fungicide, and rodenticide, and toxic substances)
Housing units lacking complete plumbing facilities: 0.3% Housing units lacking complete kitchen facilities: 0.7%
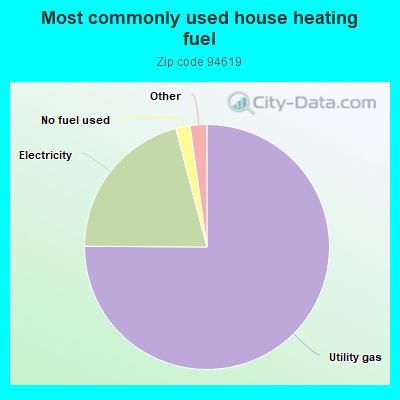
75.1%Utility gas
20.8%Electricity
1.9%No fuel used
0.9%Bottled, tank, or LP gas
0.7%Wood
0.6%Solar energy
Population in 1990: 24,501.
Place of birth for U.S.-born residents:
This state: 14,806
Northeast: 2,014
Midwest: 1,223
South: 1,449
West: 873
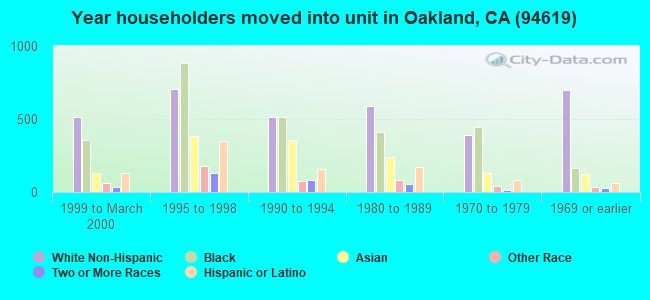
63% of the 94619 zip code residents lived in the same house 5 years ago. Out of people who lived in different houses, 66% lived in this county. Out of people who lived in different counties, 50% lived in California.
90% of the 94619 zip code residents lived in the same house 1 year ago. Out of people who lived in different houses, 59% moved from this county. Out of people who lived in different houses, 31% moved from different county within same state. Out of people who lived in different houses, 4% moved from different state. Out of people who lived in different houses, 5% moved from abroad.
Private vs. public school enrollment:
Students in private schools in grades 1 to 8 (elementary and middle school): 679
Here:
27.9%
California:
10.5%
Students in private schools in grades 9 to 12 (high school): 241
Here:
24.8%
California:
8.5%
Students in private undergraduate colleges: 236
Here:
19.8%
California:
15.9%
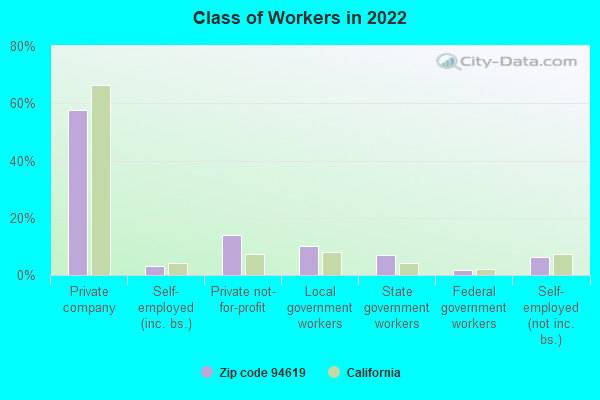
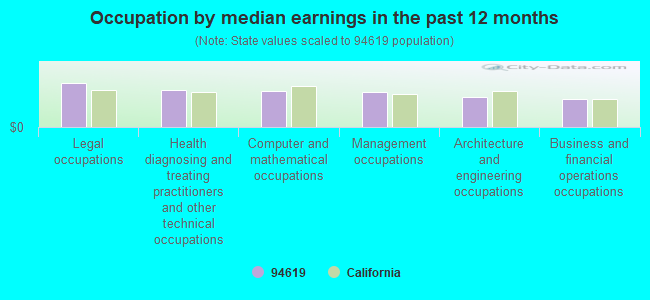
Occupation by median earnings in the past 12 months ($)
158,394Legal occupations
132,456Health diagnosing and treating practitioners and other technical occupations
130,100Computer and mathematical occupations
126,190Management occupations
107,371Architecture and engineering occupations
99,606Business and financial operations occupations
Companies with federal contracts located in this zip code (OAKLAND, CA):
TAMMYS BIBLE AND BOOKSTORE (3725 MAC ARTHUR BLVD; small business) : $224,629 in 34 contractsfrom 2003 to 2006
Contracts for Books and Pamphlets, Miscellaneous Printed Matter, Miscellaneous Items by Army, Air Force, Department of Defense, Bureau of Prisoners/Federal Prison System, and others Signed by year:2000: $0; 2001: $0; 2002: $0; 2003: $47,707; 2004: $19,550; 2005: $157,465; 2006: -$93.
Biggest contracts:
$32,484 with Army for Books and Pamphlets. Signed on 2005-07-12. Completion date: 2005-08-01.
$30,900 with Air Force for Books and Pamphlets. Taking place in NV. Signed on 2005-09-28. Completion date: 2005-10-28.
$22,089 with Army for Books and Pamphlets. Signed on 2003-06-13. Completion date: 2003-06-20.
$15,155 with Army for Books and Pamphlets. Taking place in KS. Signed on 2005-08-03. Completion date: 2005-08-15.
PERITEK CORPORATION (5550 REDWOOD RD; small business) : $188,768 in 4 contractsfrom 2001 to 2002
$89,292 with Navy for Electrical and Electronic assemblies, Boards, Cards, and Associated Hardware. Signed on 2001-04-09. Completion date: 2001-05-31.
$81,266 with Navy for ADP Input/Output and Storage Devices. Signed on 2002-09-24. Completion date: 2002-10-25.
$9,210 with Navy for Miscellaneous Communication Equipment. Signed on 2002-09-26. Completion date: 2002-10-09.
$9,000 with Navy for ADP Software. Signed on 2002-09-27. Completion date: 2003-09-27.
RESPONSE DYNAMICS VIBRATION EN (4110 REDWOOD RD, SUITE 301; small business) : $25,550 in 2 contractsfrom 2005 to 2006
$16,715 with Navy for Communications Security Equipment and Components. Signed on 2005-10-13. Completion date: 2005-12-31.
$8,835, same as above.Signed on 2006-03-23. Completion date: 2006-06-30.
ROBERT W GRANT (4511 DAVENPORT AVE; small business) : $19,776 in 3 contractsfrom 2004 to 2005
$12,320 with Navy for Other Education and Training Services. Signed on 2005-06-13. Completion date: 2005-06-17.
$3,746, same as above.Signed on 2004-12-16. Completion date: 2004-11-29.
$3,710, same as above.Signed on 2005-02-02. Completion date: 2005-02-07.
Top industries in this zip code by the number of employees in 2005:
Educational Services: Colleges, Universities, and Professional Schools (250-499 employees: 1 establishment)
Health Care and Social Assistance: Nursing Care Facilities (100-249: 1, 20-49: 1, 5-9: 1)
Educational Services: Elementary and Secondary Schools (20-49: 3)
Other Services (except Public Administration): Religious Organizations (20-49: 1, 10-19: 1, 5-9: 5, 1-4: 1)
2005 - 2018 National Fire Incident Reporting System (NFIRS) incidents
Based on the data from the years 2005 - 2018 the average number of fire incidents per year is 36. The highest number of fire incidents - 99 took place in 2017, and the least - 0 in 2010. The data has a rising trend.
When looking into fire subcategories, the most reports belonged to: Mobile Property/Vehicle Fires (35.5%), and Outside Fires (31.5%).
Fire incident types reported to NFIRS in Zip Code 94619


 Nearest zip codes: 94605, 94613, 94556, 94516, 94575, 94603.
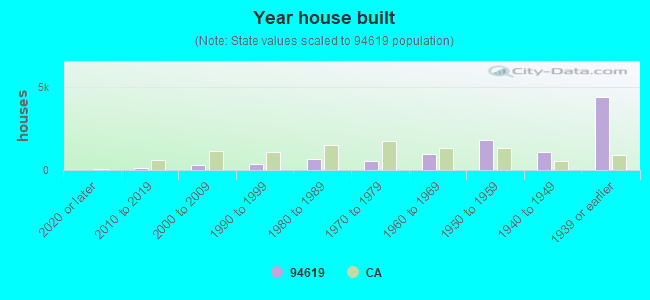


 Based on the data from the years 2005 - 2018 the average number of fire incidents per year is 36. The highest number of fire incidents - 99 took place in 2017, and the least - 0 in 2010. The data has a rising trend.
 When looking into fire subcategories, the most reports belonged to: Mobile Property/Vehicle Fires (35.5%), and Outside Fires (31.5%).