Estimated zip code population in 2022: 9,166 Zip code population in 2010: 9,137 Zip code population in 2000: 9,657
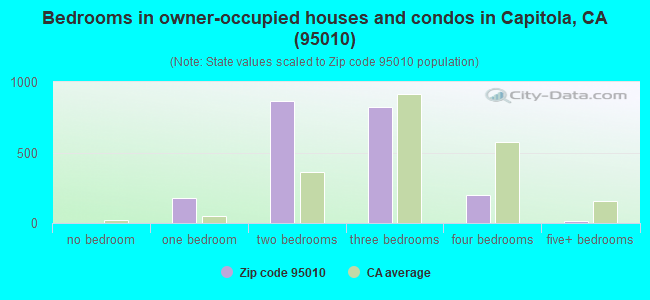
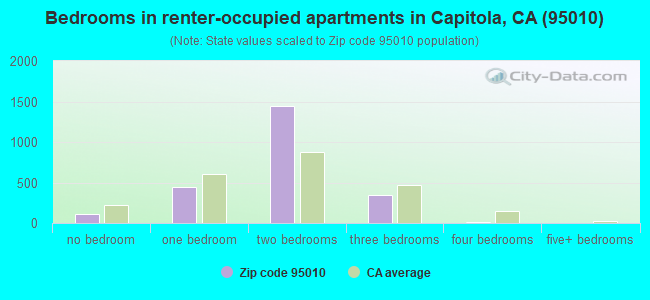
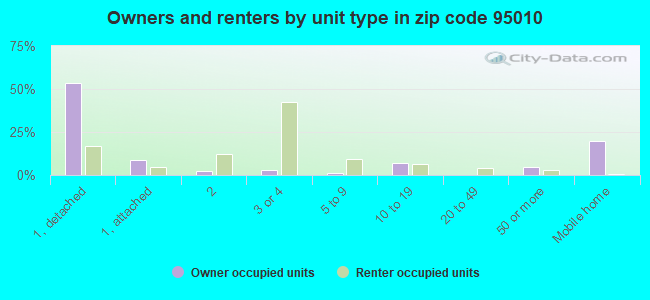
Houses and condos: 5,029 Renter-occupied apartments: 2,368
% of renters here:
53%
State:
44%
March 2022 cost of living index in zip code 95010: 130.1 (high, U.S. average is 100)
Land area: 1.4 sq. mi. Water area: 0.3 sq. mi.
Population density: 6,679 people per square mile
(high).
OSM Map
General Map
Google Map
MSN Map
OSM Map
General Map
Google Map
MSN Map
OSM Map
General Map
Google Map
MSN Map
OSM Map
General Map
Google Map
MSN Map
Please wait while loading the map...
Real estate property taxes paid for housing units in 2022:
This zip code:
0.6% ($6,139)
California:
0.7% ($4,831)
Median real estate property taxes paid for housing units with mortgages in 2022: $6,685 (0.7%) Median real estate property taxes paid for housing units with no mortgage in 2022: $5,269 (0.5%)
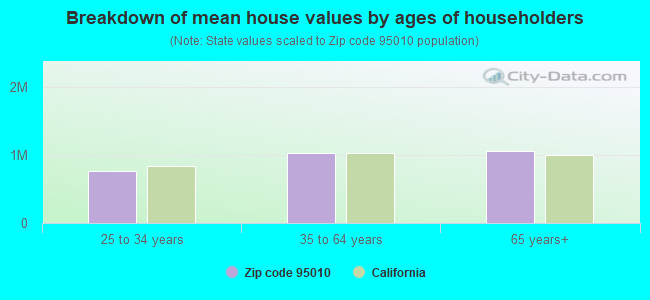
Estimated median house/condo value in 2022: $953,592
95010:
$953,592
California:
$715,900
According to our research of California and other state lists, there were 8 registered sex offenders living in 95010 zip code as of April 23, 2024. The ratio of all residents to sex offenders in zip code 95010 is 1,189 to 1. The ratio of registered sex offenders to all residents in this zip code is lower than the state average.
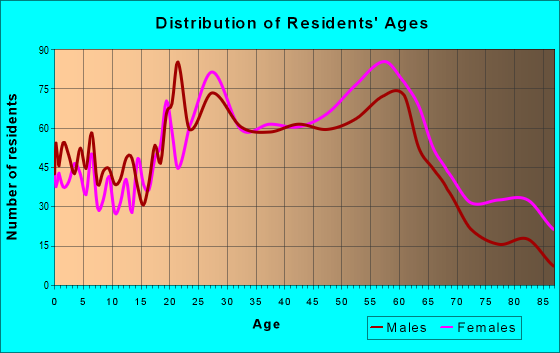
Median resident age:
This zip code:
50.5 years
California median age:
37.9 years
Average household size:
This zip code:
2.0 people
California:
2.8 people
Averages for the 2020 tax year for zip code 95010, filed in 2021:
Average Adjusted Gross Income (AGI) in 2020: $102,036 (Individual Income Tax Returns)
Here:
$102,036
State:
$95,910
Salary/wage: $88,481 (reported on 72.6% of returns)
Here:
$88,481
State:
$77,331
(% of AGI for various income ranges: 1198.1% for AGIs below $25k, 3866.8% for AGIs $25k-50k, 7196.0% for AGIs $50k-75k, 10643.0% for AGIs $75k-100k, 20482.6% for AGIs $100k-200k, 119771.5% for AGIs over 200k)
Taxable interest for individuals: $2,075 (reported on 40.4% of returns)
This zip code:
$2,075
California:
$2,294
(% of AGI for various income ranges: 32.2% for AGIs below $25k, 57.0% for AGIs $25k-50k, 62.5% for AGIs $50k-75k, 160.7% for AGIs $75k-100k, 208.3% for AGIs $100k-200k, 1716.2% for AGIs over 200k)
Ordinary dividends: $7,954 (reported on 29.4% of returns)
Here:
$7,954
State:
$10,949
(% of AGI for various income ranges: 70.8% for AGIs below $25k, 184.0% for AGIs $25k-50k, 184.8% for AGIs $50k-75k, 389.7% for AGIs $75k-100k, 575.9% for AGIs $100k-200k, 4880.8% for AGIs over 200k)
Net capital gain/loss in AGI: +$32,728 (reported on 28.5% of returns)
Here:
+$32,728
State:
+$49,306
(% of AGI for various income ranges: 27.1% for AGIs below $25k, 105.6% for AGIs $25k-50k, 151.0% for AGIs $50k-75k, 324.3% for AGIs $75k-100k, 858.5% for AGIs $100k-200k, 34013.8% for AGIs over 200k)
Profit/loss from business: +$19,653 (reported on 20.6% of returns)
Here:
+$19,653
State:
+$15,671
(% of AGI for various income ranges: 231.6% for AGIs below $25k, 487.8% for AGIs $25k-50k, 532.9% for AGIs $50k-75k, 1098.3% for AGIs $75k-100k, 1194.8% for AGIs $100k-200k, 4536.9% for AGIs over 200k)
Taxable individual retirement arrangement distribution: $20,573 (reported on 10.8% of returns)
95010:
$20,573
California:
$23,505
(% of AGI for various income ranges: 106.6% for AGIs below $25k, 166.7% for AGIs $25k-50k, 266.5% for AGIs $50k-75k, 490.7% for AGIs $75k-100k, 802.2% for AGIs $100k-200k, 2976.2% for AGIs over 200k)
Self-employed (Keogh) retirement plans: $19,811 (reported on 1.7% of returns)
95010:
$19,811
California:
$30,163
(% of AGI for various income ranges: 48.1% for AGIs $25k-50k, 123.9% for AGIs $100k-200k, 700.0% for AGIs over 200k)
Total itemized deductions: $33,534 (reported on 17.8% of returns)
Here:
$33,534
State:
$39,517
(% of AGI for various income ranges: 161.6% for AGIs below $25k, 318.4% for AGIs $25k-50k, 575.4% for AGIs $50k-75k, 1118.7% for AGIs $75k-100k, 2095.4% for AGIs $100k-200k, 10450.0% for AGIs over 200k)
Charity contributions: $6,358 (reported on 14.3% of returns)
Here:
$6,358
State:
$12,598
(% of AGI for various income ranges: 8.5% for AGIs below $25k, 20.6% for AGIs $25k-50k, 45.2% for AGIs $50k-75k, 97.0% for AGIs $75k-100k, 189.6% for AGIs $100k-200k, 2605.4% for AGIs over 200k)
Taxes paid: $8,554 (reported on 17.8% of returns)
95010:
$8,554
State:
$8,807
(% of AGI for various income ranges: 39.9% for AGIs below $25k, 70.3% for AGIs $25k-50k, 164.2% for AGIs $50k-75k, 334.7% for AGIs $75k-100k, 633.0% for AGIs $100k-200k, 2199.2% for AGIs over 200k)
Earned income credit: $1,364 (reported on 7.2% of returns)
Here:
$1,364
State:
$2,074
(% of AGI for various income ranges: 47.3% for AGIs below $25k, 29.7% for AGIs $25k-50k)
Percentage of individuals using paid preparers for their 2020 taxes: 92.3%
Here:
92%
State:
92%
(% for various income ranges: 88.9% for AGIs below $25k, 91.9% for AGIs $25k-50k, 92.9% for AGIs $50k-75k, 93.0% for AGIs $75k-100k, 95.0% for AGIs $100k-200k, 94.6% for AGIs over 200k)
Averages for the 2012 tax year for zip code 95010, filed in 2013:
Average Adjusted Gross Income (AGI) in 2012: $69,399 (Individual Income Tax Returns)
Here:
$69,399
State:
$72,726
Salary/wage: $57,265 (reported on 76.3% of returns)
Here:
$57,265
State:
$59,079
(% of AGI for various income ranges: 65.2% for AGIs below $25k, 73.4% for AGIs $25k-50k, 68.4% for AGIs $50k-75k, 70.3% for AGIs $75k-100k, 70.7% for AGIs $100k-200k, 45.9% for AGIs over 200k)
Taxable interest for individuals: $2,060 (reported on 37.4% of returns)
This zip code:
$2,060
California:
$2,146
(% of AGI for various income ranges: 2.2% for AGIs below $25k, 0.9% for AGIs $25k-50k, 0.9% for AGIs $50k-75k, 1.0% for AGIs $75k-100k, 0.9% for AGIs $100k-200k, 1.3% for AGIs over 200k)
Ordinary dividends: $6,097 (reported on 24.3% of returns)
Here:
$6,097
State:
$9,308
(% of AGI for various income ranges: 3.4% for AGIs below $25k, 1.7% for AGIs $25k-50k, 1.7% for AGIs $50k-75k, 1.8% for AGIs $75k-100k, 1.6% for AGIs $100k-200k, 2.8% for AGIs over 200k)
Net capital gain/loss in AGI: +$15,588 (reported on 20.6% of returns)
Here:
+$15,588
State:
+$30,460
(% of AGI for various income ranges: 0.5% for AGIs $25k-50k, 1.3% for AGIs $50k-75k, 0.7% for AGIs $75k-100k, 2.0% for AGIs $100k-200k, 12.7% for AGIs over 200k)
Profit/loss from business: +$19,510 (reported on 20.8% of returns)
Here:
+$19,510
State:
+$17,064
(% of AGI for various income ranges: 13.1% for AGIs below $25k, 7.4% for AGIs $25k-50k, 5.3% for AGIs $50k-75k, 6.8% for AGIs $75k-100k, 5.8% for AGIs $100k-200k, 3.7% for AGIs over 200k)
Taxable individual retirement arrangement distribution: $15,996 (reported on 11.0% of returns)
95010:
$15,996
California:
$19,557
(% of AGI for various income ranges: 3.5% for AGIs below $25k, 2.6% for AGIs $25k-50k, 3.8% for AGIs $50k-75k, 2.8% for AGIs $75k-100k, 2.8% for AGIs $100k-200k, 1.4% for AGIs over 200k)
Self-employment retirement plans: $17,800 (reported on 1.5% of returns)
95010:
$17,800
California:
$24,530
(% of AGI for various income ranges: 0.7% for AGIs $50k-75k, 0.4% for AGIs $100k-200k, 0.6% for AGIs over 200k)
Total itemized deductions: $30,621 (24% of AGI, reported on 37.6% of returns)
Here:
$30,621
State:
$34,004
Here:
24.4% of AGI
State:
22.7% of AGI
(% of AGI for various income ranges: 18.9% for AGIs below $25k, 11.9% for AGIs $25k-50k, 13.8% for AGIs $50k-75k, 16.6% for AGIs $75k-100k, 18.1% for AGIs $100k-200k, 18.2% for AGIs over 200k)
Charity contributions: $2,547 (reported on 30.8% of returns)
Here:
$2,547
State:
$4,659
(% of AGI for various income ranges: 0.9% for AGIs below $25k, 0.7% for AGIs $25k-50k, 1.1% for AGIs $50k-75k, 1.3% for AGIs $75k-100k, 1.4% for AGIs $100k-200k, 1.1% for AGIs over 200k)
Taxes paid: $11,591 (reported on 37.4% of returns)
95010:
$11,591
State:
$14,448
(% of AGI for various income ranges: 3.5% for AGIs below $25k, 3.2% for AGIs $25k-50k, 4.1% for AGIs $50k-75k, 5.6% for AGIs $75k-100k, 7.4% for AGIs $100k-200k, 8.4% for AGIs over 200k)
Earned income credit: $1,444 (reported on 11.0% of returns)
Here:
$1,444
State:
$2,286
(% of AGI for various income ranges: 2.9% for AGIs below $25k, 0.5% for AGIs $25k-50k)
Percentage of individuals using paid preparers for their 2012 taxes: 57.0%
Here:
57%
State:
64%
(% for various income ranges: 50.3% for AGIs below $25k, 52.4% for AGIs $25k-50k, 60.2% for AGIs $50k-75k, 62.0% for AGIs $75k-100k, 66.2% for AGIs $100k-200k, 82.6% for AGIs over 200k)
Averages for the 2004 tax year for zip code 95010, filed in 2005:
Average Adjusted Gross Income (AGI) in 2004: $52,865 (Individual Income Tax Returns)
Here:
$52,865
State:
$58,600
Salary/wage: $46,282 (reported on 77.3% of returns)
Here:
$46,282
State:
$49,455
(% of AGI for various income ranges: 263.0% for AGIs below $10k, 66.7% for AGIs $10k-25k, 76.8% for AGIs $25k-50k, 79.4% for AGIs $50k-75k, 77.1% for AGIs $75k-100k, 54.5% for AGIs over 100k)
Taxable interest for individuals: $2,755 (reported on 48.9% of returns)
This zip code:
$2,755
California:
$2,365
(% of AGI for various income ranges: 22.6% for AGIs below $10k, 3.7% for AGIs $10k-25k, 1.9% for AGIs $25k-50k, 1.6% for AGIs $50k-75k, 1.3% for AGIs $75k-100k, 3.2% for AGIs over 100k)
Taxable dividends: $3,795 (reported on 27.8% of returns)
Here:
$3,795
State:
$4,746
(% of AGI for various income ranges: 19.2% for AGIs below $10k, 2.6% for AGIs $10k-25k, 1.5% for AGIs $25k-50k, 0.9% for AGIs $50k-75k, 1.3% for AGIs $75k-100k, 2.6% for AGIs over 100k)
Net capital gain/loss: +$17,547 (reported on 24.5% of returns)
Here:
+$17,547
State:
+$23,418
(% of AGI for various income ranges: -4.3% for AGIs below $10k, 0.2% for AGIs $10k-25k, 0.6% for AGIs $25k-50k, 1.2% for AGIs $50k-75k, 1.8% for AGIs $75k-100k, 17.3% for AGIs over 100k)
Profit/loss from business: +$18,071 (reported on 21.5% of returns)
Here:
+$18,071
State:
+$16,826
(% of AGI for various income ranges: 5.6% for AGIs below $10k, 11.4% for AGIs $10k-25k, 7.6% for AGIs $25k-50k, 5.4% for AGIs $50k-75k, 6.6% for AGIs $75k-100k, 7.6% for AGIs over 100k)
IRA payment deduction: $3,167 (reported on 4.0% of returns)
95010:
$3,167
California:
$3,192
(% of AGI for various income ranges: 2.1% for AGIs below $10k, 0.3% for AGIs $10k-25k, 0.4% for AGIs $25k-50k, 0.2% for AGIs $50k-75k, 0.3% for AGIs $75k-100k, 0.2% for AGIs over 100k)
Self-employed pension: $16,990 (reported on 1.9% of returns)
Here:
$16,990
California:
$17,688
(% of AGI for various income ranges: 4.0% for AGIs below $10k, 0.2% for AGIs $25k-50k, 0.3% for AGIs $50k-75k, 0.5% for AGIs $75k-100k, 1.0% for AGIs over 100k)
Total itemized deductions: $24,490 (26% of AGI, reported on 38.9% of returns)
Here:
$24,490
State:
$28,113
Here:
26.2% of AGI
State:
25.3% of AGI
(% of AGI for various income ranges: 81.5% for AGIs below $10k, 17.2% for AGIs $10k-25k, 15.6% for AGIs $25k-50k, 17.7% for AGIs $50k-75k, 20.2% for AGIs $75k-100k, 18.2% for AGIs over 100k)
Charity contributions deductions: $2,569 (3% of AGI, reported on 34.0% of returns)
Here:
$2,569
State:
$3,923
Here:
2.6% of AGI
State:
3.3% of AGI
(% of AGI for various income ranges: 3.8% for AGIs below $10k, 1.2% for AGIs $10k-25k, 1.2% for AGIs $25k-50k, 1.4% for AGIs $50k-75k, 1.6% for AGIs $75k-100k, 2.0% for AGIs over 100k)
Total tax: $8,837 (reported on 82.0% of returns)
95010:
$8,837
State:
$10,761
(% of AGI for various income ranges: 16.3% for AGIs below $10k, 5.7% for AGIs $10k-25k, 8.9% for AGIs $25k-50k, 10.9% for AGIs $50k-75k, 12.3% for AGIs $75k-100k, 18.5% for AGIs over 100k)
Earned income credit: $1,178 (reported on 9.0% of returns)
Here:
$1,178
State:
$1,763
Percentage of individuals using paid preparers for their 2004 taxes: 57.6%
Here:
58%
State:
66%
(% for various income ranges: 52.1% for AGIs below $10k, 54.6% for AGIs $10k-25k, 54.9% for AGIs $25k-50k, 57.0% for AGIs $50k-75k, 63.1% for AGIs $75k-100k, 76.4% for AGIs over 100k)
Household received Food Stamps/SNAP in the past 12 months: 457 Household did not receive Food Stamps/SNAP in the past 12 months: 3,977
Women who had a birth in the past 12 months: 34 (34 now married, 0 unmarried) Women who did not have a birth in the past 12 months: 1,645 (548 now married, 1,101 unmarried)
Housing units in zip code 95010 with a mortgage: 1,048 (153 second mortgage, 152 both second mortgage and home equity loan) Median monthly owner costs for units with a mortgage: $3,454 Median monthly owner costs for units without a mortgage: $906
Residents with income below the poverty level in 2022:
This zip code:
13.5%
Whole state:
12.2%
Residents with income below 50% of the poverty level in 2022:
This zip code:
8.1%
Whole state:
6.2%
Median number of rooms in houses and condos:
Here:
5.2
State:
6.0
Median number of rooms in apartments:
Here:
4.0
State:
3.9
Notable locations in this zip code not listed on our city pages
Notable locations in zip code 95010: Capitola Fishing Wharf (A), Capitola City Hall (B), Central Fire Protection District of Santa Cruz County Station 4 (C). Display/hide their locations on the map
Shopping Centers: Upper Village Shopping Center (1), La Capitola Plaza Shopping Center (2), Capitola Mall Shopping Center (3), Brown Bulb Ranch Shopping Center (4). Display/hide their locations on the map
Churches in zip code 95010 include: First Baptist Church of Capitola (A), Faith Chapel (B), Grace Community Church of Capitola (C), Saint John the Baptist Episcopal Church (D), Saint Josephs Catholic Church (E). Display/hide their locations on the map
Parks in zip code 95010 include: Jade Street Park (1), Old Riverview Historic District (2), Perry Park (3), Six Sisters-Lawn Way Historic District (4), Capitola Beach (5). Display/hide their locations on the map
709 married couples with children.
553 single-parent households (264 men, 289 women).
83.9% of residents of 95010 zip code speak English at home.
10.3% of residents speak Spanish at home (74% very well, 17% well, 8% not well, 1% not at all).
1.8% of residents speak other Indo-European language at home (85% very well, 15% well).
3.8% of residents speak Asian or Pacific Island language at home (62% very well, 31% well, 7% not well).
0.1% of residents speak other language at home (100% well).
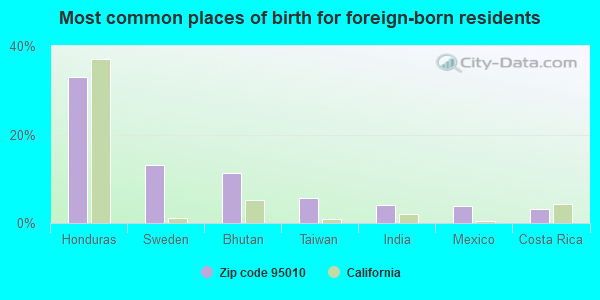
Foreign born population: 1,053 (11.5%) (49.7% of them are naturalized citizens)
This zip code:
11.5%
Whole state:
26.7%
33%Honduras
13%Sweden
11%Bhutan
6%Taiwan
4%India
4%Mexico
3%Costa Rica
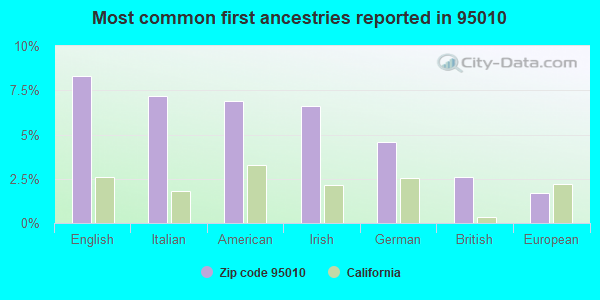
8%English
7%Italian
7%American
7%Irish
5%German
3%British
2%European
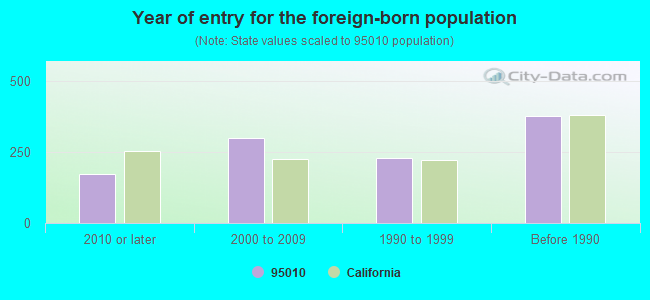
Year of entry for the foreign-born population
1732010 or later
3002000 to 2009
2301990 to 1999
376Before 1990
Facilities with environmental interests located in this zip code:
CHEVRON STATION NO 98958 (1650 41ST AVE in CAPITOLA, CA)
STATE MASTER (California - Hazardous Waste Tracking) - HAZARDOU WASTE PROGRAM CRITERIA AND HAZARDOUS AIR POLLUTANT INVENTORY (Inventory of air pollution sources) Small Quantity Generators, between 100 kg and 1000 kg of hazardous waste/month (Resource Conservation and Recovery Act (tracking hazardous waste)) - notification Business SIC classification: GASOLINE SERVICE STATIONS Organizations: CHEVRON PRODUCTS CO (CONTACT/OWNER)
Alternative names: CHEVRON PRODUCTS COMPANY, DAVES CHEVRON SERVICE
NEW BRIGHTON MIDDLE (250 WASHBURN AVE. in CAPITOLA, CA)
(National Center for Education Statistics) - STATE ID-6066542 Organizations: SOQUEL UNION ELEMENTARY (SCHOOL DISTRICT)
CAPITOLA ELEMENTARY (504 MONTEREY AVE. in CAPITOLA, CA)
(National Center for Education Statistics) - STATE ID-6049969 Organizations: SOQUEL UNION ELEMENTARY (SCHOOL DISTRICT)
KITS CAMERAS 1 HOUR NO 78 (1855 FORTY FIRST AVE STE D1A in CAPITOLA, CA)
Small Quantity Generators, between 100 kg and 1000 kg of hazardous waste/month (Resource Conservation and Recovery Act (tracking hazardous waste)) - notification (Resource Conservation and Recovery Act (tracking hazardous waste)) Organizations: RITZ CAMERA CENTERS INC (CONTACT/OWNER)
, PHIL LALJI (CONTACT/OWNER)
Alternative names: KITS CAMERAS INC NO 078
KINGS CLEANERS (3908 CAPITOLA RD in CAPITOLA, CA)
CRITERIA AND HAZARDOUS AIR POLLUTANT INVENTORY (Inventory of air pollution sources) Small Quantity Generators, between 100 kg and 1000 kg of hazardous waste/month (Resource Conservation and Recovery Act (tracking hazardous waste)) Business SIC classification: DRYCLEANING PLANTS, EXCEPT RUG CLEANING Alternative names: KINGS CLEANERS-CAPITOLA
MARINA PONTIAC BUICK (4100 AUTO PLAZA in CAPITOLA, CA)
Small Quantity Generators, between 100 kg and 1000 kg of hazardous waste/month (Resource Conservation and Recovery Act (tracking hazardous waste)) Organizations: DICK STENGL (CONTACT/OWNER)
EXPRESSLY PORTRAITS INC (1855 41ST AVE in CAPITOLA, CA)
Small Quantity Generators, between 100 kg and 1000 kg of hazardous waste/month (Resource Conservation and Recovery Act (tracking hazardous waste)) - notification
C & J COX CORPORATION (1649 41ST AVENUE in CAPITOLA, CA)
CRITERIA AND HAZARDOUS AIR POLLUTANT INVENTORY (Inventory of air pollution sources) Business SIC classification: GASOLINE SERVICE STATIONS
CAPITOLA CLEANERS (1820 41ST AVENUE UNIT H in CAPITOLA, CA)
CRITERIA AND HAZARDOUS AIR POLLUTANT INVENTORY (Inventory of air pollution sources) Business SIC classification: DRYCLEANING PLANTS, EXCEPT RUG CLEANING
Housing units lacking complete kitchen facilities: 0.4%
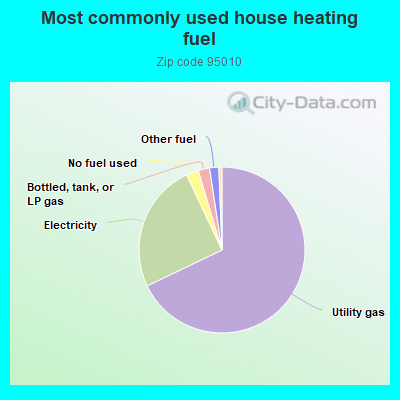
67.9%Utility gas
25.1%Electricity
2.4%No fuel used
2.2%Bottled, tank, or LP gas
1.8%Other fuel
0.6%Wood
Population in 1990: 9,337. Population change in the 1990s: +320 (+3.4%).
Place of birth for U.S.-born residents:
This state: 5,915
Northeast: 817
Midwest: 751
South: 334
West: 225
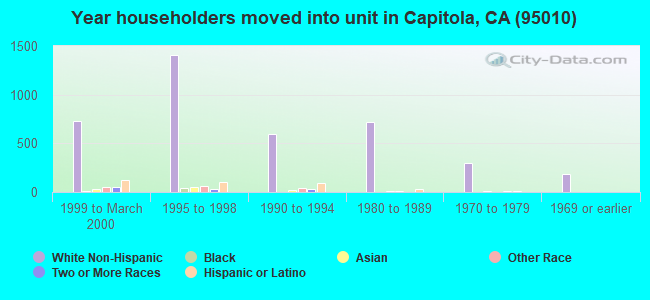
45% of the 95010 zip code residents lived in the same house 5 years ago. Out of people who lived in different houses, 56% lived in this county. Out of people who lived in different counties, 50% lived in California.
90% of the 95010 zip code residents lived in the same house 1 year ago. Out of people who lived in different houses, 66% moved from this county. Out of people who lived in different houses, 26% moved from different county within same state. Out of people who lived in different houses, 5% moved from different state. Out of people who lived in different houses, 2% moved from abroad.
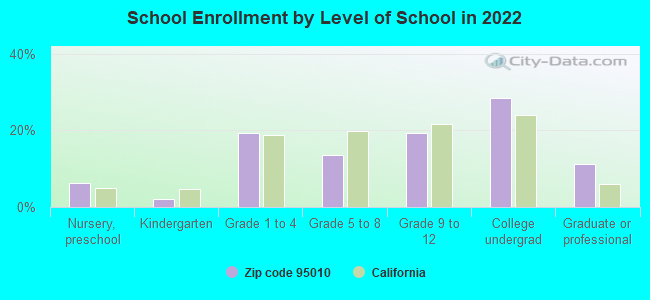
Private vs. public school enrollment:
Students in private schools in grades 1 to 8 (elementary and middle school): 176
Here:
26.8%
California:
10.5%
Students in private schools in grades 9 to 12 (high school): 45
Here:
12.1%
California:
8.5%
Students in private undergraduate colleges: 8
Here:
1.6%
California:
15.9%
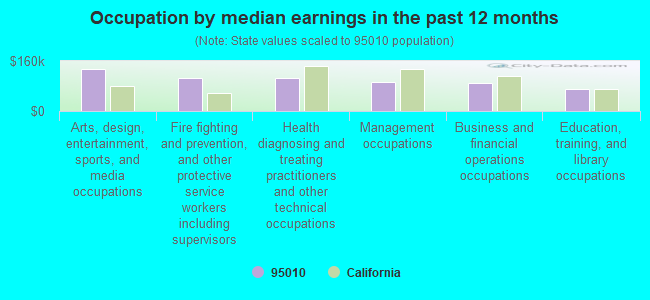
Occupation by median earnings in the past 12 months ($)
134,877Arts, design, entertainment, sports, and media occupations
104,935Fire fighting and prevention, and other protective service workers including supervisors
104,467Health diagnosing and treating practitioners and other technical occupations
93,910Management occupations
90,115Business and financial operations occupations
69,678Education, training, and library occupations
Top industries in this zip code by the number of employees in 2005:
2005 - 2018 National Fire Incident Reporting System (NFIRS) incidents
Based on the data from the years 2005 - 2018 the average number of fire incidents per year is 22. The highest number of fires - 42 took place in 2017, and the least - 0 in 2006. The data has a rising trend.
When looking into fire subcategories, the most incidents belonged to: Structure Fires (42.3%), and Outside Fires (34.2%).
Fire incident types reported to NFIRS in Zip Code 95010
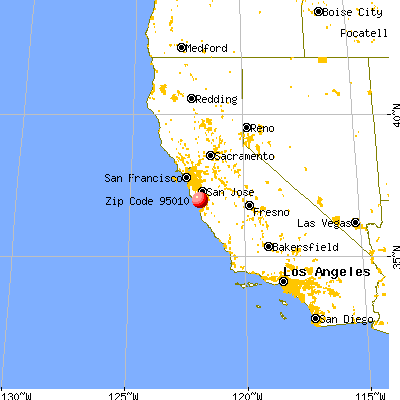


 Nearest zip codes: 95062, 95065, 95073, 95003, 95064, 95066.


 Based on the data from the years 2005 - 2018 the average number of fire incidents per year is 22. The highest number of fires - 42 took place in 2017, and the least - 0 in 2006. The data has a rising trend.
 When looking into fire subcategories, the most incidents belonged to: Structure Fires (42.3%), and Outside Fires (34.2%).