Estimated zip code population in 2022: 27,448 Zip code population in 2010: 25,089 Zip code population in 2000: 24,427
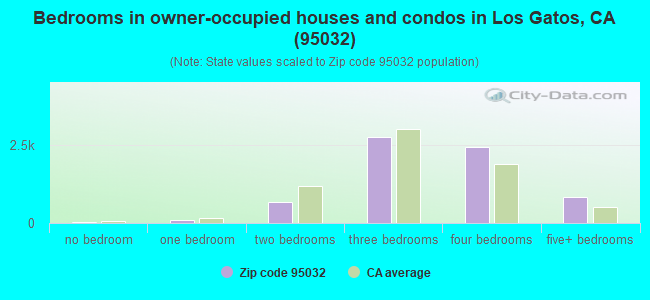
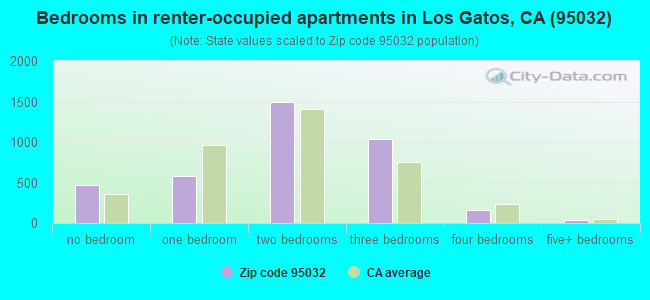
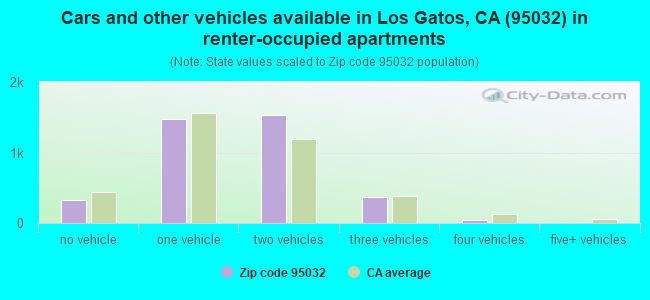
Houses and condos: 11,054 Renter-occupied apartments: 3,761
% of renters here:
35%
State:
44%
March 2022 cost of living index in zip code 95032: 127.5 (high, U.S. average is 100)
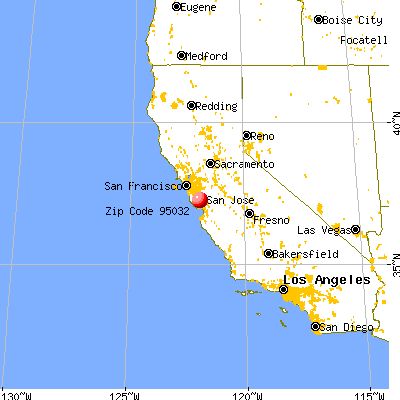
Land area: 15.9 sq. mi. Water area: 0.1 sq. mi.
Population density: 1,728 people per square mile
(low).
OSM Map
General Map
Google Map
MSN Map
OSM Map
General Map
Google Map
MSN Map
OSM Map
General Map
Google Map
MSN Map
OSM Map
General Map
Google Map
MSN Map
Please wait while loading the map...
Real estate property taxes paid for housing units in 2022:
This zip code:
0.5% ($10,292)
California:
0.7% ($4,831)
Median real estate property taxes paid for housing units with mortgages in 2022: $10,330 (0.5%) Median real estate property taxes paid for housing units with no mortgage in 2022: $6,997 (0.3%)
Estimated median house/condo value in 2022: $2,171,698
95032:
$2,171,698
California:
$715,900
According to our research of California and other state lists, there were 11 registered sex offenders living in 95032 zip code as of April 18, 2024. The ratio of all residents to sex offenders in zip code 95032 is 2,400 to 1. The ratio of registered sex offenders to all residents in this zip code is much lower than the state average.
Median resident age:
This zip code:
45.3 years
California median age:
37.9 years
Average household size:
This zip code:
2.6 people
California:
2.8 people
Averages for the 2020 tax year for zip code 95032, filed in 2021:
Average Adjusted Gross Income (AGI) in 2020: $436,739 (Individual Income Tax Returns)
Here:
$436,739
State:
$95,910
Salary/wage: $286,369 (reported on 75.9% of returns)
Here:
$286,369
State:
$77,331
(% of AGI for various income ranges: 1226.6% for AGIs below $25k, 3917.2% for AGIs $25k-50k, 6628.1% for AGIs $50k-75k, 10406.7% for AGIs $75k-100k, 20950.4% for AGIs $100k-200k, 254681.1% for AGIs over 200k)
Taxable interest for individuals: $4,473 (reported on 60.6% of returns)
This zip code:
$4,473
California:
$2,294
(% of AGI for various income ranges: 73.0% for AGIs below $25k, 95.2% for AGIs $25k-50k, 133.9% for AGIs $50k-75k, 204.1% for AGIs $75k-100k, 411.5% for AGIs $100k-200k, 2837.8% for AGIs over 200k)
Ordinary dividends: $19,084 (reported on 56.2% of returns)
Here:
$19,084
State:
$10,949
(% of AGI for various income ranges: 146.2% for AGIs below $25k, 288.0% for AGIs $25k-50k, 440.4% for AGIs $50k-75k, 839.6% for AGIs $75k-100k, 1430.6% for AGIs $100k-200k, 11718.9% for AGIs over 200k)
Net capital gain/loss in AGI: +$114,458 (reported on 54.8% of returns)
Here:
+$114,458
State:
+$49,306
(% of AGI for various income ranges: 82.3% for AGIs below $25k, 332.7% for AGIs $25k-50k, 419.4% for AGIs $50k-75k, 562.9% for AGIs $75k-100k, 1515.7% for AGIs $100k-200k, 81549.7% for AGIs over 200k)
Profit/loss from business: +$47,448 (reported on 19.3% of returns)
Here:
+$47,448
State:
+$15,671
(% of AGI for various income ranges: 238.1% for AGIs below $25k, 624.9% for AGIs $25k-50k, 595.7% for AGIs $50k-75k, 874.9% for AGIs $75k-100k, 1931.2% for AGIs $100k-200k, 8572.3% for AGIs over 200k)
Taxable individual retirement arrangement distribution: $30,934 (reported on 12.9% of returns)
95032:
$30,934
California:
$23,505
(% of AGI for various income ranges: 84.8% for AGIs below $25k, 243.3% for AGIs $25k-50k, 542.5% for AGIs $50k-75k, 906.7% for AGIs $75k-100k, 1583.1% for AGIs $100k-200k, 2523.5% for AGIs over 200k)
Self-employed (Keogh) retirement plans: $35,728 (reported on 3.6% of returns)
95032:
$35,728
California:
$30,163
(% of AGI for various income ranges: 38.9% for AGIs $25k-50k, 71.6% for AGIs $75k-100k, 218.8% for AGIs $100k-200k, 1414.2% for AGIs over 200k)
Total itemized deductions: $51,570 (reported on 35.0% of returns)
Here:
$51,570
State:
$39,517
(% of AGI for various income ranges: 341.9% for AGIs below $25k, 626.1% for AGIs $25k-50k, 1025.2% for AGIs $50k-75k, 1471.4% for AGIs $75k-100k, 2956.2% for AGIs $100k-200k, 18711.5% for AGIs over 200k)
Charity contributions: $20,037 (reported on 30.0% of returns)
Here:
$20,037
State:
$12,598
(% of AGI for various income ranges: 13.0% for AGIs below $25k, 35.7% for AGIs $25k-50k, 99.9% for AGIs $50k-75k, 140.8% for AGIs $75k-100k, 420.7% for AGIs $100k-200k, 7424.6% for AGIs over 200k)
Taxes paid: $9,398 (reported on 34.9% of returns)
95032:
$9,398
State:
$8,807
(% of AGI for various income ranges: 63.3% for AGIs below $25k, 114.3% for AGIs $25k-50k, 209.4% for AGIs $50k-75k, 340.4% for AGIs $75k-100k, 763.2% for AGIs $100k-200k, 3098.2% for AGIs over 200k)
Earned income credit: $1,426 (reported on 3.2% of returns)
Here:
$1,426
State:
$2,074
(% of AGI for various income ranges: 32.1% for AGIs below $25k, 29.3% for AGIs $25k-50k)
Percentage of individuals using paid preparers for their 2020 taxes: 91.9%
Here:
92%
State:
92%
(% for various income ranges: 88.7% for AGIs below $25k, 89.6% for AGIs $25k-50k, 92.3% for AGIs $50k-75k, 92.0% for AGIs $75k-100k, 91.4% for AGIs $100k-200k, 94.4% for AGIs over 200k)
Averages for the 2012 tax year for zip code 95032, filed in 2013:
Average Adjusted Gross Income (AGI) in 2012: $270,425 (Individual Income Tax Returns)
Here:
$270,425
State:
$72,726
Salary/wage: $172,261 (reported on 75.6% of returns)
Here:
$172,261
State:
$59,079
(% of AGI for various income ranges: 62.1% for AGIs below $25k, 63.7% for AGIs $25k-50k, 64.4% for AGIs $50k-75k, 59.7% for AGIs $75k-100k, 69.7% for AGIs $100k-200k, 43.8% for AGIs over 200k)
Taxable interest for individuals: $5,221 (reported on 59.0% of returns)
This zip code:
$5,221
California:
$2,146
(% of AGI for various income ranges: 2.5% for AGIs below $25k, 1.8% for AGIs $25k-50k, 1.6% for AGIs $50k-75k, 1.5% for AGIs $75k-100k, 1.2% for AGIs $100k-200k, 1.1% for AGIs over 200k)
Ordinary dividends: $20,025 (reported on 49.1% of returns)
Here:
$20,025
State:
$9,308
(% of AGI for various income ranges: 6.4% for AGIs below $25k, 4.2% for AGIs $25k-50k, 3.4% for AGIs $50k-75k, 4.1% for AGIs $75k-100k, 2.9% for AGIs $100k-200k, 3.7% for AGIs over 200k)
Net capital gain/loss in AGI: +$43,348 (reported on 48.2% of returns)
Here:
+$43,348
State:
+$30,460
(% of AGI for various income ranges: 0.4% for AGIs below $25k, 1.3% for AGIs $25k-50k, 0.9% for AGIs $50k-75k, 1.8% for AGIs $75k-100k, 2.2% for AGIs $100k-200k, 9.1% for AGIs over 200k)
Profit/loss from business: +$46,563 (reported on 21.1% of returns)
Here:
+$46,563
State:
+$17,064
(% of AGI for various income ranges: 14.6% for AGIs below $25k, 9.1% for AGIs $25k-50k, 7.3% for AGIs $50k-75k, 7.1% for AGIs $75k-100k, 7.0% for AGIs $100k-200k, 2.7% for AGIs over 200k)
Taxable individual retirement arrangement distribution: $26,252 (reported on 15.5% of returns)
95032:
$26,252
California:
$19,557
(% of AGI for various income ranges: 5.1% for AGIs below $25k, 4.8% for AGIs $25k-50k, 5.0% for AGIs $50k-75k, 5.2% for AGIs $75k-100k, 3.9% for AGIs $100k-200k, 0.8% for AGIs over 200k)
Self-employment retirement plans: $25,316 (reported on 4.0% of returns)
95032:
$25,316
California:
$24,530
(% of AGI for various income ranges: 0.5% for AGIs $25k-50k, 0.4% for AGIs $50k-75k, 0.4% for AGIs $75k-100k, 0.6% for AGIs $100k-200k, 0.3% for AGIs over 200k)
Total itemized deductions: $76,739 (18% of AGI, reported on 60.4% of returns)
Here:
$76,739
State:
$34,004
Here:
18.2% of AGI
State:
22.7% of AGI
(% of AGI for various income ranges: 28.4% for AGIs below $25k, 19.0% for AGIs $25k-50k, 17.9% for AGIs $50k-75k, 20.3% for AGIs $75k-100k, 21.6% for AGIs $100k-200k, 16.2% for AGIs over 200k)
Charity contributions: $8,326 (reported on 52.2% of returns)
Here:
$8,326
State:
$4,659
(% of AGI for various income ranges: 1.4% for AGIs below $25k, 1.4% for AGIs $25k-50k, 1.6% for AGIs $50k-75k, 2.0% for AGIs $75k-100k, 1.8% for AGIs $100k-200k, 1.6% for AGIs over 200k)
Taxes paid: $41,400 (reported on 60.3% of returns)
95032:
$41,400
State:
$14,448
(% of AGI for various income ranges: 6.9% for AGIs below $25k, 4.7% for AGIs $25k-50k, 5.3% for AGIs $50k-75k, 7.1% for AGIs $75k-100k, 9.4% for AGIs $100k-200k, 9.5% for AGIs over 200k)
Earned income credit: $1,397 (reported on 4.9% of returns)
Here:
$1,397
State:
$2,286
(% of AGI for various income ranges: 2.2% for AGIs below $25k, 0.4% for AGIs $25k-50k)
Percentage of individuals using paid preparers for their 2012 taxes: 59.1%
Here:
59%
State:
64%
(% for various income ranges: 50.0% for AGIs below $25k, 53.4% for AGIs $25k-50k, 57.2% for AGIs $50k-75k, 59.5% for AGIs $75k-100k, 61.2% for AGIs $100k-200k, 69.0% for AGIs over 200k)
Averages for the 2004 tax year for zip code 95032, filed in 2005:
Average Adjusted Gross Income (AGI) in 2004: $132,274 (Individual Income Tax Returns)
Here:
$132,274
State:
$58,600
Salary/wage: $112,093 (reported on 75.3% of returns)
Here:
$112,093
State:
$49,455
(% of AGI for various income ranges: 60.0% for AGIs $10k-25k, 65.8% for AGIs $25k-50k, 65.8% for AGIs $50k-75k, 64.8% for AGIs $75k-100k, 62.2% for AGIs over 100k)
Taxable interest for individuals: $4,180 (reported on 66.8% of returns)
This zip code:
$4,180
California:
$2,365
(% of AGI for various income ranges: 5.4% for AGIs $10k-25k, 2.6% for AGIs $25k-50k, 2.5% for AGIs $50k-75k, 2.3% for AGIs $75k-100k, 1.9% for AGIs over 100k)
Taxable dividends: $6,261 (reported on 52.8% of returns)
Here:
$6,261
State:
$4,746
(% of AGI for various income ranges: 6.2% for AGIs $10k-25k, 3.5% for AGIs $25k-50k, 3.0% for AGIs $50k-75k, 2.6% for AGIs $75k-100k, 2.2% for AGIs over 100k)
Net capital gain/loss: +$38,316 (reported on 50.5% of returns)
Here:
+$38,316
State:
+$23,418
(% of AGI for various income ranges: 1.4% for AGIs $10k-25k, 1.3% for AGIs $25k-50k, 1.1% for AGIs $50k-75k, 2.0% for AGIs $75k-100k, 17.3% for AGIs over 100k)
Profit/loss from business: +$39,221 (reported on 21.8% of returns)
Here:
+$39,221
State:
+$16,826
(% of AGI for various income ranges: 10.8% for AGIs $10k-25k, 9.9% for AGIs $25k-50k, 7.7% for AGIs $50k-75k, 9.5% for AGIs $75k-100k, 5.8% for AGIs over 100k)
IRA payment deduction: $3,637 (reported on 3.8% of returns)
95032:
$3,637
California:
$3,192
(% of AGI for various income ranges: 0.5% for AGIs $10k-25k, 0.4% for AGIs $25k-50k, 0.3% for AGIs $50k-75k, 0.2% for AGIs $75k-100k, 0.1% for AGIs over 100k)
Self-employed pension: $18,733 (reported on 5.0% of returns)
Here:
$18,733
California:
$17,688
(% of AGI for various income ranges: 0.3% for AGIs $10k-25k, 0.5% for AGIs $25k-50k, 0.6% for AGIs $50k-75k, 0.8% for AGIs $75k-100k, 0.7% for AGIs over 100k)
Total itemized deductions: $44,514 (22% of AGI, reported on 58.8% of returns)
Here:
$44,514
State:
$28,113
Here:
21.6% of AGI
State:
25.3% of AGI
(% of AGI for various income ranges: 30.2% for AGIs $10k-25k, 21.2% for AGIs $25k-50k, 21.5% for AGIs $50k-75k, 23.6% for AGIs $75k-100k, 18.6% for AGIs over 100k)
Charity contributions deductions: $5,690 (3% of AGI, reported on 53.5% of returns)
Here:
$5,690
State:
$3,923
Here:
2.6% of AGI
State:
3.3% of AGI
(% of AGI for various income ranges: 1.9% for AGIs $10k-25k, 1.9% for AGIs $25k-50k, 2.3% for AGIs $50k-75k, 2.4% for AGIs $75k-100k, 2.3% for AGIs over 100k)
Total tax: $31,959 (reported on 85.3% of returns)
95032:
$31,959
State:
$10,761
(% of AGI for various income ranges: 5.5% for AGIs $10k-25k, 9.4% for AGIs $25k-50k, 11.4% for AGIs $50k-75k, 11.9% for AGIs $75k-100k, 22.5% for AGIs over 100k)
Earned income credit: $1,214 (reported on 3.7% of returns)
Here:
$1,214
State:
$1,763
Percentage of individuals using paid preparers for their 2004 taxes: 62.1%
Here:
62%
State:
66%
(% for various income ranges: 53.6% for AGIs below $10k, 56.5% for AGIs $10k-25k, 59.2% for AGIs $25k-50k, 61.5% for AGIs $50k-75k, 62.3% for AGIs $75k-100k, 69.2% for AGIs over 100k)
Household received Food Stamps/SNAP in the past 12 months: 280 Household did not receive Food Stamps/SNAP in the past 12 months: 10,091
Women who had a birth in the past 12 months: 315 (281 now married, 33 unmarried) Women who did not have a birth in the past 12 months: 5,310 (3,047 now married, 2,223 unmarried)
Housing units in zip code 95032 with a mortgage: 4,604 (566 second mortgage, 29 home equity loan, 467 both second mortgage and home equity loan) Houses without a mortgage: 53
Median monthly owner costs for units with a mortgage: $3,876 Median monthly owner costs for units without a mortgage: $1,145
Residents with income below the poverty level in 2022:
This zip code:
3.7%
Whole state:
12.2%
Residents with income below 50% of the poverty level in 2022:
This zip code:
0.5%
Whole state:
6.2%
Median number of rooms in houses and condos:
Here:
6.6
State:
6.0
Median number of rooms in apartments:
Here:
4.3
State:
3.9
Notable locations in this zip code not listed on our city pages
Shopping Centers: Plaza de Los Gatos Shopping Center (1), Kings Court Shopping Center (2), Blossom Hill Square Shopping Center (3), Blossom Hill Shopping Center (4). Display/hide their locations on the map
Churches in zip code 95032 include: Congregation Tsemach Adonai (A), Kingdom Hall of Jehovahs Witnesses (B), Faith Lutheran Church (C), Nazarene Chapel (D). Display/hide their locations on the map
Parks in zip code 95032 include: Live Oak Manor Park (1), Guadalupe Reservoir County Park (2), Oak Meadow Park (3), Vasona Lake County Park (4). Display/hide their locations on the map
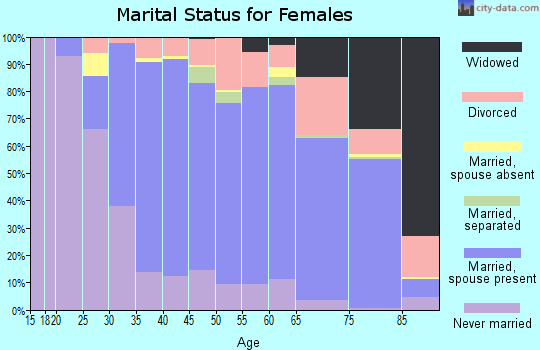
5,407 married couples with children.
815 single-parent households (326 men, 489 women).
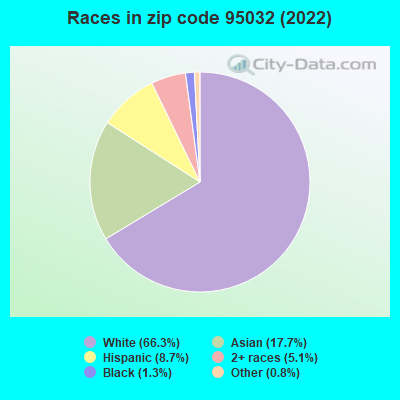
68.1% of residents of 95032 zip code speak English at home.
5.4% of residents speak Spanish at home (72% very well, 24% well, 4% not well).
13.9% of residents speak other Indo-European language at home (82% very well, 11% well, 7% not well).
11.3% of residents speak Asian or Pacific Island language at home (64% very well, 22% well, 9% not well, 5% not at all).
1.6% of residents speak other language at home (97% very well, 3% well).
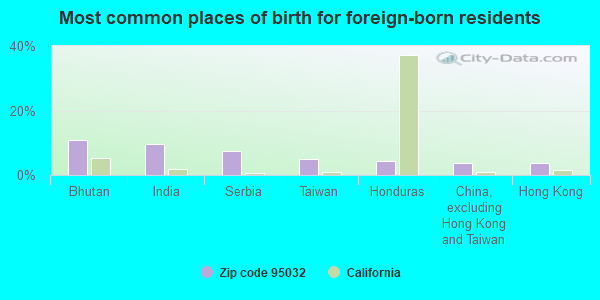
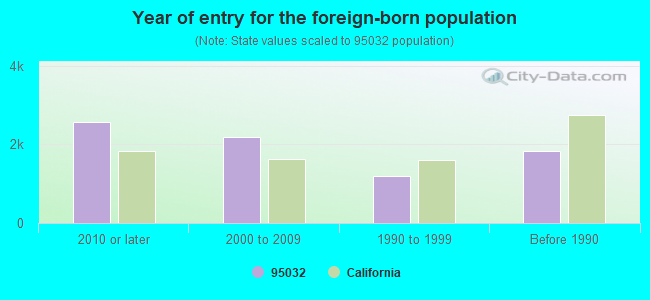
Foreign born population: 7,134 (26.0%) (60.7% of them are naturalized citizens)
Facilities with environmental interests located in this zip code:
KINGS COURT SHOPPING CTR (728 BLOSSOM HILL ROAD in LOS GATOS, CA)
STATE MASTER (California - Hazardous Waste Tracking) - HAZARDOU WASTE PROGRAM Large Quantity Generators, more that 1000 kg of hazardous waste/month (Resource Conservation and Recovery Act (tracking hazardous waste)) - notification Organizations: FEDERAL REALTY INVSTMT TRUST (CONTACT/OWNER)
ALTA VISTA ELEMENTARY (200 BLOSSOM VALLEY ROAD in LOS GATOS, CA)
(National Center for Education Statistics) - STATE ID-6049290 Organizations: UNION ELEMENTARY (SCHOOL DISTRICT)
LOS GATOS HIGH (20 HIGH SCHOOL COURT in LOS GATOS, CA)
(National Center for Education Statistics) - STATE ID-4334371 Organizations: LOS GATOS-SARATOGA JOINT UNION HIGH (SCHOOL DISTRICT)
LOUISE VAN METER ELEMENTARY (16445 LOS GATOS BLVD. in LOS GATOS, CA)
(National Center for Education Statistics) - STATE ID-6047542 Organizations: LOS GATOS UNION ELEMENTARY (SCHOOL DISTRICT)
LOS GATOS ACURA (16151 LOS GATOS BLVD in LOS GATOS, CA)
CRITERIA AND HAZARDOUS AIR POLLUTANT INVENTORY (Inventory of air pollution sources) Small Quantity Generators, between 100 kg and 1000 kg of hazardous waste/month (Resource Conservation and Recovery Act (tracking hazardous waste)) - notification Business SIC classification: TOP, BODY, AND UPHOLSTERY REPAIR SHOPS AND PAINT SHOPS Organizations: TED STEVENS (CONTACT/OWNER)
LOS GATOS CHEVROLET (15600 LOS GATOS BLVD in LOS GATOS, CA)
Small Quantity Generators, between 100 kg and 1000 kg of hazardous waste/month (Resource Conservation and Recovery Act (tracking hazardous waste)) - notification Organizations: DAVE SPENCER (CONTACT/OPERATOR)
, LOS GATOS LLC (CONTACT/OWNER)
Alternative names: ANDERSON CHEVROLET OLDSMOBILE GEO
MCHUGH LINCOLN MERCURY INC (15400 LOS GATOS BLVD in LOS GATOS, CA)
Small Quantity Generators, between 100 kg and 1000 kg of hazardous waste/month (Resource Conservation and Recovery Act (tracking hazardous waste)) - notification Organizations: JAMES S MC HUGH (CONTACT/OWNER)
LOS GATOS FOOT AND ANKLE CENTER (14601 S BASCOM AVE STE 240 in LOS GATOS, CA)
Small Quantity Generators, between 100 kg and 1000 kg of hazardous waste/month (Resource Conservation and Recovery Act (tracking hazardous waste)) - notification Organizations: JOAN OLOFF SOLOMON (CONTACT/OWNER)
ALL PROPERTIES MANAGEMENT (15466 LOS GATOS BLVD. in LOS GATOS, CA)
COMPLIANCE ACTIVITY (Tracking inspections of insecticide, fungicide, and rodenticide, and toxic substances)
IRON ROD, THE (638 UNIVERSITY AVENUE in LOS GATOS, CA)
CRITERIA AND HAZARDOUS AIR POLLUTANT INVENTORY (Inventory of air pollution sources) Business SIC classification: GRAY AND DUCTILE IRON FOUNDRIES
KING'S COURT C/O HENSHAW ASSOC (728 BLOSSOM HILL ROAD in LOS GATOS, CA)
CRITERIA AND HAZARDOUS AIR POLLUTANT INVENTORY (Inventory of air pollution sources) Business SIC classification: REFUSE SYSTEMS
LOS GATOS HONDA (16213 LOS GATOS BLVD in LOS GATOS, CA)
CRITERIA AND HAZARDOUS AIR POLLUTANT INVENTORY (Inventory of air pollution sources) Business SIC classification: MOTOR VEHICLE DEALERS (NEW AND USED)
Housing units lacking complete plumbing facilities: 1.2% Housing units lacking complete kitchen facilities: 1.6%
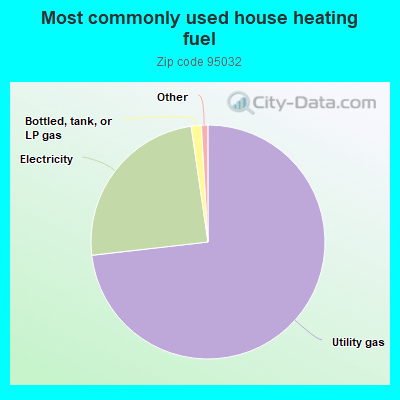
73.2%Utility gas
24.5%Electricity
1.4%Bottled, tank, or LP gas
Population in 1990: 18,189. Population change in the 1990s: +6,238 (+34.3%).
Place of birth for U.S.-born residents:
This state: 13,006
Northeast: 2,223
Midwest: 1,564
South: 1,667
West: 1,284
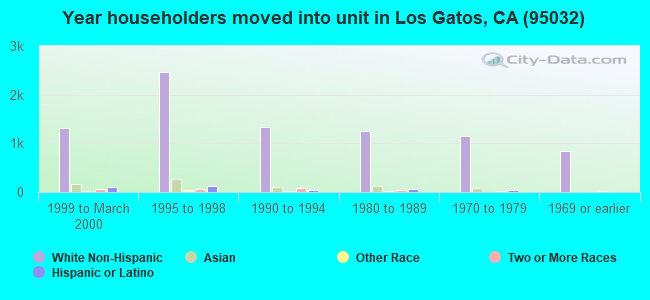
56% of the 95032 zip code residents lived in the same house 5 years ago. Out of people who lived in different houses, 63% lived in this county. Out of people who lived in different counties, 50% lived in California.
88% of the 95032 zip code residents lived in the same house 1 year ago. Out of people who lived in different houses, 67% moved from this county. Out of people who lived in different houses, 17% moved from different county within same state. Out of people who lived in different houses, 7% moved from different state. Out of people who lived in different houses, 7% moved from abroad.
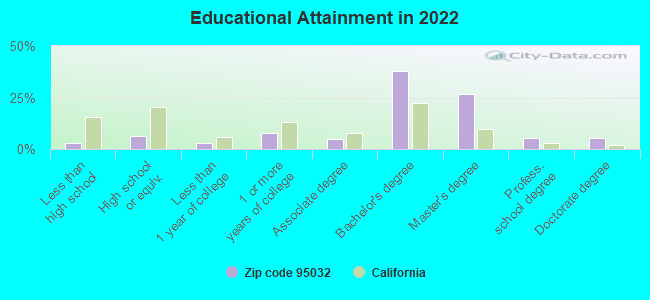
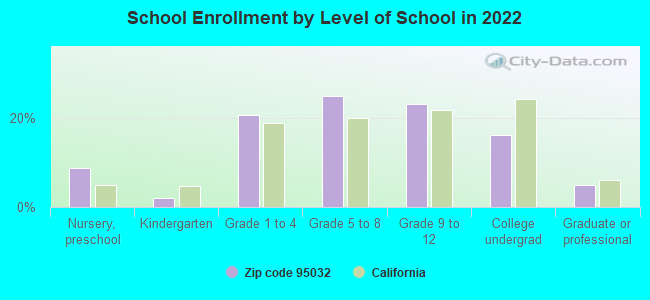
Private vs. public school enrollment:
Students in private schools in grades 1 to 8 (elementary and middle school): 508
Here:
15.6%
California:
10.5%
Students in private schools in grades 9 to 12 (high school): 407
Here:
24.5%
California:
8.5%
Students in private undergraduate colleges: 320
Here:
27.7%
California:
15.9%
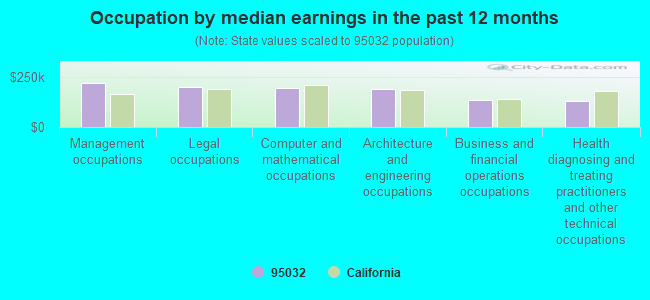
Occupation by median earnings in the past 12 months ($)
220,714Management occupations
199,731Legal occupations
197,963Computer and mathematical occupations
189,700Architecture and engineering occupations
135,530Business and financial operations occupations
131,518Health diagnosing and treating practitioners and other technical occupations
Companies with federal contracts located in this zip code (LOS GATOS, CA):
SIERRA NEVADA CORPORATION (985 UNIVERSITY AVENUE, SUI; small business) : $3,109,983 in 2 contractsin 2005
$2,854,983 with Army for Defense Electronics and Communication Equipment -- Advanced Development (R&D). Signed on 2005-02-14. Completion date: 2006-08-14.
$255,000, same as above.Signed on 2005-06-15. Completion date: 2006-08-14.
POSITIVE LIGHT INCORPORATED (101 COOPER CT) : $948,200 in 10 contractsfrom 2000 to 2004
Contracts for Physical Sciences -- Applied Research and Exploratory Development (R&D), Electrical and Electronic Properties Measuring and Testing Instruments, Combination and Miscellaneous Instruments, Stimulated Coherent Radiation Devices, Components and Accessories, and moreby Navy, Air Force, NASA, National Institute of Standards and Technology, and others Signed by year:2000: $95,000; 2001: $181,500; 2002: $78,750; 2003: $316,950; 2004: $276,000; 2005: $0; 2006: $0.
Biggest contracts:
$276,000 with Navy for Physical Sciences -- Applied Research and Exploratory Development (R&D). Signed on 2004-03-19. Completion date: 2004-07-16.
$181,500 with Navy for Electrical and Electronic Properties Measuring and Testing Instruments. Signed on 2001-03-07. Completion date: 2001-06-30.
$127,450 with Air Force for Combination and Miscellaneous Instruments. Signed on 2003-09-26. Completion date: 2004-01-01.
$95,000 with NASA for Stimulated Coherent Radiation Devices, Components and Accessories. Signed on 2000-09-15. Completion date: 2000-11-15.
JEPPESEN DATAPLAN INC (121 ALBRIGHT WAY) : $244,694 in 6 contractsfrom 2000 to 2005
Contracts for Other Professional Services, Print/Binding Services, Other Transportation Travel and Relocation Services, Patent and Trademark Services by Air Force, Forest Service Signed by year:2000: $265,980; 2001: $0; 2002: $0; 2003: $3,145; 2004: $0; 2005: -$24,431; 2006: $0.
Biggest contracts:
$135,980 with Air Force for Other Professional Services. Taking place in MD. Signed on 2000-10-26. Completion date: 2001-09-30.
$65,000, same as above.Signed on 2000-02-25. Completion date: 2000-09-30.
$65,000 with Air Force for Print/Binding Services. Taking place in MD. Signed on 2000-05-26. Completion date: 2000-09-30.
$3,145 with Forest Service for Other Transportation Travel and Relocation Services. Taking place in ID. Signed on 2003-04-15. Completion date: 2003-03-15.
CHANNEL ACCESS, LLC (170 KNOWLES DRIVE; small business) : $136,622 in 3 contractsfrom 2000 to 2006
$118,515 with Navy for ADP Components. Signed on 2000-04-07. Completion date: 2000-06-07.
$11,670 with Navy for Electronic Modules. Signed on 2006-01-27. Completion date: 2006-02-17.
$6,437 with Navy for ADPE System Configuration. Signed on 2005-03-11. Completion date: 2005-03-15.
ONSTOR, INC (130 KNOWLES DR STE B; small business)
$135,915 with Navy for ADP Components. Signed on 2005-09-29. Completion date: 2005-10-13.
SCIFORMA CORPORATION (985 UNIVERSITY AVE; small business) : $134,000 in 3 contractsfrom 2002 to 2004
$67,000 with Air Force for Other ADP and Telecommunications Services (includes data storage on tapes, compact disks, etc.). Taking place in NM. Signed on 2002-10-01. Completion date: 2003-09-29.
$33,500, same as above.Signed on 2004-03-24. Completion date: 2004-09-30.
$33,500, same as above.Signed on 2003-10-01. Completion date: 2004-03-31.
KENNETH J HAGAN (16763 SHANNON ROAD; small business) : $96,000 in 4 contractsfrom 2004 to 2005
$24,000 with Navy for Miscellaneous Items. Taking place in RI. Signed on 2004-10-13. Completion date: 2005-01-21.
$24,000, same as above.Signed on 2005-08-01. Completion date: 2005-11-04.
$24,000, same as above.Signed on 2005-04-05. Completion date: 2005-07-29.
$24,000, same as above.Signed on 2005-01-14. Completion date: 2005-04-23.
1 SOURCE OFFICE INTERIORS INC (15075 LOS GATOS BLVD; small business) : $53,410 in 5 contractsfrom 2005 to 2006
Contracts for Office Furniture by Navy, Army, Department of Defense, Air Force, and others Signed by year:2000: $0; 2001: $0; 2002: $0; 2003: $0; 2004: $0; 2005: $31,853; 2006: $21,557.
Biggest contracts:
$14,980 with Navy for Office Furniture. Signed on 2005-09-27. Completion date: 2005-12-15.
$14,072 with Army for Office Furniture. Taking place in FL. Signed on 2006-02-07. Completion date: 2006-04-04.
$9,415 with Department of Defense for Office Furniture. Taking place in NC. Signed on 2005-09-23. Completion date: 2005-10-28.
$7,485 with Army for Office Furniture. Signed on 2006-01-12. Completion date: 2006-01-31.
RELIABLE POWER METERS INC (400 BLOSSOM HILL RD; small business)
$25,112 with Navy for Electrical and Electronic Properties Measuring and Testing Instruments. Signed on 2000-10-16. Completion date: 2000-10-31.
SEM LAB CONSULTING INC (15732 LOS GATOS BLVD # 435; small business) : $12,001 in 3 contractsfrom 2004 to 2005
$6,000 with Navy for Maintenance, Repair and Rebuilding of Equipment -- Instruments and Laboratory Equipment. Signed on 2005-08-06. Completion date: 2006-09-30.
$6,000 with Navy for Maintenance, Repair and Rebuilding of Equipment -- Maintenance and Repair Shop Equipment. Signed on 2004-09-21. Completion date: 2005-09-30.
$1, same as above.Signed on 2004-12-06. Completion date: 2004-12-10.
Top industries in this zip code by the number of employees in 2005:
Health Care and Social Assistance: General Medical and Surgical Hospitals (over 1000 employees: 1 establishment)
Health Care and Social Assistance: Offices of Physicians (except Mental Health Specialists) (50-99: 1, 20-49: 3, 10-19: 14, 5-9: 47, 1-4: 102)
Other Services (except Public Administration): Religious Organizations (100-249: 1, 50-99: 1, 20-49: 3, 5-9: 1, 1-4: 3)
Professional, Scientific, and Technical Services: Research and Development in the Physical, Engineering, and Life Sciences (50-99: 2, 10-19: 3, 5-9: 2)
People in group quarters in 2010:
203 people in nursing facilities/skilled-nursing facilities
7 people in group homes intended for adults
7 people in workers' group living quarters and job corps centers
People in group quarters in 2000:
512 people in nursing homes
36 people in other noninstitutional group quarters
12 people in other nonhousehold living situations
8 people in homes for the mentally retarded
Fatal accident statistics in 2012:
Fatal accident count: 2
Vehicles involved in fatal accidents: 3
Fatal accidents caused by drunken drivers: 1
Fatalities: 3
Persons involved in fatal accidents: 8
Pedestrians involved in fatal accidents: 0
Fatal accident statistics in 2011:
Fatal accident count: 1
Vehicles involved in fatal accidents: 1
Fatal accidents caused by drunken drivers: 1
Fatalities: 1
Persons involved in fatal accidents: 1
Pedestrians involved in fatal accidents: 0
Home Mortgage Disclosure Act Aggregated Statistics For Year 2009 (Based on 2 full and 14 partial tracts)
A) FHA, FSA/RHS & VA Home Purchase Loans
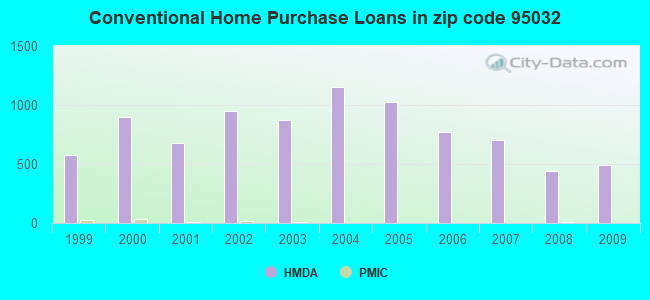
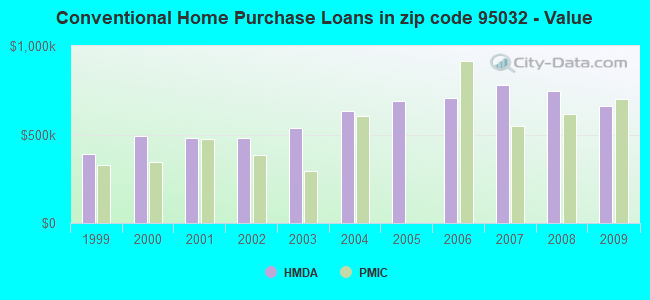
B) Conventional Home Purchase Loans
C) Refinancings
D) Home Improvement Loans
E) Loans on Dwellings For 5+ Families
F) Non-occupant Loans on < 5 Family Dwellings (A B C & D)
G) Loans On Manufactured Home Dwelling (A B C & D)
Number
Average Value
Number
Average Value
Number
Average Value
Number
Average Value
Number
Average Value
Number
Average Value
Number
Average Value
LOANS ORIGINATED
33
$584,569
488
$659,146
2,700
$463,973
65
$324,954
3
$2,400,010
100
$407,022
0
$0
APPLICATIONS APPROVED, NOT ACCEPTED
5
$651,912
97
$667,378
257
$486,862
14
$399,229
0
$0
9
$326,696
1
$263,990
APPLICATIONS DENIED
10
$608,383
113
$680,478
501
$610,305
24
$496,194
0
$0
31
$459,042
6
$213,147
APPLICATIONS WITHDRAWN
4
$487,488
48
$690,975
295
$526,205
15
$345,043
0
$0
10
$391,805
0
$0
FILES CLOSED FOR INCOMPLETENESS
2
$698,200
11
$585,394
102
$499,886
11
$333,096
0
$0
5
$499,438
1
$285,990
Aggregated Statistics For Year 2008 (Based on 2 full and 14 partial tracts)
A) FHA, FSA/RHS & VA Home Purchase Loans
B) Conventional Home Purchase Loans
C) Refinancings
D) Home Improvement Loans
E) Loans on Dwellings For 5+ Families
F) Non-occupant Loans on < 5 Family Dwellings (A B C & D)
G) Loans On Manufactured Home Dwelling (A B C & D)
Number
Average Value
Number
Average Value
Number
Average Value
Number
Average Value
Number
Average Value
Number
Average Value
Number
Average Value
LOANS ORIGINATED
3
$764,300
444
$743,024
984
$573,289
58
$343,361
2
$937,355
59
$510,809
3
$148,127
APPLICATIONS APPROVED, NOT ACCEPTED
0
$0
112
$773,115
201
$580,795
14
$453,489
0
$0
21
$387,729
5
$125,922
APPLICATIONS DENIED
1
$450,680
137
$766,370
368
$700,407
34
$557,288
2
$421,920
33
$518,941
17
$209,052
APPLICATIONS WITHDRAWN
2
$636,130
68
$751,259
227
$644,024
22
$388,266
4
$3,122,182
14
$650,576
0
$0
FILES CLOSED FOR INCOMPLETENESS
0
$0
15
$645,387
52
$652,354
8
$187,091
0
$0
5
$543,696
0
$0
Aggregated Statistics For Year 2007 (Based on 2 full and 14 partial tracts)
B) Conventional Home Purchase Loans
C) Refinancings
D) Home Improvement Loans
E) Loans on Dwellings For 5+ Families
F) Non-occupant Loans on < 5 Family Dwellings (A B C & D)
G) Loans On Manufactured Home Dwelling (A B C & D)
Number
Average Value
Number
Average Value
Number
Average Value
Number
Average Value
Number
Average Value
Number
Average Value
LOANS ORIGINATED
707
$780,880
1,253
$665,794
119
$491,457
22
$2,208,951
126
$557,357
8
$117,679
APPLICATIONS APPROVED, NOT ACCEPTED
178
$739,789
261
$717,818
29
$192,773
0
$0
26
$689,828
14
$205,186
APPLICATIONS DENIED
170
$686,486
473
$863,129
52
$643,327
2
$964,480
52
$521,697
25
$182,072
APPLICATIONS WITHDRAWN
63
$932,252
215
$771,703
13
$710,510
2
$3,154,630
18
$1,160,788
0
$0
FILES CLOSED FOR INCOMPLETENESS
15
$941,690
74
$739,487
6
$212,282
0
$0
3
$687,763
0
$0
Aggregated Statistics For Year 2006 (Based on 2 full and 14 partial tracts)
A) FHA, FSA/RHS & VA Home Purchase Loans
B) Conventional Home Purchase Loans
C) Refinancings
D) Home Improvement Loans
E) Loans on Dwellings For 5+ Families
F) Non-occupant Loans on < 5 Family Dwellings (A B C & D)
G) Loans On Manufactured Home Dwelling (A B C & D)
Number
Average Value
Number
Average Value
Number
Average Value
Number
Average Value
Number
Average Value
Number
Average Value
Number
Average Value
LOANS ORIGINATED
0
$0
774
$706,483
1,396
$639,995
154
$460,741
12
$932,598
142
$589,990
3
$108,530
APPLICATIONS APPROVED, NOT ACCEPTED
0
$0
174
$589,129
271
$581,385
26
$340,672
0
$0
37
$455,071
6
$174,880
APPLICATIONS DENIED
0
$0
157
$829,984
406
$738,379
58
$490,412
0
$0
47
$698,364
10
$167,192
APPLICATIONS WITHDRAWN
1
$522,410
90
$744,522
290
$607,408
20
$354,686
0
$0
14
$564,774
0
$0
FILES CLOSED FOR INCOMPLETENESS
0
$0
19
$653,338
60
$612,666
3
$246,440
0
$0
4
$669,112
0
$0
Aggregated Statistics For Year 2005 (Based on 2 full and 14 partial tracts)
A) FHA, FSA/RHS & VA Home Purchase Loans
B) Conventional Home Purchase Loans
C) Refinancings
D) Home Improvement Loans
E) Loans on Dwellings For 5+ Families
F) Non-occupant Loans on < 5 Family Dwellings (A B C & D)
G) Loans On Manufactured Home Dwelling (A B C & D)
Number
Average Value
Number
Average Value
Number
Average Value
Number
Average Value
Number
Average Value
Number
Average Value
Number
Average Value
LOANS ORIGINATED
0
$0
1,022
$691,938
1,812
$593,235
158
$486,724
17
$1,433,544
159
$524,996
6
$124,662
APPLICATIONS APPROVED, NOT ACCEPTED
0
$0
150
$657,067
264
$649,015
20
$476,873
0
$0
18
$363,497
7
$70,244
APPLICATIONS DENIED
0
$0
209
$669,579
476
$682,038
51
$483,629
0
$0
51
$665,122
9
$99,173
APPLICATIONS WITHDRAWN
1
$522,410
119
$571,302
338
$538,606
29
$435,571
0
$0
26
$462,220
0
$0
FILES CLOSED FOR INCOMPLETENESS
0
$0
32
$571,128
97
$646,041
8
$1,128,595
0
$0
5
$512,936
0
$0
Aggregated Statistics For Year 2004 (Based on 2 full and 14 partial tracts)
B) Conventional Home Purchase Loans
C) Refinancings
D) Home Improvement Loans
E) Loans on Dwellings For 5+ Families
F) Non-occupant Loans on < 5 Family Dwellings (A B C & D)
G) Loans On Manufactured Home Dwelling (A B C & D)
Number
Average Value
Number
Average Value
Number
Average Value
Number
Average Value
Number
Average Value
Number
Average Value
LOANS ORIGINATED
1,154
$633,199
2,514
$528,458
86
$343,837
8
$1,623,760
192
$427,161
1
$186,260
APPLICATIONS APPROVED, NOT ACCEPTED
180
$660,552
352
$555,686
24
$210,445
0
$0
25
$333,972
3
$93,277
APPLICATIONS DENIED
198
$629,309
533
$589,140
55
$416,912
2
$964,480
55
$623,411
8
$116,899
APPLICATIONS WITHDRAWN
135
$631,305
480
$556,013
15
$257,565
1
$12,056,000
26
$362,793
0
$0
FILES CLOSED FOR INCOMPLETENESS
25
$536,453
84
$572,451
6
$140,175
0
$0
5
$674,612
0
$0
Aggregated Statistics For Year 2003 (Based on 2 full and 14 partial tracts)
A) FHA, FSA/RHS & VA Home Purchase Loans
B) Conventional Home Purchase Loans
C) Refinancings
D) Home Improvement Loans
E) Loans on Dwellings For 5+ Families
F) Non-occupant Loans on < 5 Family Dwellings (A B C & D)
Number
Average Value
Number
Average Value
Number
Average Value
Number
Average Value
Number
Average Value
Number
Average Value
LOANS ORIGINATED
1
$93,890
877
$534,042
6,363
$423,239
25
$105,764
8
$1,872,935
332
$321,673
APPLICATIONS APPROVED, NOT ACCEPTED
1
$108,960
110
$514,297
837
$417,680
6
$326,677
0
$0
57
$301,997
APPLICATIONS DENIED
0
$0
135
$499,556
763
$508,329
15
$83,157
1
$421,960
49
$420,649
APPLICATIONS WITHDRAWN
0
$0
70
$566,663
738
$365,628
15
$49,229
0
$0
29
$288,003
FILES CLOSED FOR INCOMPLETENESS
0
$0
21
$575,315
202
$515,979
8
$88,511
0
$0
9
$352,856
Aggregated Statistics For Year 2002 (Based on 2 full and 12 partial tracts)
A) FHA, FSA/RHS & VA Home Purchase Loans
B) Conventional Home Purchase Loans
C) Refinancings
D) Home Improvement Loans
E) Loans on Dwellings For 5+ Families
F) Non-occupant Loans on < 5 Family Dwellings (A B C & D)
Number
Average Value
Number
Average Value
Number
Average Value
Number
Average Value
Number
Average Value
Number
Average Value
LOANS ORIGINATED
0
$0
949
$482,290
5,141
$429,363
49
$114,432
7
$1,199,307
247
$335,243
APPLICATIONS APPROVED, NOT ACCEPTED
4
$61,665
114
$501,580
682
$427,645
16
$152,819
0
$0
21
$325,082
APPLICATIONS DENIED
0
$0
95
$468,588
543
$449,945
33
$115,432
0
$0
35
$352,805
APPLICATIONS WITHDRAWN
0
$0
89
$391,053
602
$404,926
16
$67,167
0
$0
39
$343,124
FILES CLOSED FOR INCOMPLETENESS
0
$0
33
$475,506
181
$509,470
0
$0
0
$0
11
$280,125
Aggregated Statistics For Year 2001 (Based on 2 full and 12 partial tracts)
B) Conventional Home Purchase Loans
C) Refinancings
D) Home Improvement Loans
E) Loans on Dwellings For 5+ Families
F) Non-occupant Loans on < 5 Family Dwellings (A B C & D)
Number
Average Value
Number
Average Value
Number
Average Value
Number
Average Value
Number
Average Value
LOANS ORIGINATED
678
$479,689
3,096
$429,003
192
$89,117
5
$1,775,436
166
$316,230
APPLICATIONS APPROVED, NOT ACCEPTED
151
$497,589
434
$419,717
29
$101,330
0
$0
29
$265,978
APPLICATIONS DENIED
111
$518,789
461
$503,724
43
$102,765
0
$0
42
$516,568
APPLICATIONS WITHDRAWN
95
$440,949
399
$400,735
24
$128,251
1
$337,570
18
$286,631
FILES CLOSED FOR INCOMPLETENESS
25
$474,017
196
$440,002
3
$105,170
4
$2,223,275
0
$0
Aggregated Statistics For Year 2000 (Based on 2 full and 12 partial tracts)
A) FHA, FSA/RHS & VA Home Purchase Loans
B) Conventional Home Purchase Loans
C) Refinancings
D) Home Improvement Loans
E) Loans on Dwellings For 5+ Families
F) Non-occupant Loans on < 5 Family Dwellings (A B C & D)
Number
Average Value
Number
Average Value
Number
Average Value
Number
Average Value
Number
Average Value
Number
Average Value
LOANS ORIGINATED
1
$256,650
897
$489,620
688
$366,603
153
$90,668
5
$2,471,728
98
$351,053
APPLICATIONS APPROVED, NOT ACCEPTED
0
$0
115
$446,010
111
$313,155
26
$89,169
0
$0
5
$249,356
APPLICATIONS DENIED
1
$334,340
143
$451,053
202
$365,018
37
$90,343
0
$0
19
$489,704
APPLICATIONS WITHDRAWN
0
$0
111
$464,645
144
$289,219
19
$108,806
0
$0
13
$298,515
FILES CLOSED FOR INCOMPLETENESS
0
$0
27
$573,543
100
$279,067
9
$175,341
2
$3,211,530
2
$255,005
Aggregated Statistics For Year 1999 (Based on 1 full and 7 partial tracts)
A) FHA, FSA/RHS & VA Home Purchase Loans
B) Conventional Home Purchase Loans
C) Refinancings
D) Home Improvement Loans
E) Loans on Dwellings For 5+ Families
F) Non-occupant Loans on < 5 Family Dwellings (A B C & D)
2005 - 2018 National Fire Incident Reporting System (NFIRS) incidents
Based on the data from the years 2005 - 2018 the average number of fire incidents per year is 32. The highest number of fire incidents - 51 took place in 2017, and the least - 14 in 2015. The data has a growing trend.
When looking into fire subcategories, the most incidents belonged to: Outside Fires (46.7%), and Structure Fires (32.4%).
Fire incident types reported to NFIRS in Zip Code 95032


 Nearest zip codes: 95124, 95118, 95030, 95008, 95033, 95130.


 Based on the data from the years 2005 - 2018 the average number of fire incidents per year is 32. The highest number of fire incidents - 51 took place in 2017, and the least - 14 in 2015. The data has a growing trend.
 When looking into fire subcategories, the most incidents belonged to: Outside Fires (46.7%), and Structure Fires (32.4%).