Estimated zip code population in 2022: 24,241 Zip code population in 2010: 23,364 Zip code population in 2000: 13,013
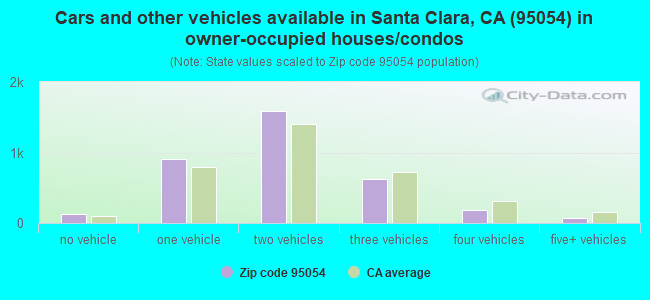
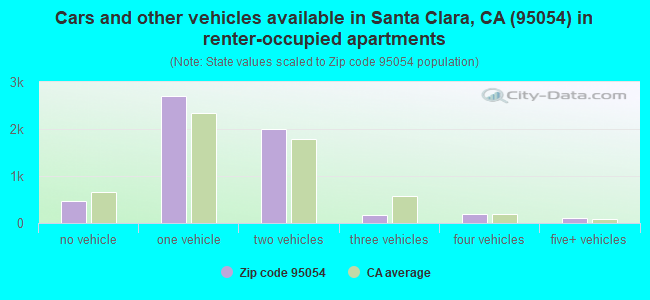
Houses and condos: 9,800 Renter-occupied apartments: 5,640
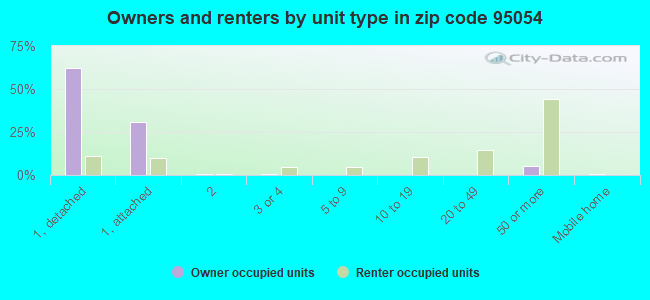
% of renters here:
62%
State:
44%
March 2022 cost of living index in zip code 95054: 123.4 (high, U.S. average is 100)
Land area: 6.3 sq. mi. Water area: 0.0 sq. mi.
Population density: 3,869 people per square mile
(average).
OSM Map
General Map
Google Map
MSN Map
OSM Map
General Map
Google Map
MSN Map
OSM Map
General Map
Google Map
MSN Map
OSM Map
General Map
Google Map
MSN Map
Please wait while loading the map...
Real estate property taxes paid for housing units in 2022:
This zip code:
0.7% ($10,292)
California:
0.7% ($4,831)
Median real estate property taxes paid for housing units with mortgages in 2022: $10,330 (0.7%) Median real estate property taxes paid for housing units with no mortgage in 2022: $7,566 (0.5%)
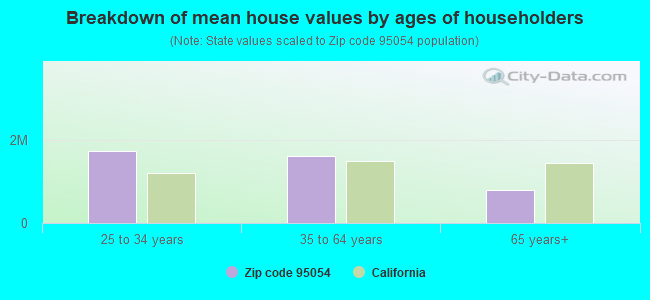
Estimated median house/condo value in 2022: $1,512,044
95054:
$1,512,044
California:
$715,900
According to our research of California and other state lists, there were 18 registered sex offenders living in 95054 zip code as of April 23, 2024. The ratio of all residents to sex offenders in zip code 95054 is 1,393 to 1. The ratio of registered sex offenders to all residents in this zip code is lower than the state average.
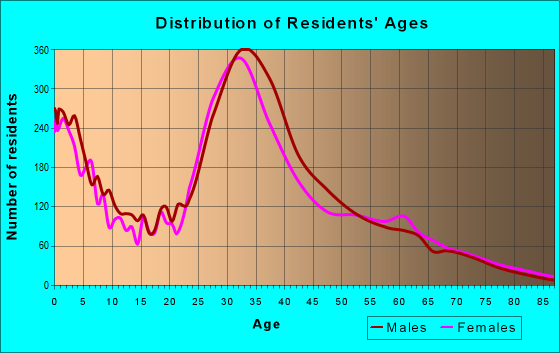
Median resident age:
This zip code:
34.4 years
California median age:
37.9 years
Average household size:
This zip code:
2.6 people
California:
2.8 people
Averages for the 2020 tax year for zip code 95054, filed in 2021:
Average Adjusted Gross Income (AGI) in 2020: $199,061 (Individual Income Tax Returns)
Here:
$199,061
State:
$95,910
Salary/wage: $188,691 (reported on 91.3% of returns)
Here:
$188,691
State:
$77,331
(% of AGI for various income ranges: 1192.4% for AGIs below $25k, 4003.1% for AGIs $25k-50k, 7439.6% for AGIs $50k-75k, 10986.4% for AGIs $75k-100k, 23249.6% for AGIs $100k-200k, 171910.3% for AGIs over 200k)
Taxable interest for individuals: $1,627 (reported on 48.2% of returns)
This zip code:
$1,627
California:
$2,294
(% of AGI for various income ranges: 29.1% for AGIs below $25k, 33.7% for AGIs $25k-50k, 35.5% for AGIs $50k-75k, 64.3% for AGIs $75k-100k, 86.4% for AGIs $100k-200k, 759.9% for AGIs over 200k)
Ordinary dividends: $4,741 (reported on 45.2% of returns)
Here:
$4,741
State:
$10,949
(% of AGI for various income ranges: 35.9% for AGIs below $25k, 44.8% for AGIs $25k-50k, 62.8% for AGIs $50k-75k, 94.3% for AGIs $75k-100k, 187.4% for AGIs $100k-200k, 2382.8% for AGIs over 200k)
Net capital gain/loss in AGI: +$33,545 (reported on 45.0% of returns)
Here:
+$33,545
State:
+$49,306
(% of AGI for various income ranges: 16.0% for AGIs below $25k, 57.9% for AGIs $25k-50k, 114.2% for AGIs $50k-75k, 216.4% for AGIs $75k-100k, 542.5% for AGIs $100k-200k, 19581.8% for AGIs over 200k)
Profit/loss from business: +$14,828 (reported on 10.2% of returns)
Here:
+$14,828
State:
+$15,671
(% of AGI for various income ranges: 147.6% for AGIs below $25k, 188.1% for AGIs $25k-50k, 144.0% for AGIs $50k-75k, 201.7% for AGIs $75k-100k, 248.9% for AGIs $100k-200k, 915.1% for AGIs over 200k)
Taxable individual retirement arrangement distribution: $17,831 (reported on 4.4% of returns)
95054:
$17,831
California:
$23,505
(% of AGI for various income ranges: 52.3% for AGIs below $25k, 75.4% for AGIs $25k-50k, 103.5% for AGIs $50k-75k, 161.6% for AGIs $75k-100k, 165.1% for AGIs $100k-200k, 373.4% for AGIs over 200k)
Self-employed (Keogh) retirement plans: $25,567 (reported on 0.5% of returns)
95054:
$25,567
California:
$30,163
(% of AGI for various income ranges: 23.9% for AGIs below $25k, 142.6% for AGIs over 200k)
Total itemized deductions: $36,967 (reported on 16.8% of returns)
Here:
$36,967
State:
$39,517
(% of AGI for various income ranges: 124.4% for AGIs below $25k, 161.1% for AGIs $25k-50k, 261.4% for AGIs $50k-75k, 473.8% for AGIs $75k-100k, 839.7% for AGIs $100k-200k, 6039.9% for AGIs over 200k)
Charity contributions: $11,089 (reported on 12.7% of returns)
Here:
$11,089
State:
$12,598
(% of AGI for various income ranges: 5.6% for AGIs below $25k, 16.9% for AGIs $25k-50k, 41.2% for AGIs $50k-75k, 82.6% for AGIs $75k-100k, 125.1% for AGIs $100k-200k, 1576.1% for AGIs over 200k)
Taxes paid: $9,461 (reported on 16.8% of returns)
95054:
$9,461
State:
$8,807
(% of AGI for various income ranges: 22.7% for AGIs below $25k, 41.2% for AGIs $25k-50k, 72.5% for AGIs $50k-75k, 151.9% for AGIs $75k-100k, 282.4% for AGIs $100k-200k, 1393.3% for AGIs over 200k)
Earned income credit: $1,602 (reported on 4.7% of returns)
Here:
$1,602
State:
$2,074
(% of AGI for various income ranges: 51.3% for AGIs below $25k, 33.3% for AGIs $25k-50k)
Percentage of individuals using paid preparers for their 2020 taxes: 93.3%
Here:
93%
State:
92%
(% for various income ranges: 91.3% for AGIs below $25k, 92.6% for AGIs $25k-50k, 92.3% for AGIs $50k-75k, 92.0% for AGIs $75k-100k, 93.2% for AGIs $100k-200k, 95.2% for AGIs over 200k)
Averages for the 2012 tax year for zip code 95054, filed in 2013:
Average Adjusted Gross Income (AGI) in 2012: $130,531 (Individual Income Tax Returns)
Here:
$130,531
State:
$72,726
Salary/wage: $129,286 (reported on 92.0% of returns)
Here:
$129,286
State:
$59,079
(% of AGI for various income ranges: 80.3% for AGIs below $25k, 88.8% for AGIs $25k-50k, 87.1% for AGIs $50k-75k, 93.2% for AGIs $75k-100k, 95.0% for AGIs $100k-200k, 89.7% for AGIs over 200k)
Taxable interest for individuals: $1,231 (reported on 46.9% of returns)
This zip code:
$1,231
California:
$2,146
(% of AGI for various income ranges: 1.2% for AGIs below $25k, 0.3% for AGIs $25k-50k, 0.5% for AGIs $50k-75k, 0.2% for AGIs $75k-100k, 0.3% for AGIs $100k-200k, 0.5% for AGIs over 200k)
Ordinary dividends: $3,180 (reported on 36.3% of returns)
Here:
$3,180
State:
$9,308
(% of AGI for various income ranges: 1.2% for AGIs below $25k, 0.5% for AGIs $25k-50k, 0.6% for AGIs $50k-75k, 0.5% for AGIs $75k-100k, 0.6% for AGIs $100k-200k, 1.1% for AGIs over 200k)
Net capital gain/loss in AGI: +$7,698 (reported on 34.4% of returns)
Here:
+$7,698
State:
+$30,460
(% of AGI for various income ranges: 0.1% for AGIs $50k-75k, 0.4% for AGIs $100k-200k, 3.6% for AGIs over 200k)
Profit/loss from business: +$17,361 (reported on 11.7% of returns)
Here:
+$17,361
State:
+$17,064
(% of AGI for various income ranges: 9.3% for AGIs below $25k, 4.3% for AGIs $25k-50k, 3.5% for AGIs $50k-75k, 1.7% for AGIs $75k-100k, 1.2% for AGIs $100k-200k, 1.0% for AGIs over 200k)
Taxable individual retirement arrangement distribution: $18,158 (reported on 4.5% of returns)
95054:
$18,158
California:
$19,557
(% of AGI for various income ranges: 3.2% for AGIs below $25k, 1.7% for AGIs $25k-50k, 1.5% for AGIs $50k-75k, 0.8% for AGIs $75k-100k, 0.6% for AGIs $100k-200k, 0.4% for AGIs over 200k)
Self-employment retirement plans: $18,000 (reported on 0.8% of returns)
95054:
$18,000
California:
$24,530
(% of AGI for various income ranges: 0.1% for AGIs $100k-200k, 0.1% for AGIs over 200k)
Total itemized deductions: $31,955 (16% of AGI, reported on 51.2% of returns)
Here:
$31,955
State:
$34,004
Here:
15.9% of AGI
State:
22.7% of AGI
(% of AGI for various income ranges: 9.6% for AGIs below $25k, 8.5% for AGIs $25k-50k, 10.8% for AGIs $50k-75k, 12.4% for AGIs $75k-100k, 12.7% for AGIs $100k-200k, 13.0% for AGIs over 200k)
Charity contributions: $3,580 (reported on 33.8% of returns)
Here:
$3,580
State:
$4,659
(% of AGI for various income ranges: 0.5% for AGIs below $25k, 0.8% for AGIs $25k-50k, 0.9% for AGIs $50k-75k, 1.1% for AGIs $75k-100k, 1.0% for AGIs $100k-200k, 0.9% for AGIs over 200k)
Taxes paid: $18,128 (reported on 51.1% of returns)
95054:
$18,128
State:
$14,448
(% of AGI for various income ranges: 1.8% for AGIs below $25k, 2.3% for AGIs $25k-50k, 3.4% for AGIs $50k-75k, 5.6% for AGIs $75k-100k, 6.5% for AGIs $100k-200k, 8.5% for AGIs over 200k)
Earned income credit: $1,959 (reported on 7.2% of returns)
Here:
$1,959
State:
$2,286
(% of AGI for various income ranges: 4.3% for AGIs below $25k, 0.6% for AGIs $25k-50k)
Percentage of individuals using paid preparers for their 2012 taxes: 56.9%
Here:
57%
State:
64%
(% for various income ranges: 54.9% for AGIs below $25k, 56.2% for AGIs $25k-50k, 53.8% for AGIs $50k-75k, 56.0% for AGIs $75k-100k, 56.2% for AGIs $100k-200k, 62.5% for AGIs over 200k)
Averages for the 2004 tax year for zip code 95054, filed in 2005:
Average Adjusted Gross Income (AGI) in 2004: $92,231 (Individual Income Tax Returns)
Here:
$92,231
State:
$58,600
Salary/wage: $75,840 (reported on 92.4% of returns)
Here:
$75,840
State:
$49,455
(% of AGI for various income ranges: 219.7% for AGIs below $10k, 89.4% for AGIs $10k-25k, 92.7% for AGIs $25k-50k, 94.8% for AGIs $50k-75k, 96.7% for AGIs $75k-100k, 67.0% for AGIs over 100k)
Taxable interest for individuals: $1,031 (reported on 48.4% of returns)
This zip code:
$1,031
California:
$2,365
(% of AGI for various income ranges: 6.5% for AGIs below $10k, 1.1% for AGIs $10k-25k, 0.7% for AGIs $25k-50k, 0.5% for AGIs $50k-75k, 0.4% for AGIs $75k-100k, 0.5% for AGIs over 100k)
Taxable dividends: $3,620 (reported on 26.1% of returns)
Here:
$3,620
State:
$4,746
(% of AGI for various income ranges: 4.0% for AGIs below $10k, 0.8% for AGIs $10k-25k, 0.4% for AGIs $25k-50k, 0.3% for AGIs $50k-75k, 0.3% for AGIs $75k-100k, 1.3% for AGIs over 100k)
Net capital gain/loss: +$10,833 (reported on 29.9% of returns)
Here:
+$10,833
State:
+$23,418
(% of AGI for various income ranges: -5.8% for AGIs below $10k, -0.1% for AGIs $10k-25k, 0.2% for AGIs $25k-50k, 0.0% for AGIs $50k-75k, 0.5% for AGIs $75k-100k, 5.1% for AGIs over 100k)
Profit/loss from business: +$12,130 (reported on 10.4% of returns)
Here:
+$12,130
State:
+$16,826
(% of AGI for various income ranges: 6.9% for AGIs below $10k, 3.8% for AGIs $10k-25k, 2.6% for AGIs $25k-50k, 1.9% for AGIs $50k-75k, 1.2% for AGIs $75k-100k, 1.0% for AGIs over 100k)
IRA payment deduction: $3,045 (reported on 2.5% of returns)
95054:
$3,045
California:
$3,192
(% of AGI for various income ranges: 0.2% for AGIs $10k-25k, 0.1% for AGIs $25k-50k, 0.2% for AGIs $50k-75k, 0.2% for AGIs $75k-100k, 0.1% for AGIs over 100k)
Self-employed pension: $14,580 (reported on 0.7% of returns)
Here:
$14,580
California:
$17,688
Total itemized deductions: $29,542 (21% of AGI, reported on 52.1% of returns)
Here:
$29,542
State:
$28,113
Here:
20.9% of AGI
State:
25.3% of AGI
(% of AGI for various income ranges: 34.3% for AGIs below $10k, 12.1% for AGIs $10k-25k, 13.7% for AGIs $25k-50k, 15.1% for AGIs $50k-75k, 15.5% for AGIs $75k-100k, 17.5% for AGIs over 100k)
Charity contributions deductions: $2,701 (2% of AGI, reported on 33.6% of returns)
Here:
$2,701
State:
$3,923
Here:
2.0% of AGI
State:
3.3% of AGI
(% of AGI for various income ranges: 0.8% for AGIs below $10k, 0.6% for AGIs $10k-25k, 1.3% for AGIs $25k-50k, 1.3% for AGIs $50k-75k, 1.4% for AGIs $75k-100k, 0.9% for AGIs over 100k)
Total tax: $17,636 (reported on 84.9% of returns)
95054:
$17,636
State:
$10,761
(% of AGI for various income ranges: 7.3% for AGIs below $10k, 5.1% for AGIs $10k-25k, 7.8% for AGIs $25k-50k, 11.2% for AGIs $50k-75k, 12.5% for AGIs $75k-100k, 19.0% for AGIs over 100k)
Earned income credit: $1,465 (reported on 5.9% of returns)
Here:
$1,465
State:
$1,763
Percentage of individuals using paid preparers for their 2004 taxes: 56.0%
Here:
56%
State:
66%
(% for various income ranges: 55.1% for AGIs below $10k, 62.1% for AGIs $10k-25k, 63.6% for AGIs $25k-50k, 52.1% for AGIs $50k-75k, 48.3% for AGIs $75k-100k, 52.2% for AGIs over 100k)
Household received Food Stamps/SNAP in the past 12 months: 415 Household did not receive Food Stamps/SNAP in the past 12 months: 8,571
Women who had a birth in the past 12 months: 208 (181 now married, 26 unmarried) Women who did not have a birth in the past 12 months: 6,764 (3,610 now married, 3,115 unmarried)
Housing units in zip code 95054 with a mortgage: 2,396 (158 second mortgage, 5 home equity loan, 130 both second mortgage and home equity loan) Median monthly owner costs for units with a mortgage: $3,876 Median monthly owner costs for units without a mortgage: $1,074
Residents with income below the poverty level in 2022:
This zip code:
8.1%
Whole state:
12.2%
Residents with income below 50% of the poverty level in 2022:
This zip code:
3.6%
Whole state:
6.2%
Median number of rooms in houses and condos:
Here:
5.7
State:
6.0
Median number of rooms in apartments:
Here:
3.4
State:
3.9
Notable locations in this zip code not listed on our city pages
Notable locations in zip code 95054: Santa Clara Municipal Golf Course (A), Santa Clara Fire Department Station 8 (B), Santa Clara Fire Department Station 6 (C), Santa Clara Fire Department Station 10 (D), Santa Clara Convention Center (E). Display/hide their locations on the map
Churches in zip code 95054 include: Our Lady of Peace Catholic Church (A), Our Lady of Peace Shrine (B), Christian Wisdom In USA Church (C), North Valley Baptist Church (D). Display/hide their locations on the map
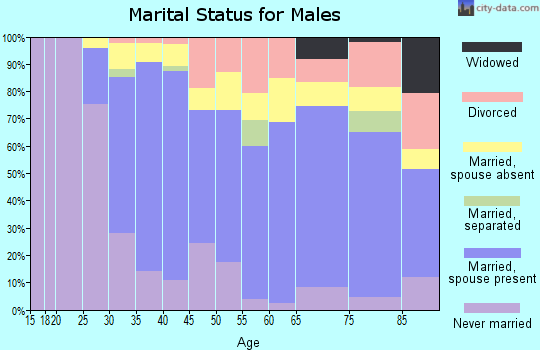
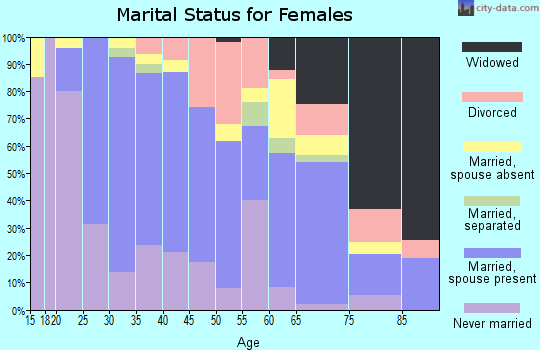
3,806 married couples with children.
630 single-parent households (117 men, 513 women).
35.4% of residents of 95054 zip code speak English at home.
9.1% of residents speak Spanish at home (67% very well, 11% well, 20% not well, 1% not at all).
18.3% of residents speak other Indo-European language at home (83% very well, 15% well, 2% not well).
35.6% of residents speak Asian or Pacific Island language at home (67% very well, 25% well, 6% not well, 2% not at all).
2.1% of residents speak other language at home (97% very well, 3% well).
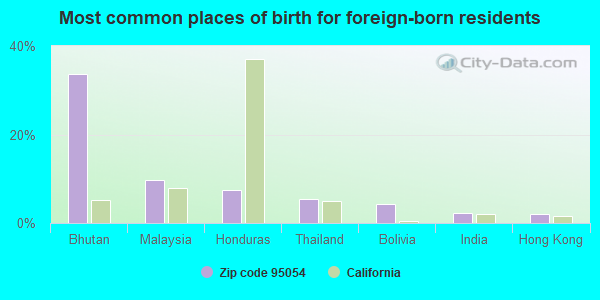
Foreign born population: 13,067 (53.9%) (44.5% of them are naturalized citizens)
Major facilities with environmental interests located in this zip code:
HEWLETT PACKARD COMPANY (3175 BOWERS AVENUE in SANTA CLARA, CA)
SUPERFUND (Superfund database) STATE MASTER (California - Hazardous Waste Tracking) - HAZARDOU WASTE PROGRAM CRITERIA AND HAZARDOUS AIR POLLUTANT INVENTORY (Inventory of air pollution sources) National Pollutant Discharge Elimination System NON-MAJOR (Tracking pollutant discharge elimination systems) - permit HAZARDOUS WASTE BIENNIAL REPORTER (Resource Conservation and Recovery Act (tracking hazardous waste)) Small Quantity Generators, between 100 kg and 1000 kg of hazardous waste/month (Resource Conservation and Recovery Act (tracking hazardous waste)) - notification Large Quantity Generators, more that 1000 kg of hazardous waste/month (Resource Conservation and Recovery Act (tracking hazardous waste)) - notification TRI REPORTER (Tracking of toxic chemicals releasing facilities) Business SIC classification: SEMICONDUCTORS AND RELATED DEVICES; ELECTRIC AND OTHER SERVICES COMBINED Business NAICS classification: SEMICONDUCTOR AND RELATED DEVICE MANUFACTURING. Organizations: AGILENT TECHNOLOGIES (CONTACT/OPERATOR)
, HEWLETT-PACKARD COMPANY (CONTACT/OWNER)
, HP INVESTORS LLC C/O TAUBE INVEST INC (CONTACT/OWNER)
Alternative names: AGILENT TECHNOLOGIES INC, HEWLETT PACKARD (AVANTEK)
NU METAL FINISHING INCORPORATED (2262 CALLE DEL MUNDO in SANTA CLARA, CA)
STATE MASTER (California - Hazardous Waste Tracking) - HAZARDOU WASTE PROGRAM ENFORCEMENT/COMPLIANCE ACTIVITY (Integrated Compliance Information System) CRITERIA AND HAZARDOUS AIR POLLUTANT INVENTORY (Inventory of air pollution sources) National Pollutant Discharge Elimination System NON-MAJOR (Tracking pollutant discharge elimination systems) - permit HAZARDOUS WASTE BIENNIAL REPORTER (Resource Conservation and Recovery Act (tracking hazardous waste)) Large Quantity Generators, more that 1000 kg of hazardous waste/month (Resource Conservation and Recovery Act (tracking hazardous waste)) - notification TRI REPORTER (Tracking of toxic chemicals releasing facilities) Business SIC and NAICS classification: ELECTROPLATING, PLATING, POLISHING, ANODIZING, AND COLORING Organizations: NU-METAL FINISHING INC (CONTACT/OPERATOR)
HONEYWELL INTERNATIONAL (3500 GARRETT DRIVE in SANTA CLARA, CA)
STATE MASTER (California - Hazardous Waste Tracking) - HAZARDOU WASTE PROGRAM COMPLIANCE ACTIVITY (Tracking inspections of insecticide, fungicide, and rodenticide, and toxic substances) CRITERIA AND HAZARDOUS AIR POLLUTANT INVENTORY (Inventory of air pollution sources) HAZARDOUS WASTE BIENNIAL REPORTER (Resource Conservation and Recovery Act (tracking hazardous waste)) Large Quantity Generators, more that 1000 kg of hazardous waste/month (Resource Conservation and Recovery Act (tracking hazardous waste)) Business SIC classification: INDUSTRIAL INORGANIC CHEMICALS Business NAICS classification: ALL OTHER MISCELLANEOUS CHEMICAL PRODUCT AND PREPARATION MANUFACTURING. Alternative names: ALLIED SIGNAL, ALLIEDSIGNAL AMM SANTA CLARA
APPLIED MATERIALS INCORPORATED (3050 BOWERS AVENUE in SANTA CLARA, CA)
SUPERFUND NPL (Superfund database) STATE MASTER (California - Hazardous Waste Tracking) - HAZARDOU WASTE PROGRAM CRITERIA AND HAZARDOUS AIR POLLUTANT INVENTORY (Inventory of air pollution sources) HAZARDOUS WASTE BIENNIAL REPORTER (Resource Conservation and Recovery Act (tracking hazardous waste)) Large Quantity Generators, more that 1000 kg of hazardous waste/month (Resource Conservation and Recovery Act (tracking hazardous waste)) TRI REPORTER (Tracking of toxic chemicals releasing facilities) Business SIC classification: SPECIAL INDUSTRY MACHINERY Business NAICS classification: OTHER ELECTRONIC COMPONENT MANUFACTURING. Organizations: APPLIED MATERIALS, INC. (CONTACT/OPERATOR)
APPLIED MATERIALS INCORPORATED (2727 AUGUSTINE DR in SANTA CLARA, CA)
STATE MASTER (California - Hazardous Waste Tracking) - HAZARDOU WASTE PROGRAM COMPLIANCE ACTIVITY (Tracking inspections of insecticide, fungicide, and rodenticide, and toxic substances) CRITERIA AND HAZARDOUS AIR POLLUTANT INVENTORY (Inventory of air pollution sources) HAZARDOUS WASTE BIENNIAL REPORTER (Resource Conservation and Recovery Act (tracking hazardous waste)) Large Quantity Generators, more that 1000 kg of hazardous waste/month (Resource Conservation and Recovery Act (tracking hazardous waste)) TRI REPORTER (Tracking of toxic chemicals releasing facilities) Business SIC classification: SPECIAL INDUSTRY MACHINERY Business NAICS classification: OTHER ELECTRONIC COMPONENT MANUFACTURING. Organizations: APPLIED MATERIALS, INC. (CONTACT/OPERATOR)
, EQUITY OFFICE DEPT. 13500-24472 (CONTACT/OWNER)
EVENSTAR INCORPORATED (809 ALDO AVE. SUITE #101 in SANTA CLARA, CA)
STATE MASTER (California - Hazardous Waste Tracking) - HAZARDOU WASTE PROGRAM CRITERIA AND HAZARDOUS AIR POLLUTANT INVENTORY (Inventory of air pollution sources) HAZARDOUS WASTE BIENNIAL REPORTER (Resource Conservation and Recovery Act (tracking hazardous waste)) Large Quantity Generators, more that 1000 kg of hazardous waste/month (Resource Conservation and Recovery Act (tracking hazardous waste)) TRI REPORTER (Tracking of toxic chemicals releasing facilities) Business SIC classification: PRINTED CIRCUIT BOARDS Business NAICS classification: BARE PRINTED CIRCUIT BOARD MANUFACTURING.
J AND B ENTERPRISES (1650 RUSSELL AVENUE in SANTA CLARA, CA)
STATE MASTER (California - Hazardous Waste Tracking) - HAZARDOU WASTE PROGRAM HAZARDOUS WASTE BIENNIAL REPORTER (Resource Conservation and Recovery Act (tracking hazardous waste)) Large Quantity Generators, more that 1000 kg of hazardous waste/month (Resource Conservation and Recovery Act (tracking hazardous waste)) - notification TRANSPORTER (Resource Conservation and Recovery Act (tracking hazardous waste)) - notification Business NAICS classification: PRIMARY SMELTING AND REFINING OF NONFERROUS METAL (EXCEPT COPPER AND ALUMINUM). Organizations: J & B ENTERPRISES (CONTACT/OPERATOR)
Alternative names: MILPITAS TRUCK REFINISHING
AMEX PLATING INCORPORATED (3333 WOODWARD AVE. in SANTA CLARA, CA)
STATE MASTER (California - Hazardous Waste Tracking) - HAZARDOU WASTE PROGRAM HAZARDOUS WASTE BIENNIAL REPORTER (Resource Conservation and Recovery Act (tracking hazardous waste)) Large Quantity Generators, more that 1000 kg of hazardous waste/month (Resource Conservation and Recovery Act (tracking hazardous waste)) TRI REPORTER (Tracking of toxic chemicals releasing facilities) Business SIC and NAICS classification: ELECTROPLATING, PLATING, POLISHING, ANODIZING, AND COLORING Organizations: SYLVIA D. RODRIGUEZ (CONTACT/OPERATOR)
HARBOR ELECTRONICS, INC (3021 KENNETH ST in SANTA CLARA, CA)
STATE MASTER (California - Hazardous Waste Tracking) - HAZARDOU WASTE PROGRAM HAZARDOUS WASTE BIENNIAL REPORTER (Resource Conservation and Recovery Act (tracking hazardous waste)) Large Quantity Generators, more that 1000 kg of hazardous waste/month (Resource Conservation and Recovery Act (tracking hazardous waste)) - notification TRI REPORTER (Tracking of toxic chemicals releasing facilities) Business SIC classification: PRINTED CIRCUIT BOARDS Business NAICS classification: BARE PRINTED CIRCUIT BOARD MANUFACTURING. Organizations: HARBOR ELECTRONICS INC (CONTACT/OPERATOR)
ELECTROLESS NICKEL PLATING (3145-3165 MOLINARO STREET in SANTA CLARA, CA)
STATE MASTER (California - Hazardous Waste Tracking) - HAZARDOU WASTE PROGRAM HAZARDOUS WASTE BIENNIAL REPORTER (Resource Conservation and Recovery Act (tracking hazardous waste)) Large Quantity Generators, more that 1000 kg of hazardous waste/month (Resource Conservation and Recovery Act (tracking hazardous waste)) - notification TRI REPORTER (Tracking of toxic chemicals releasing facilities) Business SIC classification: ELECTROPLATING, PLATING, POLISHING, ANODIZING, AND COLORING Business NAICS classification: IRON AND STEEL MILLS. Organizations: BRETT DAWSON (CONTACT/OPERATOR)
Alternative names: ELECTROLESS NICKEL SPECIALTIES, ENS TECHNOLOGY LLC
ITALIX COMPANY INCORPORATED (2232 CALLE DEL MUNDO in SANTA CLARA, CA)
STATE MASTER (California - Hazardous Waste Tracking) - HAZARDOU WASTE PROGRAM CRITERIA AND HAZARDOUS AIR POLLUTANT INVENTORY (Inventory of air pollution sources) HAZARDOUS WASTE BIENNIAL REPORTER (Resource Conservation and Recovery Act (tracking hazardous waste)) Large Quantity Generators, more that 1000 kg of hazardous waste/month (Resource Conservation and Recovery Act (tracking hazardous waste)) Business SIC and NAICS classification: ELECTROPLATING, PLATING, POLISHING, ANODIZING, AND COLORING Organizations: ITALIX COMPANY, INC. (CONTACT/OPERATOR)
, M2S ASSOCIATES LLC (CONTACT/OWNER)
JOHN NOFTZ APPLIED MATERIALS, INC. (3333 SCOTT BLVD in SANTA CLARA, CA) . Federal Facility
SUPERFUND (Superfund database) STATE MASTER (California - Hazardous Waste Tracking) - HAZARDOU WASTE PROGRAM Small Quantity Generators, between 100 kg and 1000 kg of hazardous waste/month (Resource Conservation and Recovery Act (tracking hazardous waste)) Small Quantity Generators, between 100 kg and 1000 kg of hazardous waste/month (Resource Conservation and Recovery Act (tracking hazardous waste)) - notification TRI REPORTER (Tracking of toxic chemicals releasing facilities) Business SIC classification: SEMICONDUCTORS AND RELATED DEVICES Business NAICS classification: SEMICONDUCTOR AND RELATED DEVICE MANUFACTURING. Alternative names: APPLIED MATERAILS, MAGNETIC PERIPHERALS INC., MAGNETICS PERIPHERALS INC
EXPRESSTECH, INC. (3475 VICTOR STREET, UNIT #C in SANTA CLARA, CA)
STATE MASTER (California - Hazardous Waste Tracking) - HAZARDOU WASTE PROGRAM HAZARDOUS WASTE BIENNIAL REPORTER (Resource Conservation and Recovery Act (tracking hazardous waste)) Large Quantity Generators, more that 1000 kg of hazardous waste/month (Resource Conservation and Recovery Act (tracking hazardous waste)) Business NAICS classification: ELECTROPLATING, PLATING, POLISHING, ANODIZING, AND COLORING.
Housing units lacking complete kitchen facilities: 0.6%
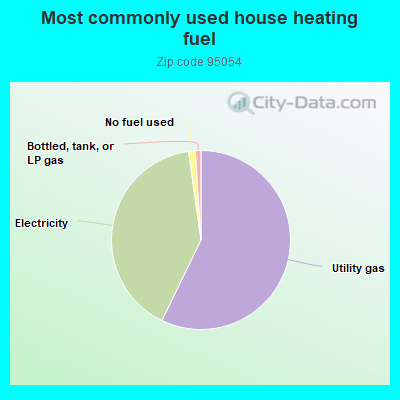
57.2%Utility gas
40.6%Electricity
1.2%No fuel used
1.0%Bottled, tank, or LP gas
Population in 1990: 10,370. Population change in the 1990s: +2,643 (+25.5%).
Place of birth for U.S.-born residents:
This state: 8,149
Northeast: 647
Midwest: 684
South: 768
West: 590
51% of the 95054 zip code residents lived in the same house 5 years ago. Out of people who lived in different houses, 57% lived in this county. Out of people who lived in different counties, 50% lived in California.
79% of the 95054 zip code residents lived in the same house 1 year ago. Out of people who lived in different houses, 49% moved from this county. Out of people who lived in different houses, 12% moved from different county within same state. Out of people who lived in different houses, 21% moved from different state. Out of people who lived in different houses, 19% moved from abroad.
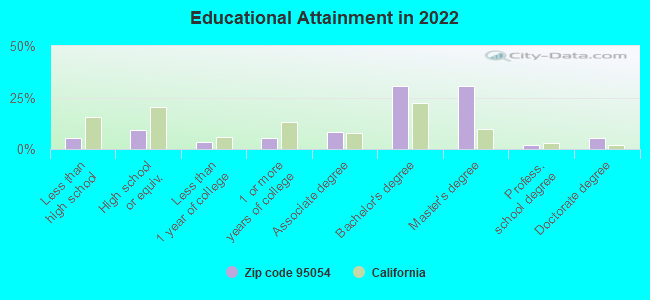
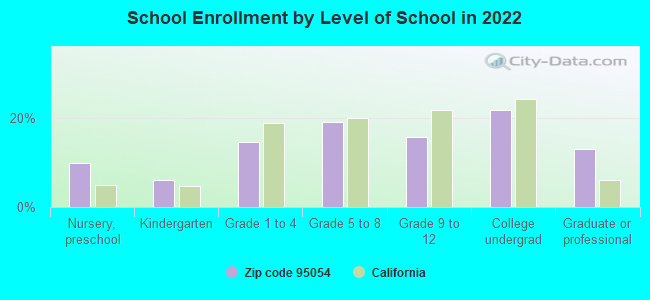
Private vs. public school enrollment:
Students in private schools in grades 1 to 8 (elementary and middle school): 500
Here:
26.5%
California:
10.5%
Students in private schools in grades 9 to 12 (high school): 143
Here:
16.7%
California:
8.5%
Students in private undergraduate colleges: 344
Here:
28.6%
California:
15.9%
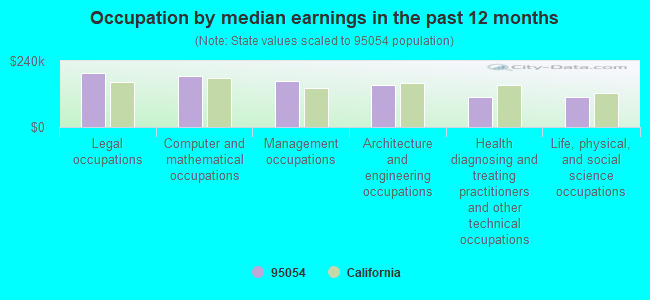
Occupation by median earnings in the past 12 months ($)
198,036Legal occupations
186,401Computer and mathematical occupations
165,729Management occupations
151,780Architecture and engineering occupations
109,481Health diagnosing and treating practitioners and other technical occupations
109,439Life, physical, and social science occupations
Companies with biggest federal contracts located in this zip code:
DELFIN SYSTEMS (3000 PATRICK HENRY DR in SANTA CLARA, CA) : $83,944,682 in 48 contractsfrom 1999 to 2006
Contracts for Invalid code: AC67, Defense Electronics and Communication Equipment -- Engineering Development (R&D), Communications Security Equipment and Components, Electrical and Electronic assemblies, Boards, Cards, and Associated Hardware, and moreby Army, Department of Defense Signed by year:2000: $14,279,323; 2001: $9,980,275; 2002: $361,996; 2003: $0; 2004: $1,994,796; 2005: $40,569,501; 2006: $16,596,507.
Biggest contracts:
$22,163,794 with Army for Invalid code: AC67. Signed on 2005-09-07. Completion date: 2008-06-11.
$17,278,652, same as above.Signed on 2006-06-30. Completion date: 2008-06-11.
$12,587,492, same as above.Signed on 2005-07-21. Completion date: 2008-06-11.
$6,000,000, same as above.Signed on 2001-06-06. Completion date: 2008-06-11.
BEYOND COM CORPORATION (3200 PATRICK HENRY DRIVE in SANTA CLARA, CA; small business) : $21,583,391 in 59 contractsfrom 1999 to 2003
Contracts for Information and Data Broadcasting or Data Distribution Services, ADP Software, ADP Components, ADP Support Equipment, and moreby Navy, Department of Defense, National Oceanic and Atmospheric Administration/Under Secretary for Oceans and Atmosphere, Army, and others Signed by year:2000: $9,744,376; 2001: $10,725,069; 2002: $885,168; 2003: $29,778; 2004: $0; 2005: $0; 2006: $0.
Biggest contracts:
$5,501,721 with Navy for Information and Data Broadcasting or Data Distribution Services. Signed on 2000-06-12. Completion date: 2001-06-11.
$5,301,778, same as above.Signed on 2001-06-12. Completion date: 2002-06-11.
$2,972,267 with Department of Defense for ADP Software. Signed on 2001-09-07. Completion date: 2002-09-10.
$2,375,283 with Navy for Information and Data Broadcasting or Data Distribution Services. Signed on 2000-09-08. Completion date: 2001-09-10.
SOLID STATE-FILTRONIC, INC (3251 OLCOTT STREET in SANTA CLARA, CA) : $21,549,009 in 83 contractsfrom 1999 to 2006
Contracts for Electronic Countermeasures, Counter-Countermeasures and Quick Reaction Capability Equipment, Miscellaneous Communication Equipment, Antennas, Waveguides, and Related Equipment, Amplifiers, and moreby Air Force, Navy, Defense Logistics Agency, Army, and others Signed by year:2000: $2,055,319; 2001: $1,023,250; 2002: $4,796,237; 2003: $3,354,476; 2004: $3,832,452; 2005: $4,980,196; 2006: $1,034,273.
Biggest contracts:
$1,955,084 with Air Force for Electronic Countermeasures, Counter-Countermeasures and Quick Reaction Capability Equipment. Signed on 2005-12-09. Completion date: 2007-10-08.
$1,679,923 with Air Force for Miscellaneous Communication Equipment. Signed on 2002-01-04. Completion date: 2002-12-31.
$1,294,634, same as above.Signed on 2002-12-05. Completion date: 2005-12-16.
$1,257,415 with Air Force for Electronic Countermeasures, Counter-Countermeasures and Quick Reaction Capability Equipment. Signed on 2004-03-05. Completion date: 2005-11-30.
SUN MICROSYSTEMS INC (4150 NETWORK CIRCLE in SANTA CLARA, CA; small business) : $19,039,127 in 243 contractsfrom 1999 to 2006
Contracts for ADP Support Equipment, ADPE System Configuration, Maintenance, Repair and Rebuilding of Equipment -- Automatic Data Processing Equipment (Including Firmware), Software, Supplies and Support Equipment, Systems Engineering Services, and moreby Federal Technology Service, Air Force, Small Business Administration, NASA, and others Signed by year:2000: $11,152,325; 2001: $2,732,555; 2002: $940,768; 2003: $2,500,305; 2004: $244,031; 2005: $113,196; 2006: $18,360.
Biggest contracts:
$1,181,000 with Federal Technology Service for ADP Support Equipment. Taking place in NC. Signed on 2000-09-15. Completion date: 2000-11-15.
$832,082 with Air Force for ADPE System Configuration. Signed on 2003-09-29. Completion date: 2003-10-30.
$604,000 with Small Business Administration for Maintenance, Repair and Rebuilding of Equipment -- Automatic Data Processing Equipment (Including Firmware), Software, Supplies and Support Equipment. Taking place in DC. Signed on 2000-05-15. Completion date: 2000-09-15.
$510,000 with Air Force for Systems Engineering Services. Taking place in NE. Signed on 1999-10-01. Completion date: 2000-09-30.
INTEVAC, INC (3560 BASSETT STREET in SANTA CLARA, CA; small business) : $10,073,574 in 37 contractsfrom 1999 to 2006
Contracts for Weapons -- Advanced Development (R&D), Defense Electronics and Communication Equipment -- Basic Research (R&D), Engineering -- Applied Research and Exploratory Development (R&D), Defense Electronics and Communication Equipment -- Management and Support (R&D), and moreby Air Force, Army, Navy, United States Coast Guard (disused code: now 7008), and others Signed by year:2000: $177,591; 2001: $405,162; 2002: $46,186; 2003: $2,910,411; 2004: $3,569,553; 2005: $1,902,815; 2006: $239,676.
Biggest contracts:
$2,023,000 with Air Force for Weapons -- Advanced Development (R&D). Signed on 2004-04-30. Completion date: 2007-05-21.
$1,250,000, same as above.Signed on 2003-06-02. Completion date: 2007-08-20.
$1,000,000, same as above.Signed on 2003-05-21. Completion date: 2007-08-20.
$1,000,000, same as above.Signed on 2005-02-15. Completion date: 2007-05-21.
XICOM TECHNOLOGY INC (3550 BASSETT ST in SANTA CLARA, CA; small business) : $8,433,984 in 66 contractsfrom 2001 to 2006
Contracts for Amplifiers, Defense Electronics and Communication Equipment -- Basic Research (R&D), Electrical and Electronic Properties Measuring and Testing Instruments, ADP Input/Output and Storage Devices, and moreby Navy, Army, Air Force Signed by year:2000: $0; 2001: $675,618; 2002: $364,966; 2003: $1,303,123; 2004: $1,458,452; 2005: $2,918,819; 2006: $1,713,006.
Biggest contracts:
$1,886,000 with Navy for Amplifiers. Signed on 2005-03-18. Completion date: 2006-02-08.
$1,280,334 with Army for Defense Electronics and Communication Equipment -- Basic Research (R&D). Signed on 2006-05-26. Completion date: 2007-09-30.
$915,408 with Navy for Amplifiers. Signed on 2003-10-29. Completion date: 2004-03-17.
$744,660, same as above.Signed on 2004-04-08. Completion date: 2004-08-08.
NETWORK ASSOCIATES INC (3965 FREEDOM CIRCLE in SANTA CLARA, CA; small business) : $8,044,702 in 25 contractsfrom 2000 to 2005
Contracts for Technology Sharing/Utilization Services, ADP Software, Other Defense -- Applied Research and Exploratory Development (R&D), Food Cooking, Baking, and Serving Equipment, and moreby Department of Defense, U.S. Army Corps of Engineers - civil program financing only, Air Force, Army, and others Signed by year:2000: $539,105; 2001: $363,734; 2002: $39,647; 2003: $3,500,000; 2004: $3,542,869; 2005: $59,347; 2006: $0.
Biggest contracts:
$3,500,000 with Department of Defense for Technology Sharing/Utilization Services. Taking place in VA. Signed on 2003-09-26. Completion date: 2004-09-30.
$2,082,757, same as above.Signed on 2004-11-12. Completion date: 2004-09-30.
$1,417,243, same as above.Signed on 2004-12-09. Completion date: 2004-09-30.
$261,200 with U.S. Army Corps of Engineers - civil program financing only for ADP Software. Taking place in OR. Signed on 2000-08-10. Completion date: 2001-09-30.
BIRTCHER ANDERSON INVESTORS, LLC ( in Santa Ana, CA; small business) : $5,075,820 in 95 contractsfrom 1999 to 2006
Contracts for Lease or Rental of Facilities -- Office Buildings by Public Buildings Service Signed by year:2000: $460,000; 2001: $462,000; 2002: $796,244; 2003: $1,571,494; 2004: $266,445; 2005: $833,333; 2006: $571,304.
Biggest contracts:
$161,311 with Public Buildings Service for Lease or Rental of Facilities -- Office Buildings. Signed on 2003-06-15. Completion date: 2003-06-15.
$161,311, same as above.Signed on 2003-09-15. Completion date: 2003-09-15.
$160,264, same as above.Signed on 2003-03-15. Completion date: 2003-03-15.
$160,264, same as above.Signed on 2003-09-15. Completion date: 2003-09-15.
SUN MICROSYSTEMS INC (4150 NETWORK CIRCLE in SANTA CLARA, CA) : $4,851,970 in 18 contractsfrom 2003 to 2006
Contracts for ADPE System Configuration, Radar Equipment, Except Airborne, ADP Software, Systems Engineering Services, and moreby Air Force, U.S. Army Corps of Engineers - civil program financing only, Army, Navy, and others Signed by year:2000: $0; 2001: $0; 2002: $0; 2003: $24,230; 2004: $4,808,008; 2005: $19,732; 2006: $0.
Biggest contracts:
$2,700,330 with Air Force for ADPE System Configuration. Signed on 2004-03-10. Completion date: 2004-04-09.
$595,994, same as above.Signed on 2004-02-03. Completion date: 2004-02-06.
$387,280, same as above.Signed on 2004-09-21. Completion date: 2004-10-25.
$353,887, same as above.Signed on 2004-09-30. Completion date: 2004-10-31.
APPLIED MATERIALS INC (3050 BOWERS AVE in SANTA CLARA, CA) : $4,601,514 in 8 contractsfrom 2000 to 2005
Contracts for Pressure, Temperature, and Humidity Measuring and Controlling Instruments, Maintenance, Repair and Rebuilding of Equipment -- Miscellaneous, Maintenance, Repair and Rebuilding of Equipment -- Instruments and Laboratory Equipment, Combination and Miscellaneous Instruments by Navy Signed by year:2000: $2,320,357; 2001: $526,457; 2002: $689,089; 2003: $682,057; 2004: $575,331; 2005: -$191,777; 2006: $0.
Biggest contracts:
$1,300,000 with Navy for Pressure, Temperature, and Humidity Measuring and Controlling Instruments. Signed on 2000-08-22. Completion date: 2000-12-02.
$689,089 with Navy for Maintenance, Repair and Rebuilding of Equipment -- Miscellaneous. Signed on 2002-04-01. Completion date: 2003-03-31.
$682,057 with Navy for Maintenance, Repair and Rebuilding of Equipment -- Instruments and Laboratory Equipment. Signed on 2003-04-01. Completion date: 2004-03-31.
$575,331, same as above.Signed on 2004-04-01. Completion date: 2005-03-31.
Top industries in this zip code by the number of employees in 2005:
Administrative and Support and Waste Management and Remediation Services: Temporary Help Services (250-499: 2, 100-249: 5, 50-99: 3, 20-49: 3, 10-19: 1, 1-4: 3)
Arts, Entertainment, and Recreation: Amusement and Theme Parks (over 1000: 1)
Professional, Scientific, and Technical Services: Research and Development in the Physical, Engineering, and Life Sciences (250-499: 1, 100-249: 3, 50-99: 2, 20-49: 10, 10-19: 6, 5-9: 5, 1-4: 11)
People in group quarters in 2010:
219 people in college/university student housing
189 people in nursing facilities/skilled-nursing facilities
18 people in group homes intended for adults
10 people in other noninstitutional facilities
5 people in group homes for juveniles (non-correctional)
5 people in residential treatment centers for adults
5 people in workers' group living quarters and job corps centers
People in group quarters in 2000:
191 people in nursing homes
143 people in college dormitories (includes college quarters off campus)
15 people in homes for the mentally ill
6 people in religious group quarters
Fatal accident statistics in 2014:
Fatal accident count: 3
Vehicles involved in fatal accidents: 4
Fatal accidents caused by drunken drivers: 2
Fatalities: 3
Persons involved in fatal accidents: 7
Pedestrians involved in fatal accidents: 1
Fatal accident statistics in 2013:
Fatal accident count: 1
Vehicles involved in fatal accidents: 3
Fatal accidents caused by drunken drivers: 0
Fatalities: 1
Persons involved in fatal accidents: 4
Pedestrians involved in fatal accidents: 0
Home Mortgage Disclosure Act Aggregated Statistics For Year 2009 (Based on 6 full and 2 partial tracts)
A) FHA, FSA/RHS & VA Home Purchase Loans
B) Conventional Home Purchase Loans
C) Refinancings
D) Home Improvement Loans
E) Loans on Dwellings For 5+ Families
F) Non-occupant Loans on < 5 Family Dwellings (A B C & D)
Number
Average Value
Number
Average Value
Number
Average Value
Number
Average Value
Number
Average Value
Number
Average Value
LOANS ORIGINATED
73
$496,281
378
$416,307
1,460
$403,553
21
$339,527
1
$1,086,720
65
$285,944
APPLICATIONS APPROVED, NOT ACCEPTED
7
$539,143
53
$398,258
236
$419,918
0
$0
0
$0
14
$390,046
APPLICATIONS DENIED
15
$411,167
86
$436,640
429
$464,129
8
$344,351
0
$0
39
$365,689
APPLICATIONS WITHDRAWN
14
$512,252
51
$437,934
276
$444,936
2
$109,890
0
$0
7
$336,219
FILES CLOSED FOR INCOMPLETENESS
4
$468,695
6
$429,308
82
$401,815
2
$414,080
0
$0
5
$156,364
Aggregated Statistics For Year 2008 (Based on 6 full and 2 partial tracts)
A) FHA, FSA/RHS & VA Home Purchase Loans
B) Conventional Home Purchase Loans
C) Refinancings
D) Home Improvement Loans
E) Loans on Dwellings For 5+ Families
F) Non-occupant Loans on < 5 Family Dwellings (A B C & D)
G) Loans On Manufactured Home Dwelling (A B C & D)
Number
Average Value
Number
Average Value
Number
Average Value
Number
Average Value
Number
Average Value
Number
Average Value
Number
Average Value
LOANS ORIGINATED
19
$561,992
410
$435,509
800
$430,490
26
$262,058
3
$409,743
53
$366,544
3
$86,797
APPLICATIONS APPROVED, NOT ACCEPTED
2
$491,510
74
$528,631
211
$473,294
10
$278,745
0
$0
21
$368,706
0
$0
APPLICATIONS DENIED
14
$441,716
108
$502,111
376
$454,638
22
$322,845
0
$0
21
$421,089
2
$59,960
APPLICATIONS WITHDRAWN
5
$553,836
76
$435,074
227
$456,783
18
$184,959
0
$0
25
$293,369
0
$0
FILES CLOSED FOR INCOMPLETENESS
2
$439,900
20
$523,138
60
$476,258
9
$251,852
0
$0
6
$445,358
0
$0
Aggregated Statistics For Year 2007 (Based on 6 full and 2 partial tracts)
B) Conventional Home Purchase Loans
C) Refinancings
D) Home Improvement Loans
E) Loans on Dwellings For 5+ Families
F) Non-occupant Loans on < 5 Family Dwellings (A B C & D)
G) Loans On Manufactured Home Dwelling (A B C & D)
Number
Average Value
Number
Average Value
Number
Average Value
Number
Average Value
Number
Average Value
Number
Average Value
LOANS ORIGINATED
1,097
$430,640
1,085
$451,112
62
$363,045
13
$2,086,556
120
$451,191
2
$81,425
APPLICATIONS APPROVED, NOT ACCEPTED
296
$438,593
294
$421,622
27
$296,891
0
$0
24
$463,944
7
$100,640
APPLICATIONS DENIED
226
$425,851
472
$465,829
37
$229,498
1
$310,680
50
$435,845
4
$193,330
APPLICATIONS WITHDRAWN
102
$519,165
175
$434,367
11
$304,870
0
$0
29
$587,779
0
$0
FILES CLOSED FOR INCOMPLETENESS
28
$500,543
98
$454,588
13
$330,215
0
$0
7
$463,986
0
$0
Aggregated Statistics For Year 2006 (Based on 6 full and 2 partial tracts)
B) Conventional Home Purchase Loans
C) Refinancings
D) Home Improvement Loans
E) Loans on Dwellings For 5+ Families
F) Non-occupant Loans on < 5 Family Dwellings (A B C & D)
G) Loans On Manufactured Home Dwelling (A B C & D)
Number
Average Value
Number
Average Value
Number
Average Value
Number
Average Value
Number
Average Value
Number
Average Value
LOANS ORIGINATED
1,362
$434,379
1,020
$436,995
115
$317,697
11
$876,547
156
$415,016
4
$104,428
APPLICATIONS APPROVED, NOT ACCEPTED
342
$427,922
240
$399,722
34
$280,121
0
$0
43
$422,440
4
$120,648
APPLICATIONS DENIED
365
$447,390
445
$421,102
39
$240,005
0
$0
47
$465,627
4
$82,530
APPLICATIONS WITHDRAWN
215
$429,327
264
$404,131
19
$317,341
0
$0
26
$401,289
1
$175,600
FILES CLOSED FOR INCOMPLETENESS
33
$421,122
69
$483,644
1
$307,310
0
$0
6
$383,483
0
$0
Aggregated Statistics For Year 2005 (Based on 6 full and 2 partial tracts)
A) FHA, FSA/RHS & VA Home Purchase Loans
B) Conventional Home Purchase Loans
C) Refinancings
D) Home Improvement Loans
E) Loans on Dwellings For 5+ Families
F) Non-occupant Loans on < 5 Family Dwellings (A B C & D)
G) Loans On Manufactured Home Dwelling (A B C & D)
Number
Average Value
Number
Average Value
Number
Average Value
Number
Average Value
Number
Average Value
Number
Average Value
Number
Average Value
LOANS ORIGINATED
2
$74,925
2,097
$429,766
1,177
$423,047
120
$352,324
7
$5,982,514
303
$409,527
0
$0
APPLICATIONS APPROVED, NOT ACCEPTED
0
$0
524
$408,597
202
$425,654
16
$207,763
0
$0
42
$299,452
7
$76,013
APPLICATIONS DENIED
0
$0
577
$419,196
520
$406,050
48
$302,204
2
$1,141,425
100
$420,371
9
$131,234
APPLICATIONS WITHDRAWN
0
$0
412
$456,224
278
$423,178
26
$389,119
0
$0
41
$420,065
2
$33,760
FILES CLOSED FOR INCOMPLETENESS
0
$0
80
$432,579
110
$412,846
7
$276,053
0
$0
19
$345,293
0
$0
Aggregated Statistics For Year 2004 (Based on 6 full and 2 partial tracts)
A) FHA, FSA/RHS & VA Home Purchase Loans
B) Conventional Home Purchase Loans
C) Refinancings
D) Home Improvement Loans
E) Loans on Dwellings For 5+ Families
F) Non-occupant Loans on < 5 Family Dwellings (A B C & D)
G) Loans On Manufactured Home Dwelling (A B C & D)
Number
Average Value
Number
Average Value
Number
Average Value
Number
Average Value
Number
Average Value
Number
Average Value
Number
Average Value
LOANS ORIGINATED
1
$137,780
1,245
$430,235
1,394
$367,790
38
$253,174
7
$648,817
182
$371,046
1
$73,620
APPLICATIONS APPROVED, NOT ACCEPTED
0
$0
329
$424,333
299
$349,398
13
$143,883
0
$0
33
$351,285
6
$125,482
APPLICATIONS DENIED
3
$401,890
282
$408,827
461
$382,632
31
$250,714
1
$456,570
80
$459,284
3
$43,563
APPLICATIONS WITHDRAWN
0
$0
362
$415,609
302
$348,303
11
$239,563
0
$0
25
$342,216
0
$0
FILES CLOSED FOR INCOMPLETENESS
0
$0
41
$400,510
95
$394,052
0
$0
0
$0
15
$386,577
0
$0
Aggregated Statistics For Year 2003 (Based on 6 full and 2 partial tracts)
B) Conventional Home Purchase Loans
C) Refinancings
D) Home Improvement Loans
E) Loans on Dwellings For 5+ Families
F) Non-occupant Loans on < 5 Family Dwellings (A B C & D)
Number
Average Value
Number
Average Value
Number
Average Value
Number
Average Value
Number
Average Value
LOANS ORIGINATED
1,218
$354,287
2,397
$294,995
15
$82,272
13
$1,679,774
226
$281,645
APPLICATIONS APPROVED, NOT ACCEPTED
221
$371,907
503
$309,072
14
$76,659
1
$3,795,750
45
$315,658
APPLICATIONS DENIED
215
$395,611
528
$314,034
22
$32,110
1
$455,900
61
$284,314
APPLICATIONS WITHDRAWN
222
$357,937
459
$296,279
14
$27,704
0
$0
25
$220,667
FILES CLOSED FOR INCOMPLETENESS
49
$379,920
141
$340,655
1
$101,310
0
$0
11
$270,231
Aggregated Statistics For Year 2002 (Based on 4 full and 2 partial tracts)
A) FHA, FSA/RHS & VA Home Purchase Loans
B) Conventional Home Purchase Loans
C) Refinancings
D) Home Improvement Loans
E) Loans on Dwellings For 5+ Families
F) Non-occupant Loans on < 5 Family Dwellings (A B C & D)
Number
Average Value
Number
Average Value
Number
Average Value
Number
Average Value
Number
Average Value
Number
Average Value
LOANS ORIGINATED
0
$0
674
$319,729
1,413
$288,738
19
$61,963
5
$871,898
132
$266,846
APPLICATIONS APPROVED, NOT ACCEPTED
2
$116,885
146
$320,839
250
$326,256
9
$155,236
0
$0
11
$212,161
APPLICATIONS DENIED
0
$0
141
$300,940
204
$323,715
19
$128,244
3
$565,380
23
$272,893
APPLICATIONS WITHDRAWN
0
$0
114
$356,187
280
$282,480
6
$67,755
0
$0
17
$217,214
FILES CLOSED FOR INCOMPLETENESS
0
$0
38
$351,830
70
$322,036
0
$0
0
$0
5
$205,756
Aggregated Statistics For Year 2001 (Based on 4 full and 2 partial tracts)
A) FHA, FSA/RHS & VA Home Purchase Loans
B) Conventional Home Purchase Loans
C) Refinancings
D) Home Improvement Loans
E) Loans on Dwellings For 5+ Families
F) Non-occupant Loans on < 5 Family Dwellings (A B C & D)
Number
Average Value
Number
Average Value
Number
Average Value
Number
Average Value
Number
Average Value
Number
Average Value
LOANS ORIGINATED
1
$147,910
206
$301,949
962
$284,063
44
$57,421
5
$767,698
79
$253,039
APPLICATIONS APPROVED, NOT ACCEPTED
0
$0
43
$256,640
172
$298,850
9
$58,037
1
$445,760
11
$247,314
APPLICATIONS DENIED
0
$0
47
$293,893
257
$316,032
26
$74,667
0
$0
28
$275,520
APPLICATIONS WITHDRAWN
0
$0
56
$262,692
171
$287,896
17
$38,272
1
$491,690
5
$250,258
FILES CLOSED FOR INCOMPLETENESS
0
$0
2
$298,895
68
$289,100
4
$63,552
1
$528,160
10
$251,626
Aggregated Statistics For Year 2000 (Based on 4 full and 2 partial tracts)
A) FHA, FSA/RHS & VA Home Purchase Loans
B) Conventional Home Purchase Loans
C) Refinancings
D) Home Improvement Loans
E) Loans on Dwellings For 5+ Families
F) Non-occupant Loans on < 5 Family Dwellings (A B C & D)
Number
Average Value
Number
Average Value
Number
Average Value
Number
Average Value
Number
Average Value
Number
Average Value
LOANS ORIGINATED
0
$0
302
$272,830
218
$226,196
29
$45,472
8
$597,092
50
$279,575
APPLICATIONS APPROVED, NOT ACCEPTED
0
$0
48
$270,429
44
$240,185
11
$89,558
0
$0
4
$307,830
APPLICATIONS DENIED
2
$63,550
40
$231,620
91
$194,208
26
$41,148
0
$0
9
$185,283
APPLICATIONS WITHDRAWN
0
$0
39
$196,772
97
$148,452
12
$97,645
0
$0
6
$184,037
FILES CLOSED FOR INCOMPLETENESS
0
$0
17
$304,469
66
$251,635
5
$55,648
1
$6,747,250
3
$243,627
Aggregated Statistics For Year 1999 (Based on 1 full and 4 partial tracts)
A) FHA, FSA/RHS & VA Home Purchase Loans
B) Conventional Home Purchase Loans
C) Refinancings
D) Home Improvement Loans
E) Loans on Dwellings For 5+ Families
F) Non-occupant Loans on < 5 Family Dwellings (A B C & D)


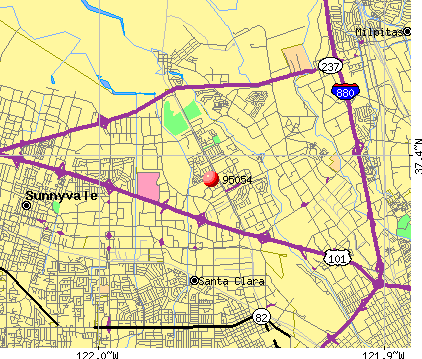 Nearest zip codes: 95134, 95050, 95051, 95053, 94085, 94089.