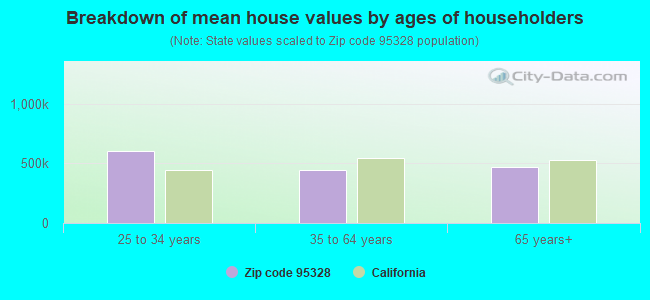
Estimated median house/condo value in 2022: $443,135
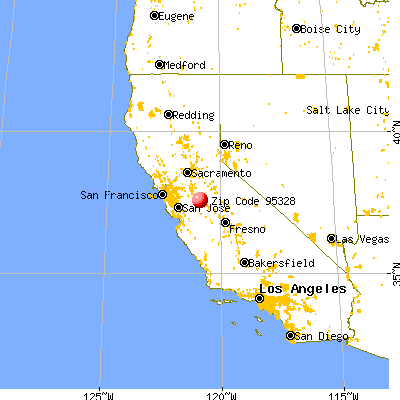
95328:
$443,135
California:
$715,900
According to our research of California and other state lists, there were 4 registered sex offenders living in 95328 zip code as of April 19, 2024. The ratio of all residents to sex offenders in zip code 95328 is 1,525 to 1. The ratio of registered sex offenders to all residents in this zip code is lower than the state average.
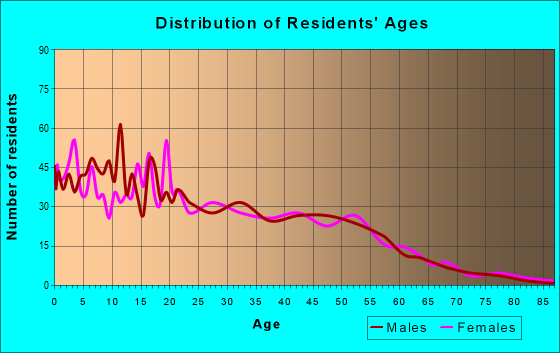
Median resident age:
This zip code:
31.7 years
California median age:
37.9 years
Average household size:
This zip code:
3.4 people
California:
2.8 people
Averages for the 2020 tax year for zip code 95328, filed in 2021:
Average Adjusted Gross Income (AGI) in 2020: $45,014 (Individual Income Tax Returns)
Here:
$45,014
State:
$95,910
Salary/wage: $42,972 (reported on 85.6% of returns)
Here:
$42,972
State:
$77,331
(% of AGI for various income ranges: 1260.2% for AGIs below $25k, 4029.3% for AGIs $25k-50k, 7503.9% for AGIs $50k-75k, 11472.5% for AGIs $75k-100k, 22982.2% for AGIs $100k-200k)
Taxable interest for individuals: $114 (reported on 22.2% of returns)
This zip code:
$114
California:
$2,294
(% of AGI for various income ranges: 0.4% for AGIs below $25k, 1.4% for AGIs $25k-50k, 6.1% for AGIs $50k-75k, 6.7% for AGIs $75k-100k, 24.4% for AGIs $100k-200k)
Ordinary dividends: $75 (reported on 2.1% of returns)
Here:
$75
State:
$10,949
(% of AGI for various income ranges: 1.7% for AGIs $50k-75k)
Net capital gain/loss in AGI: +$3,243 (reported on 3.6% of returns)
Here:
+$3,243
State:
+$49,306
(% of AGI for various income ranges: 4.2% for AGIs $25k-50k, 7.2% for AGIs $50k-75k, 217.8% for AGIs $100k-200k)
Profit/loss from business: +$11,280 (reported on 15.5% of returns)
Here:
+$11,280
State:
+$15,671
(% of AGI for various income ranges: 145.6% for AGIs below $25k, 366.5% for AGIs $25k-50k, 383.3% for AGIs $50k-75k, 386.7% for AGIs $75k-100k)
Taxable individual retirement arrangement distribution: $11,300 (reported on 1.0% of returns)
95328:
$11,300
California:
$23,505
(% of AGI for various income ranges: 47.1% for AGIs below $25k)
Total itemized deductions: $28,550 (reported on 6.2% of returns)
Here:
$28,550
State:
$39,517
(% of AGI for various income ranges: 114.6% for AGIs below $25k, 431.1% for AGIs $50k-75k, 669.2% for AGIs $75k-100k, 1441.1% for AGIs $100k-200k)
Charity contributions: $4,756 (reported on 4.6% of returns)
Here:
$4,756
State:
$12,598
(% of AGI for various income ranges: 133.3% for AGIs $50k-75k, 208.9% for AGIs $100k-200k)
Taxes paid: $6,762 (reported on 6.7% of returns)
95328:
$6,762
State:
$8,807
(% of AGI for various income ranges: 25.4% for AGIs below $25k, 102.2% for AGIs $50k-75k, 160.0% for AGIs $75k-100k, 423.3% for AGIs $100k-200k)
Earned income credit: $2,452 (reported on 23.7% of returns)
Here:
$2,452
State:
$2,074
(% of AGI for various income ranges: 124.0% for AGIs below $25k, 124.0% for AGIs $25k-50k)
Percentage of individuals using paid preparers for their 2020 taxes: 93.3%
Here:
93%
State:
92%
(% for various income ranges: 92.9% for AGIs below $25k, 95.0% for AGIs $25k-50k, 96.3% for AGIs $50k-75k, 89.5% for AGIs $75k-100k, 88.9% for AGIs $100k-200k)
Averages for the 2012 tax year for zip code 95328, filed in 2013:
Average Adjusted Gross Income (AGI) in 2012: $33,501 (Individual Income Tax Returns)
Here:
$33,501
State:
$72,726
Salary/wage: $31,377 (reported on 90.6% of returns)
Here:
$31,377
State:
$59,079
(% of AGI for various income ranges: 77.2% for AGIs below $25k, 86.2% for AGIs $25k-50k, 86.4% for AGIs $50k-75k, 90.0% for AGIs $75k-100k, 85.0% for AGIs $100k-200k)
Taxable interest for individuals: $104 (reported on 20.5% of returns)
This zip code:
$104
California:
$2,146
(% of AGI for various income ranges: )
Ordinary dividends: $100 (reported on 1.6% of returns)
Here:
$100
State:
$9,308
Profit/loss from business: +$9,384 (reported on 15.0% of returns)
Here:
+$9,384
State:
+$17,064
(% of AGI for various income ranges: 11.2% for AGIs below $25k, 4.8% for AGIs $25k-50k, 1.9% for AGIs $50k-75k)
Taxable individual retirement arrangement distribution: $6,100 (reported on 1.6% of returns)
95328:
$6,100
California:
$19,557
Total itemized deductions: $17,223 (28% of AGI, reported on 20.5% of returns)
Here:
$17,223
State:
$34,004
Here:
27.5% of AGI
State:
22.7% of AGI
(% of AGI for various income ranges: 4.5% for AGIs below $25k, 8.2% for AGIs $25k-50k, 12.5% for AGIs $50k-75k, 17.3% for AGIs $75k-100k, 15.2% for AGIs $100k-200k)
Charity contributions: $1,837 (reported on 15.0% of returns)
Here:
$1,837
State:
$4,659
(% of AGI for various income ranges: 0.7% for AGIs $25k-50k, 0.8% for AGIs $50k-75k, 1.5% for AGIs $75k-100k, 1.9% for AGIs $100k-200k)
Taxes paid: $4,496 (reported on 19.7% of returns)
95328:
$4,496
State:
$14,448
(% of AGI for various income ranges: 0.7% for AGIs below $25k, 1.7% for AGIs $25k-50k, 3.4% for AGIs $50k-75k, 4.1% for AGIs $75k-100k, 5.3% for AGIs $100k-200k)
Earned income credit: $2,679 (reported on 37.8% of returns)
Here:
$2,679
State:
$2,286
(% of AGI for various income ranges: 11.3% for AGIs below $25k, 2.4% for AGIs $25k-50k)
Percentage of individuals using paid preparers for their 2012 taxes: 70.1%
Here:
70%
State:
64%
(% for various income ranges: 66.7% for AGIs below $25k, 73.0% for AGIs $25k-50k, 75.0% for AGIs $50k-75k, 71.4% for AGIs $75k-100k, 75.0% for AGIs $100k-200k)
Averages for the 2004 tax year for zip code 95328, filed in 2005:
Average Adjusted Gross Income (AGI) in 2004: $29,238 (Individual Income Tax Returns)
Here:
$29,238
State:
$58,600
Salary/wage: $27,001 (reported on 93.2% of returns)
Here:
$27,001
State:
$49,455
(% of AGI for various income ranges: 96.4% for AGIs below $10k, 83.3% for AGIs $10k-25k, 90.7% for AGIs $25k-50k, 89.8% for AGIs $50k-75k, 124.9% for AGIs $75k-100k)
Taxable interest for individuals: $246 (reported on 25.8% of returns)
This zip code:
$246
California:
$2,365
(% of AGI for various income ranges: 0.2% for AGIs below $10k, 0.4% for AGIs $10k-25k, 0.2% for AGIs $25k-50k, 0.2% for AGIs $50k-75k, 0.5% for AGIs $75k-100k)
Taxable dividends: $312 (reported on 3.2% of returns)
Here:
$312
State:
$4,746
Net capital gain/loss: +$5,893 (reported on 2.8% of returns)
Here:
+$5,893
State:
+$23,418
Profit/loss from business: +$9,125 (reported on 11.3% of returns)
Here:
+$9,125
State:
+$16,826
(% of AGI for various income ranges: 6.6% for AGIs below $10k, 7.4% for AGIs $10k-25k, 4.3% for AGIs $25k-50k, 0.6% for AGIs $50k-75k)
Total itemized deductions: $16,260 (31% of AGI, reported on 22.8% of returns)
Here:
$16,260
State:
$28,113
Here:
31.1% of AGI
State:
25.3% of AGI
(% of AGI for various income ranges: 5.6% for AGIs $10k-25k, 12.9% for AGIs $25k-50k, 18.6% for AGIs $50k-75k, 28.8% for AGIs $75k-100k)
Charity contributions deductions: $1,628 (3% of AGI, reported on 19.2% of returns)
Here:
$1,628
State:
$3,923
Here:
3.1% of AGI
State:
3.3% of AGI
(% of AGI for various income ranges: 0.4% for AGIs $10k-25k, 0.9% for AGIs $25k-50k, 1.7% for AGIs $50k-75k, 3.4% for AGIs $75k-100k)
Total tax: $2,884 (reported on 57.9% of returns)
95328:
$2,884
State:
$10,761
(% of AGI for various income ranges: 2.4% for AGIs below $10k, 3.5% for AGIs $10k-25k, 4.3% for AGIs $25k-50k, 6.4% for AGIs $50k-75k, 8.7% for AGIs $75k-100k, 17.0% for AGIs over 100k)
Earned income credit: $1,860 (reported on 32.4% of returns)
Here:
$1,860
State:
$1,763
Percentage of individuals using paid preparers for their 2004 taxes: 71.5%
Here:
72%
State:
66%
(% for various income ranges: 61.7% for AGIs below $10k, 72.1% for AGIs $10k-25k, 74.1% for AGIs $25k-50k, 78.0% for AGIs $50k-75k, 71.4% for AGIs $75k-100k, 100.0% for AGIs over 100k)
Household received Food Stamps/SNAP in the past 12 months: 169 Household did not receive Food Stamps/SNAP in the past 12 months: 958
Women who had a birth in the past 12 months: 15 (15 now married, 0 unmarried) Women who did not have a birth in the past 12 months: 976 (438 now married, 536 unmarried)
Housing units in zip code 95328 with a mortgage: 355 Median monthly owner costs for units with a mortgage: $1,480 Median monthly owner costs for units without a mortgage: $635
Residents with income below the poverty level in 2022:
This zip code:
32.9%
Whole state:
12.2%
Residents with income below 50% of the poverty level in 2022:
This zip code:
22.8%
Whole state:
6.2%
Median number of rooms in houses and condos:
Here:
5.4
State:
6.0
Median number of rooms in apartments:
Here:
5.1
State:
3.9
Notable locations in this zip code not listed on our city pages
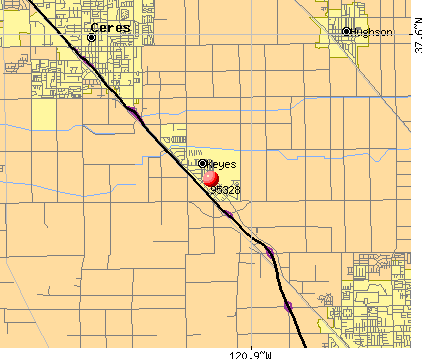
Notable locations in zip code 95328: Keyes Branch Stanislaus County Free Library (A), Keyes Fire Protection District (B). Display/hide their locations on the map
Size of family households: 230 2-persons, 251 3-persons, 139 4-persons, 94 5-persons, 222 6-persons, 12 7-or-more-persons
Size of nonfamily households: 140 1-person, 22 4-persons
1,055 married couples with children.
180 single-parent households (180 women).
33.4% of residents of 95328 zip code speak English at home.
62.2% of residents speak Spanish at home (59% very well, 18% well, 17% not well, 6% not at all).
1.7% of residents speak other Indo-European language at home (100% well).
1.6% of residents speak Asian or Pacific Island language at home (100% very well).
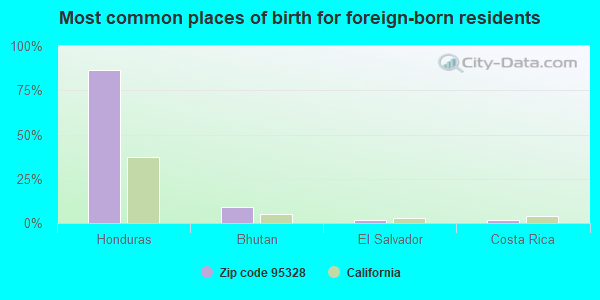
Foreign born population: 1,057 (27.6%) (42.2% of them are naturalized citizens)
This zip code:
27.6%
Whole state:
26.7%
87%Honduras
9%Bhutan
2%El Salvador
2%Costa Rica
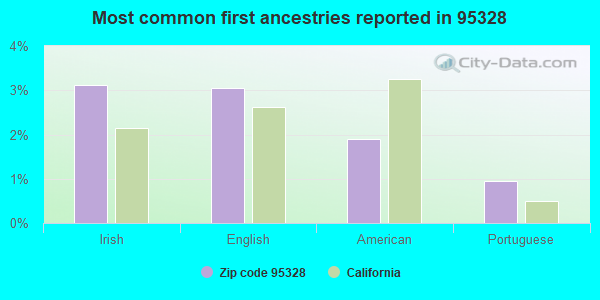
3%Irish
3%English
2%American
1%Portuguese
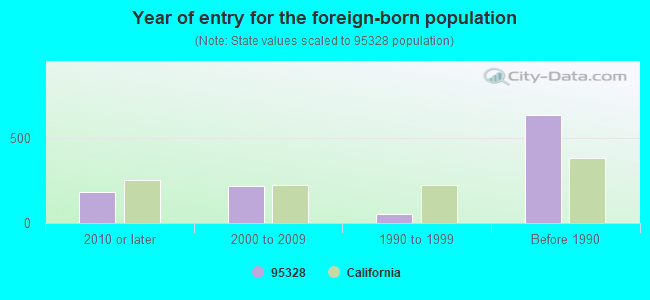
Year of entry for the foreign-born population
1832010 or later
2212000 to 2009
511990 to 1999
637Before 1990
Facilities with environmental interests located in this zip code:
KEYES ELEMENTARY (5680 7TH ST. in KEYES, CA)
(National Center for Education Statistics) - STATE ID-6052591 Organizations: KEYES UNION ELEMENTARY (SCHOOL DISTRICT)
KEYS TO LEARNING CHARTER (5680 SEVENTH ST in KEYES, CA)
(National Center for Education Statistics) - STATE ID-6113286 Organizations: KEYES UNION ELEMENTARY (SCHOOL DISTRICT)
BARBARA SPRATLING MIDDLE (5277 WASHINGTON ROAD in KEYES, CA)
(National Center for Education Statistics) - STATE ID-6119002 Organizations: KEYES UNION ELEMENTARY (SCHOOL DISTRICT)
KEYES BOGART TANKER RELEASE ( in KEYES, CA)
SUPERFUND (Superfund database)
MORENO'S DROP SHOP (5341 ROHDE ROAD in KEYES, CA)
ENFORCEMENT/COMPLIANCE ACTIVITY (Integrated Compliance Information System)
Housing units lacking complete kitchen facilities: 3.5%
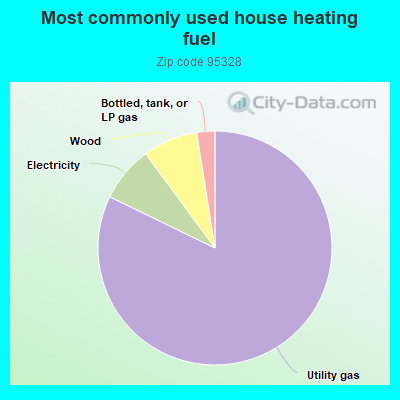
82.3%Utility gas
7.7%Electricity
7.6%Wood
2.5%Bottled, tank, or LP gas
Place of birth for U.S.-born residents:
This state: 2,575
Midwest: 100
South: 35
West: 14
60% of the 95328 zip code residents lived in the same house 5 years ago. Out of people who lived in different houses, 82% lived in this county. Out of people who lived in different counties, 50% lived in California.
97% of the 95328 zip code residents lived in the same house 1 year ago. Out of people who lived in different houses, 21% moved from this county. Out of people who lived in different houses, 92% moved from different county within same state.
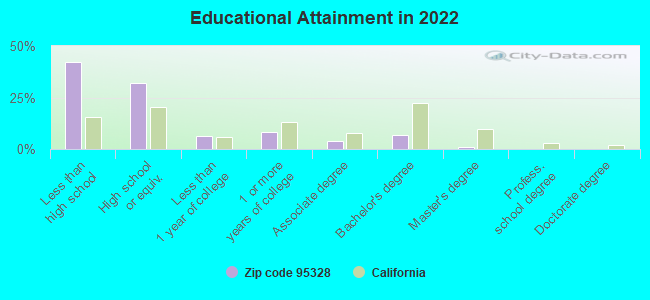
Private vs. public school enrollment:
Students in private schools in grades 1 to 8 (elementary and middle school): 25
Here:
3.5%
California:
10.5%
Students in private schools in grades 9 to 12 (high school):
Here:
0.0%
California:
8.5%
Students in private undergraduate colleges:
Here:
0.0%
California:
15.9%
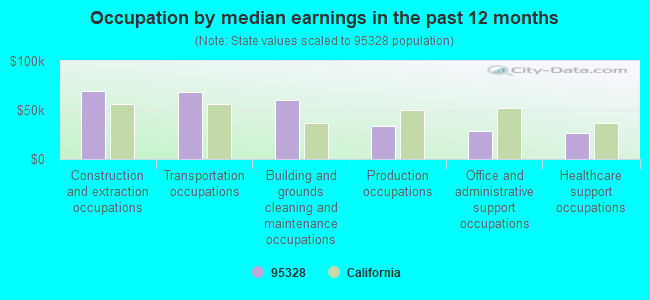
Occupation by median earnings in the past 12 months ($)
69,039Construction and extraction occupations
68,132Transportation occupations
60,433Building and grounds cleaning and maintenance occupations
33,914Production occupations
28,500Office and administrative support occupations
26,929Healthcare support occupations
Top industries in this zip code by the number of employees in 2005:
Construction: Drywall and Insulation Contractors (5-9 employees: 1 establishment)
Real Estate and Rental and Leasing: Offices of Real Estate Agents and Brokers (5-9: 1)
Other Services (except Public Administration): Religious Organizations (1-4: 1)
People in group quarters in 2010:
29 people in other noninstitutional facilities
Fatal accident statistics in 2011:
Fatal accident count: 1
Vehicles involved in fatal accidents: 1
Fatal accidents caused by drunken drivers: 0
Fatalities: 1
Persons involved in fatal accidents: 1
Pedestrians involved in fatal accidents: 1
Fatal accident statistics in 2010:
Fatal accident count: 1
Vehicles involved in fatal accidents: 1
Fatal accidents caused by drunken drivers: 0
Fatalities: 1
Persons involved in fatal accidents: 1
Pedestrians involved in fatal accidents: 0
Home Mortgage Disclosure Act Aggregated Statistics For Year 2009 (Based on 2 partial tracts)
A) FHA, FSA/RHS & VA Home Purchase Loans
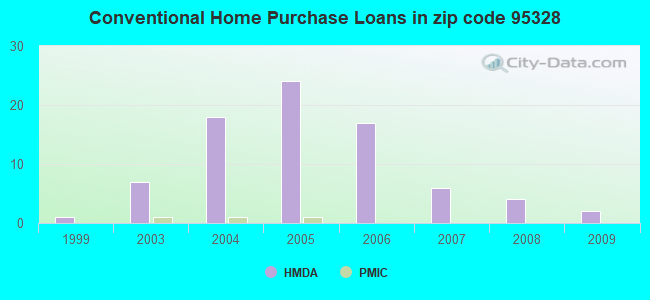
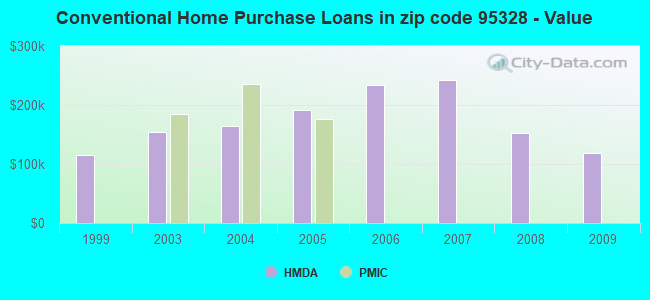
B) Conventional Home Purchase Loans
C) Refinancings
F) Non-occupant Loans on < 5 Family Dwellings (A B C & D)
Number
Average Value
Number
Average Value
Number
Average Value
Number
Average Value
LOANS ORIGINATED
6
$146,755
2
$118,490
3
$160,097
1
$83,600
APPLICATIONS APPROVED, NOT ACCEPTED
0
$0
0
$0
0
$0
0
$0
APPLICATIONS DENIED
2
$116,110
1
$64,610
3
$159,960
0
$0
APPLICATIONS WITHDRAWN
0
$0
1
$84,010
1
$140,320
0
$0
FILES CLOSED FOR INCOMPLETENESS
0
$0
0
$0
0
$0
0
$0
Aggregated Statistics For Year 2008 (Based on 2 partial tracts)
A) FHA, FSA/RHS & VA Home Purchase Loans
B) Conventional Home Purchase Loans
C) Refinancings
D) Home Improvement Loans
F) Non-occupant Loans on < 5 Family Dwellings (A B C & D)
G) Loans On Manufactured Home Dwelling (A B C & D)
Number
Average Value
Number
Average Value
Number
Average Value
Number
Average Value
Number
Average Value
Number
Average Value
LOANS ORIGINATED
6
$161,222
4
$153,058
2
$170,440
1
$47,920
1
$135,140
0
$0
APPLICATIONS APPROVED, NOT ACCEPTED
1
$80,230
1
$244,460
1
$254,900
0
$0
1
$95,270
0
$0
APPLICATIONS DENIED
1
$148,290
1
$177,960
5
$221,496
1
$102,500
1
$177,220
1
$48,500
APPLICATIONS WITHDRAWN
1
$214,130
1
$177,060
2
$169,045
0
$0
0
$0
0
$0
FILES CLOSED FOR INCOMPLETENESS
0
$0
0
$0
1
$190,050
0
$0
0
$0
0
$0
Aggregated Statistics For Year 2007 (Based on 2 partial tracts)
B) Conventional Home Purchase Loans
C) Refinancings
D) Home Improvement Loans
F) Non-occupant Loans on < 5 Family Dwellings (A B C & D)
G) Loans On Manufactured Home Dwelling (A B C & D)
Number
Average Value
Number
Average Value
Number
Average Value
Number
Average Value
Number
Average Value
LOANS ORIGINATED
6
$241,532
8
$220,194
2
$79,120
2
$212,940
0
$0
APPLICATIONS APPROVED, NOT ACCEPTED
2
$231,230
4
$242,942
1
$71,600
0
$0
0
$0
APPLICATIONS DENIED
6
$229,325
14
$272,024
2
$159,920
2
$260,165
1
$88,120
APPLICATIONS WITHDRAWN
2
$202,005
4
$214,440
1
$80,390
1
$132,340
0
$0
FILES CLOSED FOR INCOMPLETENESS
1
$144,510
1
$241,670
0
$0
0
$0
0
$0
Aggregated Statistics For Year 2006 (Based on 2 partial tracts)
B) Conventional Home Purchase Loans
C) Refinancings
D) Home Improvement Loans
F) Non-occupant Loans on < 5 Family Dwellings (A B C & D)
Number
Average Value
Number
Average Value
Number
Average Value
Number
Average Value
LOANS ORIGINATED
17
$234,652
19
$227,508
4
$114,155
3
$285,260
APPLICATIONS APPROVED, NOT ACCEPTED
5
$290,742
4
$243,580
1
$82,940
1
$270,440
APPLICATIONS DENIED
8
$265,188
11
$284,195
2
$146,400
2
$322,185
APPLICATIONS WITHDRAWN
5
$244,232
6
$256,300
1
$90,090
1
$227,450
FILES CLOSED FOR INCOMPLETENESS
1
$332,170
1
$282,270
0
$0
0
$0
Aggregated Statistics For Year 2005 (Based on 2 partial tracts)
B) Conventional Home Purchase Loans
C) Refinancings
D) Home Improvement Loans
F) Non-occupant Loans on < 5 Family Dwellings (A B C & D)
G) Loans On Manufactured Home Dwelling (A B C & D)
Number
Average Value
Number
Average Value
Number
Average Value
Number
Average Value
Number
Average Value
LOANS ORIGINATED
24
$191,769
23
$212,841
2
$167,895
4
$194,608
1
$95,520
APPLICATIONS APPROVED, NOT ACCEPTED
6
$206,418
4
$172,372
0
$0
1
$287,290
0
$0
APPLICATIONS DENIED
8
$221,488
11
$200,135
2
$63,415
2
$237,270
1
$55,810
APPLICATIONS WITHDRAWN
5
$205,894
7
$195,284
1
$130,200
1
$213,640
1
$44,060
FILES CLOSED FOR INCOMPLETENESS
1
$239,610
3
$192,073
0
$0
0
$0
0
$0
Aggregated Statistics For Year 2004 (Based on 2 partial tracts)
A) FHA, FSA/RHS & VA Home Purchase Loans
B) Conventional Home Purchase Loans
C) Refinancings
D) Home Improvement Loans
F) Non-occupant Loans on < 5 Family Dwellings (A B C & D)
G) Loans On Manufactured Home Dwelling (A B C & D)
Number
Average Value
Number
Average Value
Number
Average Value
Number
Average Value
Number
Average Value
Number
Average Value
LOANS ORIGINATED
1
$96,590
18
$164,149
17
$156,489
2
$115,985
3
$171,030
1
$53,020
APPLICATIONS APPROVED, NOT ACCEPTED
0
$0
3
$170,400
4
$184,375
0
$0
1
$96,260
0
$0
APPLICATIONS DENIED
0
$0
5
$143,472
9
$205,920
2
$77,680
1
$95,430
1
$99,050
APPLICATIONS WITHDRAWN
0
$0
2
$219,435
7
$151,154
0
$0
1
$129,790
0
$0
FILES CLOSED FOR INCOMPLETENESS
0
$0
0
$0
3
$129,053
0
$0
0
$0
0
$0
Aggregated Statistics For Year 2003 (Based on 2 partial tracts)
B) Conventional Home Purchase Loans
C) Refinancings
D) Home Improvement Loans
F) Non-occupant Loans on < 5 Family Dwellings (A B C & D)
Number
Average Value
Number
Average Value
Number
Average Value
Number
Average Value
LOANS ORIGINATED
7
$154,877
20
$124,640
1
$25,240
2
$94,160
APPLICATIONS APPROVED, NOT ACCEPTED
1
$118,040
3
$117,163
0
$0
0
$0
APPLICATIONS DENIED
3
$114,640
8
$143,490
1
$29,670
1
$120,340
APPLICATIONS WITHDRAWN
1
$158,400
5
$140,250
0
$0
0
$0
FILES CLOSED FOR INCOMPLETENESS
0
$0
1
$115,330
0
$0
0
$0
Aggregated Statistics For Year 1999 (Based on 1 partial tract)
Detailed PMIC statistics for the following Tracts:0030.02
2005 - 2018 National Fire Incident Reporting System (NFIRS) incidents
According to the data from the years 2005 - 2018 the average number of fire incidents per year is 20. The highest number of fires - 129 took place in 2005, and the least - 0 in 2006. The data has a declining trend.
When looking into fire subcategories, the most incidents belonged to: Outside Fires (50.0%), and Structure Fires (29.3%).
Fire incident types reported to NFIRS in Zip Code 95328


 Nearest zip codes: 95307, 95326, 95382, 95319, 95380, 95354.


 According to the data from the years 2005 - 2018 the average number of fire incidents per year is 20. The highest number of fires - 129 took place in 2005, and the least - 0 in 2006. The data has a declining trend.
 When looking into fire subcategories, the most incidents belonged to: Outside Fires (50.0%), and Structure Fires (29.3%).