Estimated zip code population in 2022: 3,275 Zip code population in 2010: 3,104 Zip code population in 2000: 2,990
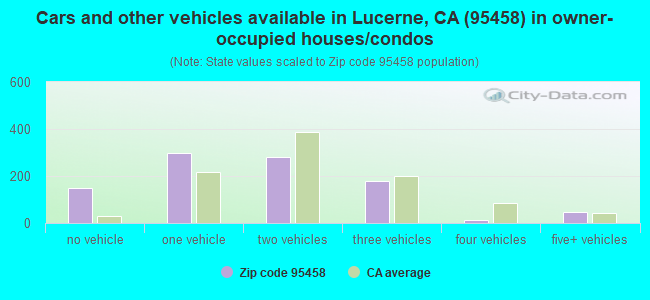
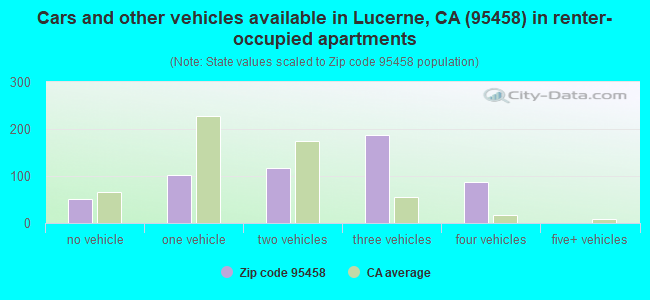
Houses and condos: 2,132 Renter-occupied apartments: 549
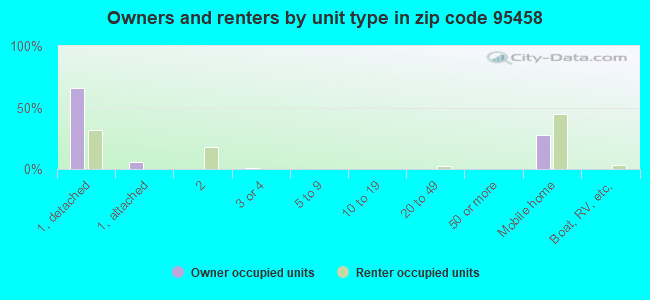
% of renters here:
37%
State:
44%
March 2022 cost of living index in zip code 95458: 92.0 (less than average, U.S. average is 100)
Land area: 49.0 sq. mi. Water area: 0.0 sq. mi.
Population density: 67 people per square mile
(very low).
OSM Map
General Map
Google Map
MSN Map
OSM Map
General Map
Google Map
MSN Map
OSM Map
General Map
Google Map
MSN Map
OSM Map
General Map
Google Map
MSN Map
Please wait while loading the map...
Real estate property taxes paid for housing units in 2022:
This zip code:
0.6% ($1,668)
California:
0.7% ($4,831)
Median real estate property taxes paid for housing units with mortgages in 2022: $1,437 (0.5%) Median real estate property taxes paid for housing units with no mortgage in 2022: $1,937 (0.7%)
Business Search- 14 Million verified businesses
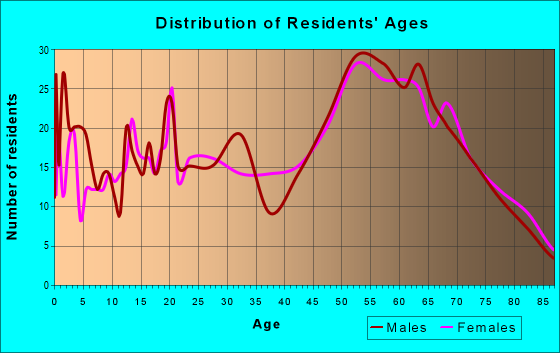
Males: 1,656
(50.6%)
Females: 1,619
(49.4%)
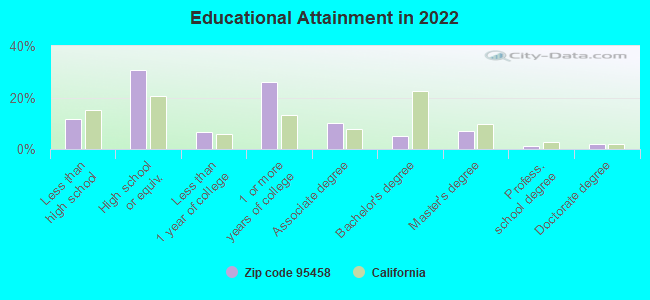
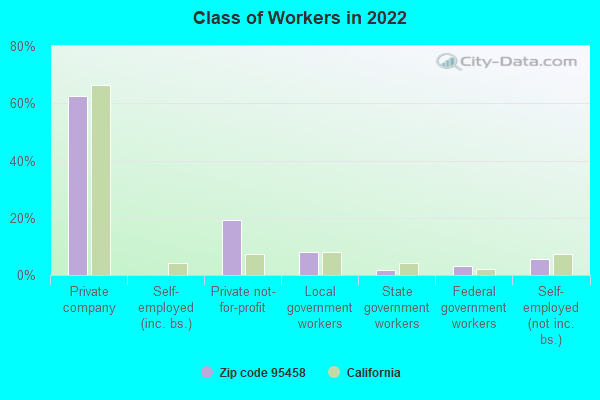
For population 25 years and over in 95458:
High school or higher: 86.9%
Bachelor's degree or higher: 15.1%
Graduate or professional degree: 10.0%
Unemployed: 7.1%
Mean travel time to work (commute): 30.0 minutes
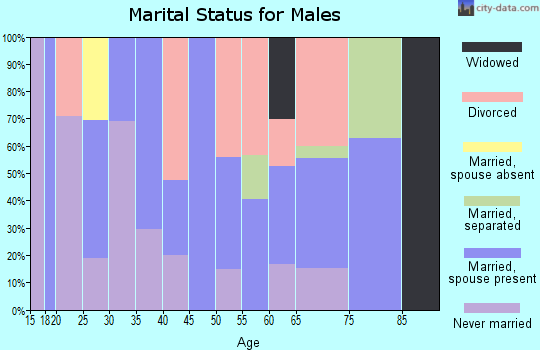
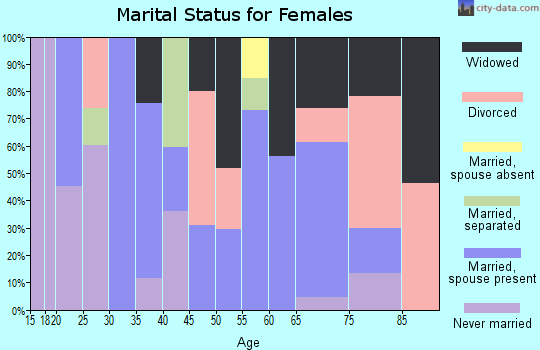
For population 15 years and over in 95458:
Never married: 30.1%
Now married: 46.6%
Separated: 1.7%
Widowed: 5.6%
Divorced: 16.0%
Zip code 95458 compared to state average:
Median household income below state average.
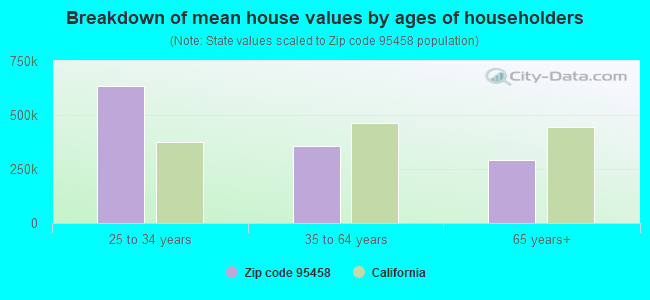
Median house value significantly below state average.
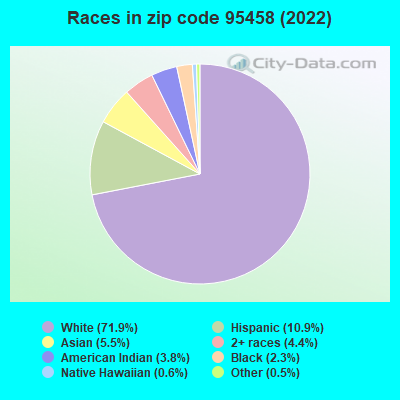
Black race population percentage below state average.
Hispanic race population percentage significantly below state average.
Foreign-born population percentage significantly below state average.
Percentage of population with a bachelor's degree or higher significantly below state average.
Averages for the 2020 tax year for zip code 95458, filed in 2021:
Average Adjusted Gross Income (AGI) in 2020: $41,375 (Individual Income Tax Returns)
Here:
$41,375
State:
$95,910
Salary/wage: $36,208 (reported on 70.5% of returns)
Here:
$36,208
State:
$77,331
(% of AGI for various income ranges: 1152.9% for AGIs below $25k, 3383.1% for AGIs $25k-50k, 5538.2% for AGIs $50k-75k, 8976.0% for AGIs $75k-100k, 20000.0% for AGIs $100k-200k)
Taxable interest for individuals: $770 (reported on 26.8% of returns)
This zip code:
$770
California:
$2,294
(% of AGI for various income ranges: 27.5% for AGIs below $25k, 23.8% for AGIs $25k-50k, 43.6% for AGIs $50k-75k, 12.0% for AGIs $75k-100k, 126.7% for AGIs $100k-200k)
Ordinary dividends: $3,378 (reported on 8.0% of returns)
Here:
$3,378
State:
$10,949
(% of AGI for various income ranges: 27.5% for AGIs below $25k, 51.9% for AGIs $25k-50k, 184.0% for AGIs $75k-100k)
Net capital gain/loss in AGI: +$6,291 (reported on 9.8% of returns)
Here:
+$6,291
State:
+$49,306
(% of AGI for various income ranges: 53.1% for AGIs $25k-50k, 85.5% for AGIs $50k-75k, 1543.3% for AGIs $100k-200k)
Profit/loss from business: +$12,033 (reported on 13.4% of returns)
Here:
+$12,033
State:
+$15,671
(% of AGI for various income ranges: 153.9% for AGIs below $25k, 217.7% for AGIs $25k-50k, 1616.0% for AGIs $75k-100k)
Taxable individual retirement arrangement distribution: $11,589 (reported on 8.0% of returns)
95458:
$11,589
California:
$23,505
(% of AGI for various income ranges: 110.0% for AGIs $25k-50k, 310.9% for AGIs $50k-75k, 830.0% for AGIs $75k-100k)
Total itemized deductions: $30,100 (reported on 4.5% of returns)
Here:
$30,100
State:
$39,517
(% of AGI for various income ranges: 195.8% for AGIs $25k-50k, 1992.0% for AGIs $75k-100k)
Charity contributions: $8,050 (reported on 1.8% of returns)
Here:
$8,050
State:
$12,598
(% of AGI for various income ranges: 61.9% for AGIs $25k-50k)
Taxes paid: $6,460 (reported on 4.5% of returns)
95458:
$6,460
State:
$8,807
(% of AGI for various income ranges: 42.7% for AGIs $25k-50k, 424.0% for AGIs $75k-100k)
Earned income credit: $2,393 (reported on 24.1% of returns)
Here:
$2,393
State:
$2,074
(% of AGI for various income ranges: 151.4% for AGIs below $25k, 85.4% for AGIs $25k-50k)
Percentage of individuals using paid preparers for their 2020 taxes: 92.0%
Here:
92%
State:
92%
(% for various income ranges: 91.1% for AGIs below $25k, 94.3% for AGIs $25k-50k, 87.5% for AGIs $50k-75k, 100.0% for AGIs $75k-100k, 85.7% for AGIs $100k-200k)
Averages for the 2012 tax year for zip code 95458, filed in 2013:
Average Adjusted Gross Income (AGI) in 2012: $34,616 (Individual Income Tax Returns)
Here:
$34,616
State:
$72,726
Salary/wage: $28,013 (reported on 73.1% of returns)
Here:
$28,013
State:
$59,079
(% of AGI for various income ranges: 68.1% for AGIs below $25k, 63.9% for AGIs $25k-50k, 55.1% for AGIs $50k-75k, 63.1% for AGIs $75k-100k, 46.8% for AGIs $100k-200k)
Taxable interest for individuals: $441 (reported on 29.0% of returns)
This zip code:
$441
California:
$2,146
(% of AGI for various income ranges: 0.8% for AGIs below $25k, 0.3% for AGIs $25k-50k, 0.3% for AGIs $50k-75k, 0.1% for AGIs $75k-100k, 0.2% for AGIs $100k-200k)
Ordinary dividends: $2,209 (reported on 11.8% of returns)
Here:
$2,209
State:
$9,308
(% of AGI for various income ranges: 2.0% for AGIs below $25k, 0.6% for AGIs $25k-50k, 0.9% for AGIs $50k-75k)
Profit/loss from business: +$8,958 (reported on 12.9% of returns)
Here:
+$8,958
State:
+$17,064
(% of AGI for various income ranges: 5.9% for AGIs below $25k, 4.5% for AGIs $25k-50k, 4.9% for AGIs $50k-75k)
Taxable individual retirement arrangement distribution: $14,922 (reported on 9.7% of returns)
95458:
$14,922
California:
$19,557
(% of AGI for various income ranges: 2.8% for AGIs below $25k, 3.1% for AGIs $25k-50k, 13.2% for AGIs $50k-75k)
Total itemized deductions: $21,314 (31% of AGI, reported on 22.6% of returns)
Here:
$21,314
State:
$34,004
Here:
31.1% of AGI
State:
22.7% of AGI
(% of AGI for various income ranges: 11.2% for AGIs below $25k, 9.4% for AGIs $25k-50k, 12.3% for AGIs $50k-75k, 16.5% for AGIs $75k-100k, 22.1% for AGIs $100k-200k)
Charity contributions: $1,615 (reported on 14.0% of returns)
Here:
$1,615
State:
$4,659
(% of AGI for various income ranges: 0.5% for AGIs below $25k, 0.4% for AGIs $25k-50k, 1.2% for AGIs $50k-75k, 1.0% for AGIs $100k-200k)
Taxes paid: $5,905 (reported on 22.6% of returns)
95458:
$5,905
State:
$14,448
(% of AGI for various income ranges: 2.5% for AGIs below $25k, 2.4% for AGIs $25k-50k, 3.0% for AGIs $50k-75k, 4.2% for AGIs $75k-100k, 7.6% for AGIs $100k-200k)
Earned income credit: $2,130 (reported on 29.0% of returns)
Here:
$2,130
State:
$2,286
(% of AGI for various income ranges: 7.2% for AGIs below $25k, 1.6% for AGIs $25k-50k)
Percentage of individuals using paid preparers for their 2012 taxes: 48.4%
Here:
48%
State:
64%
(% for various income ranges: 41.7% for AGIs below $25k, 54.2% for AGIs $25k-50k, 58.3% for AGIs $50k-75k, 40.0% for AGIs $75k-100k, 75.0% for AGIs $100k-200k)
Averages for the 2004 tax year for zip code 95458, filed in 2005:
Average Adjusted Gross Income (AGI) in 2004: $33,402 (Individual Income Tax Returns)
Here:
$33,402
State:
$58,600
Salary/wage: $28,306 (reported on 72.3% of returns)
Here:
$28,306
State:
$49,455
(% of AGI for various income ranges: 80.7% for AGIs below $10k, 66.3% for AGIs $10k-25k, 70.3% for AGIs $25k-50k, 65.4% for AGIs $50k-75k, 62.0% for AGIs $75k-100k, 42.5% for AGIs over 100k)
Taxable interest for individuals: $2,836 (reported on 39.7% of returns)
This zip code:
$2,836
California:
$2,365
(% of AGI for various income ranges: 14.8% for AGIs below $10k, 3.6% for AGIs $10k-25k, 1.7% for AGIs $25k-50k, 1.2% for AGIs $50k-75k, 0.5% for AGIs $75k-100k, 6.8% for AGIs over 100k)
Taxable dividends: $2,020 (reported on 15.0% of returns)
Here:
$2,020
State:
$4,746
(% of AGI for various income ranges: 1.4% for AGIs below $10k, 1.8% for AGIs $10k-25k, 1.4% for AGIs $25k-50k, 0.5% for AGIs $50k-75k, 0.4% for AGIs over 100k)
Net capital gain/loss: +$14,791 (reported on 14.8% of returns)
Here:
+$14,791
State:
+$23,418
(% of AGI for various income ranges: -1.8% for AGIs below $10k, -0.4% for AGIs $10k-25k, 1.6% for AGIs $25k-50k, 1.7% for AGIs $50k-75k, 23.5% for AGIs over 100k)
Profit/loss from business: +$6,446 (reported on 13.0% of returns)
Here:
+$6,446
State:
+$16,826
(% of AGI for various income ranges: 8.1% for AGIs below $10k, 1.9% for AGIs $10k-25k, 3.8% for AGIs $25k-50k, 4.1% for AGIs $50k-75k, 1.7% for AGIs $75k-100k)
Total itemized deductions: $18,796 (29% of AGI, reported on 28.0% of returns)
Here:
$18,796
State:
$28,113
Here:
29.2% of AGI
State:
25.3% of AGI
(% of AGI for various income ranges: 12.7% for AGIs below $10k, 11.5% for AGIs $10k-25k, 12.5% for AGIs $25k-50k, 16.1% for AGIs $50k-75k, 23.2% for AGIs $75k-100k, 19.8% for AGIs over 100k)
Charity contributions deductions: $1,664 (2% of AGI, reported on 21.7% of returns)
Here:
$1,664
State:
$3,923
Here:
2.5% of AGI
State:
3.3% of AGI
(% of AGI for various income ranges: 0.7% for AGIs $10k-25k, 1.1% for AGIs $25k-50k, 1.0% for AGIs $50k-75k, 1.8% for AGIs $75k-100k, 1.3% for AGIs over 100k)
Total tax: $4,482 (reported on 67.7% of returns)
95458:
$4,482
State:
$10,761
(% of AGI for various income ranges: 2.1% for AGIs below $10k, 3.4% for AGIs $10k-25k, 6.9% for AGIs $25k-50k, 8.9% for AGIs $50k-75k, 11.2% for AGIs $75k-100k, 15.4% for AGIs over 100k)
Earned income credit: $1,702 (reported on 23.8% of returns)
Here:
$1,702
State:
$1,763
Percentage of individuals using paid preparers for their 2004 taxes: 60.5%
Here:
60%
State:
66%
(% for various income ranges: 53.3% for AGIs below $10k, 56.5% for AGIs $10k-25k, 62.8% for AGIs $25k-50k, 69.4% for AGIs $50k-75k, 76.5% for AGIs $75k-100k, 77.3% for AGIs over 100k)
Household received Food Stamps/SNAP in the past 12 months: 373 Household did not receive Food Stamps/SNAP in the past 12 months: 1,165
Women who did not have a birth in the past 12 months: 550 (265 now married, 282 unmarried)
Housing units in zip code 95458 with a mortgage: 479 (13 second mortgage) Median monthly owner costs for units with a mortgage: $1,294 Median monthly owner costs for units without a mortgage: $693
Residents with income below the poverty level in 2022:
This zip code:
16.2%
Whole state:
12.2%
Residents with income below 50% of the poverty level in 2022:
This zip code:
7.2%
Whole state:
6.2%
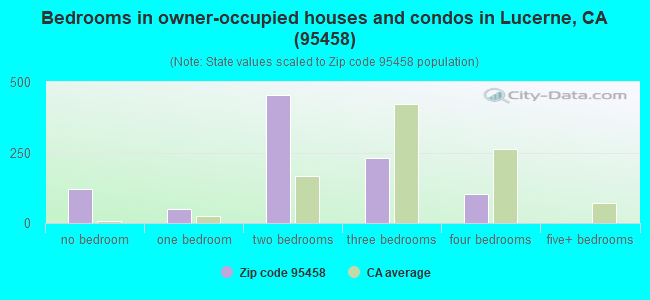
Median number of rooms in houses and condos:
Here:
4.9
State:
6.0
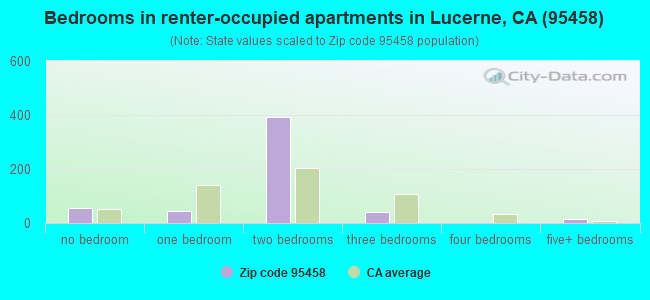
Median number of rooms in apartments:
Here:
4.4
State:
3.9
Notable locations in this zip code not listed on our city pages
Notable locations in zip code 95458: Lucerne Christian Conference Center (A), Bartlett Flat Forest Service Facility (B), Northshore Fire Protection District Station 80 Lucerne Headquarters (C). Display/hide their locations on the map
Churches in zip code 95458 include: Queen of the Rosary Catholic Church (A), Sonrise Assembly Charismatic Church (B). Display/hide their locations on the map
Streams, rivers, and creeks: South Fork Bartlett Creek (A), Soap Creek (B), Hospital Creek (C), Forty Springs Valley (D), North Fork Bartlett Creek (E), Twin Valley (F). Display/hide their locations on the map
In group quarters: 5 (-1 institutionalized population)
Size of family households: 391 2-persons, 274 3-persons, 66 4-persons, 23 6-persons, 12 7-or-more-persons
Size of nonfamily households: 591 1-person, 112 2-persons, 44 3-persons
239 married couples with children.
121 single-parent households (45 men, 76 women).
89.3% of residents of 95458 zip code speak English at home.
5.1% of residents speak Spanish at home (76% very well, 22% not well, 2% not at all).
4.8% of residents speak other Indo-European language at home (92% very well, 8% well).
0.2% of residents speak other language at home (100% very well).
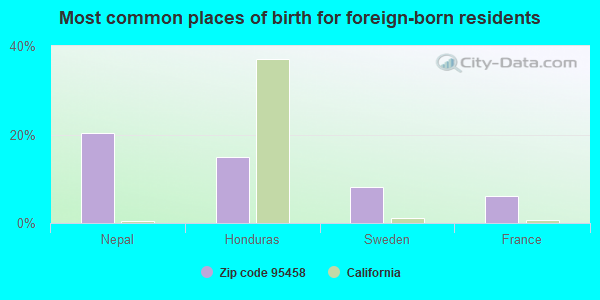
Foreign born population: 318 (9.7%) (86.0% of them are naturalized citizens)
This zip code:
9.7%
Whole state:
26.7%
20%Nepal
15%Honduras
8%Sweden
6%France
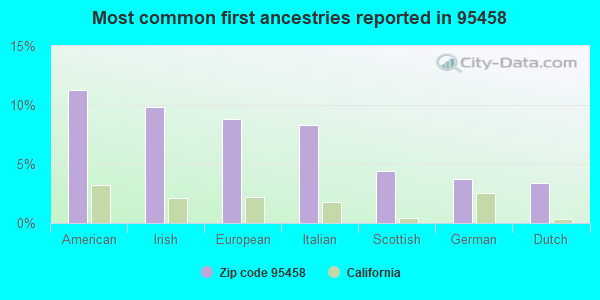
11%American
10%Irish
9%European
8%Italian
4%Scottish
4%German
3%Dutch
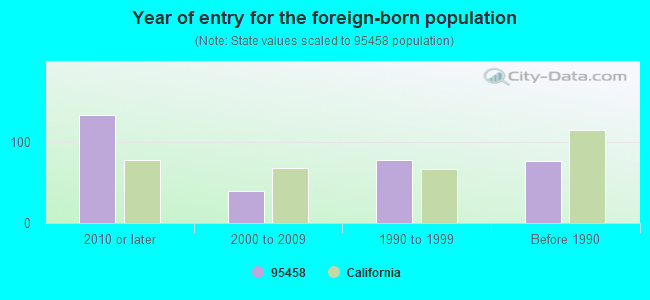
Year of entry for the foreign-born population
1332010 or later
402000 to 2009
771990 to 1999
76Before 1990
Facilities with environmental interests located in this zip code:
LUCERNE ELEMENTARY (3351 COUNTRY CLUB DR. in LUCERNE, CA)
(National Center for Education Statistics) - STATE ID-6010656
HI-GRADE MATERIALS CO (80701 MERIDIAN RD in LUCERNE, CA)
CRITERIA AND HAZARDOUS AIR POLLUTANT INVENTORY (Inventory of air pollution sources) Business SIC classification: CONSTRUCTION SAND AND GRAVEL
LUCERNE VALLEY DISPOSAL SITE (CAMP ROCK RD in LUCERNE, CA)
CRITERIA AND HAZARDOUS AIR POLLUTANT INVENTORY (Inventory of air pollution sources) Business SIC classification: REFUSE SYSTEMS Business NAICS classification: SOLID WASTE LANDFILL.
MORRISON CREEK DUMP (494 DUNSTAN DR in LUCERNE, CA)
CRITERIA AND HAZARDOUS AIR POLLUTANT INVENTORY (Inventory of air pollution sources) Business SIC classification: REFUSE SYSTEMS Business NAICS classification: SOLID WASTE LANDFILL.
Housing units lacking complete plumbing facilities: 2.8% Housing units lacking complete kitchen facilities: 3.6%
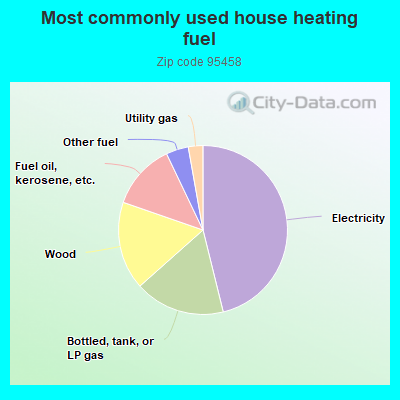
46.2%Electricity
17.3%Bottled, tank, or LP gas
16.9%Wood
12.6%Fuel oil, kerosene, etc.
4.3%Other fuel
2.8%Utility gas
Population in 1990: 2,330. Population change in the 1990s: +660 (+28.3%).
Place of birth for U.S.-born residents:
This state: 2,144
Northeast: 196
Midwest: 167
South: 133
West: 303
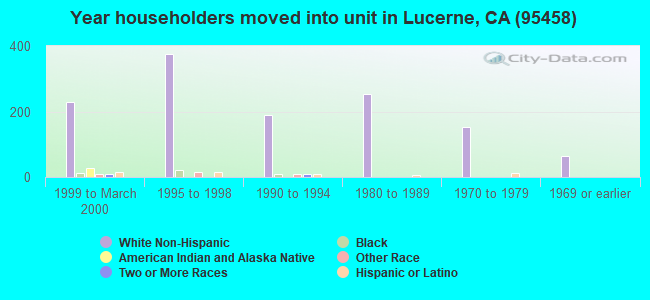
45% of the 95458 zip code residents lived in the same house 5 years ago. Out of people who lived in different houses, 38% lived in this county. Out of people who lived in different counties, 50% lived in California.
84% of the 95458 zip code residents lived in the same house 1 year ago. Out of people who lived in different houses, 46% moved from this county. Out of people who lived in different houses, 43% moved from different county within same state. Out of people who lived in different houses, 9% moved from different state.
Private vs. public school enrollment:
Students in private schools in grades 1 to 8 (elementary and middle school): 15
Here:
6.6%
California:
10.5%
Students in private schools in grades 9 to 12 (high school):
Here:
0.0%
California:
8.5%
Students in private undergraduate colleges: 34
Here:
13.9%
California:
15.9%
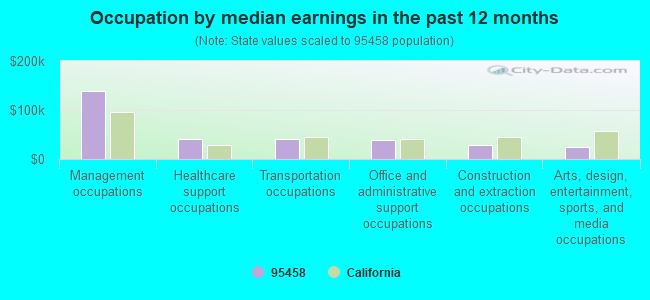
Occupation by median earnings in the past 12 months ($)
139,327Management occupations
41,749Healthcare support occupations
40,975Transportation occupations
39,713Office and administrative support occupations
28,072Construction and extraction occupations
23,492Arts, design, entertainment, sports, and media occupations
Companies with federal contracts located in this zip code:
Dennis Schebler Construction (P.O. Box 1405 in Lucerne, CA; small business)
$2,067 with Forest Service for Construction of Structures and Facilities -- Miscellaneous Buildings. Signed on 2004-09-16. Completion date: 2004-10-25.
Top industries in this zip code by the number of employees in 2005:
Accommodation and Food Services: Limited-Service Restaurants (5-9 employees: 3 establishments)
Construction: Painting and Wall Covering Contractors (10-19: 1)
Health Care and Social Assistance: Offices of Physicians (except Mental Health Specialists) (5-9: 1, 1-4: 2)
Other Services (except Public Administration): Diet and Weight Reducing Centers (5-9: 1)
Health Care and Social Assistance: Services for the Elderly and Persons with Disabilities (5-9: 1)
Other Services (except Public Administration): Religious Organizations (5-9: 1)
Professional, Scientific, and Technical Services: Tax Preparation Services (5-9: 1)
People in group quarters in 2010:
35 people in other noninstitutional facilities
People in group quarters in 2000:
6 people in homes or halfway houses for drug/alcohol abuse
Fatal accident statistics in 2013:
Fatal accident count: 1
Vehicles involved in fatal accidents: 1
Fatal accidents caused by drunken drivers: 0
Fatalities: 1
Persons involved in fatal accidents: 2
Pedestrians involved in fatal accidents: 0
Fatal accident statistics in 2012:
Fatal accident count: 1
Vehicles involved in fatal accidents: 1
Fatal accidents caused by drunken drivers: 0
Fatalities: 1
Persons involved in fatal accidents: 2
Pedestrians involved in fatal accidents: 0
2002 - 2018 National Fire Incident Reporting System (NFIRS) incidents
Based on the data from the years 2002 - 2018 the average number of fires per year is 14. The highest number of fires - 29 took place in 2006, and the least - 0 in 2003. The data has an increasing trend.
When looking into fire subcategories, the most reports belonged to: Outside Fires (46.6%), and Structure Fires (42.4%).
Fire incident types reported to NFIRS in Zip Code 95458


 Nearest zip codes: 95443, 95464, 95423, 95485, 95435, 95422.
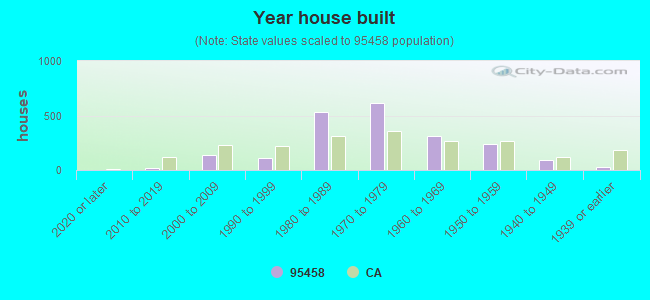


 Based on the data from the years 2002 - 2018 the average number of fires per year is 14. The highest number of fires - 29 took place in 2006, and the least - 0 in 2003. The data has an increasing trend.
 When looking into fire subcategories, the most reports belonged to: Outside Fires (46.6%), and Structure Fires (42.4%).